|
|
Post by stockpicker on Jun 6, 2014 8:20:23 GMT 7
Yes, when one see the margins trades coming on line, better siam quickly.. Zombie sale is going to start any time..
|
|
|
|
Post by stockpicker on Jun 13, 2014 5:40:43 GMT 7
Another day, another test. Is US market going to be serious or it is just another trick for them to go higher? U.S. stocks fell on Thursday after disappointing economic data on retail sales and jobless claims. Then someone mooted about the concerns of happenings in Iraq where US's oil supply would be threatened by the unstable political situation there. Are these all real this time? This chart is telling us that something is beginning to happen in the DOW that we should not ignore. DOW has just broken the support found on Wednesday which was actually the earlier resistance to prevent DOW scaling another new high. This is significant as it is also where the conversion line (purple) was. The breaking of the conversion line also shows the start of a weakness trend where problem could escalate into uncontrollable state in which one could see DOW testing the lower wedge line which has been restricting DOW since Feb 2014. If for some reasons that DOW should fail the test, then, it might want to race to the next support which is around 16,400. This is also the support of the Price by Volume (PBV) which most PBV traders believe that it is the likely level that DOW would find its next support. As DOW has been moving aimlessly for the past 2 months, it is also likely to do so in the coming months unless there are tensions rising elsewhere that would threaten the growth the US economy. One mustn't forget that US has found large reserve of shale oil that can now extract lot of natural gas to supplement oil reserve. The Iraq problem still pose a threat but not as much as it would have been about 10 years ago. 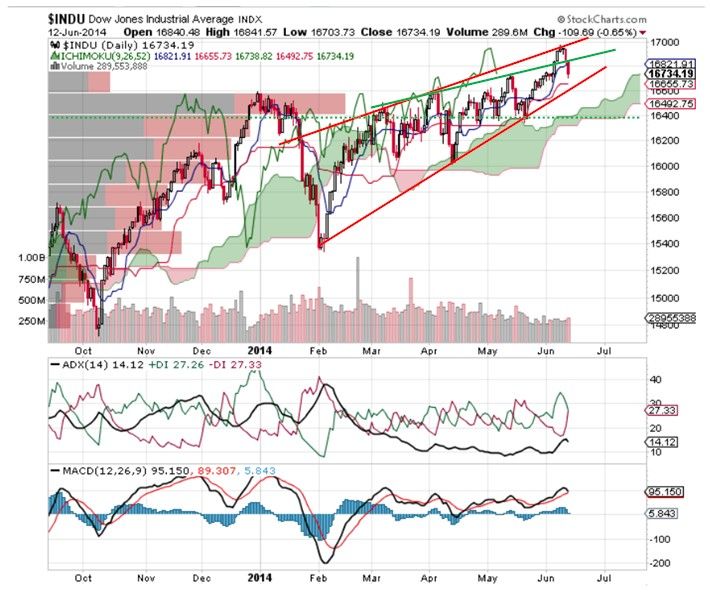 |
|
|
|
Post by zuolun on Jun 23, 2014 15:18:11 GMT 7
|
|
|
|
Post by stockpicker on Jun 29, 2014 9:18:34 GMT 7
It has been a hectic year with US stock price kept moving up despite plenty of worries about the US economy. It is believed that all those gains are the works of Bernanke whom, many have said, a bomb have been planted, ready to explode any time. Meanwhile, the US stock markets are trying to stay afloat at their peaks. Technically, DOW reached a cross road where one could find the bear camp started to push down the indexes in 2 consecutive successions only to find that bull camp pushing the indexes back to the support (the conversion line of the ichimoku chart). Once this support is broken, it should signal the start of testing the rising wedge supports as shown. Until DOW could break the rising wedge support convincingly, there is no certainty that a serious correction could begin. For most of us, sitting on the fence, we could only wait and see. 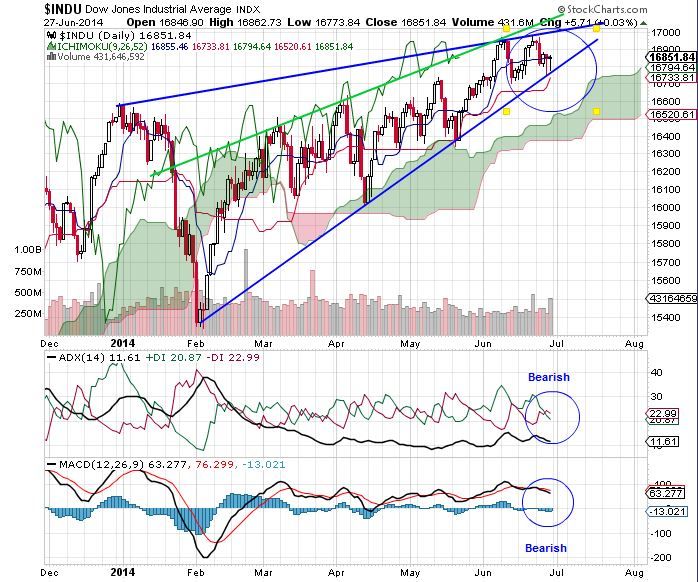 |
|
|
|
Post by zuolun on Jul 16, 2014 12:56:24 GMT 7
|
|
|
|
Post by zuolun on Jul 22, 2014 7:43:14 GMT 7
Dow Jones Industrial Average (DJIA) Index: Rising Wedge Formation — 18 July 2014 Dow Jones Industrial Average (DJIA) Index is showing a Rising Wedge formation. A Rising Wedge formation is generally consider to be a bearish pattern that show a wide bottom near the begins and contracts as prices move higher and display a narrows trading range near the end of it. However watch out if DJIA index breakout from the slant green line as that might confirm a bearish Rising Wedge and DJIA might go lower from here to the next support level.   The DJ is running on autopilot without emotions; after hitting every record high with a slight pullback, the default setting will trigger a higher high. On 12 May 2014, the DJ broke the last high @ 16,631 and closed at fresh record high @ 16,695.47. The DJ is well-supported by the 50d SMA and trading at the upper bollinger bands indicating bullishness. However, the extremely strong up-move has not been accompanied by strong trading volume and it's forming a bearish rising wedge pattern with higher highs and higher lows. This bearish price volume divergence is a clear -ve signal indicating that the up-move is a bull trap set up, expect a nasty sell-off. DJ — A potential blue-sky breakout; TP 17,500DJ closed with an inverted hammer @ 16,695.47 (+112.13, +0.68%) on 12 May 2014. Immediate resistance @ 16,703, immediate support @ 16,381. 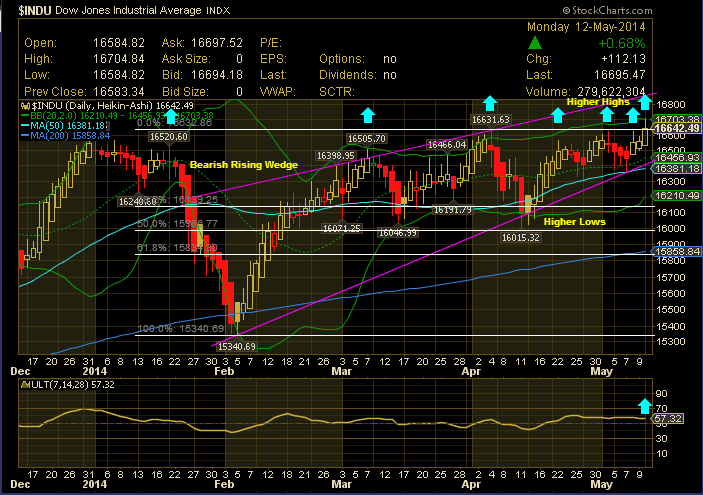
|
|
|
|
Post by zuolun on Jul 22, 2014 7:58:38 GMT 7
|
|
|
|
Post by stockpicker on Jul 24, 2014 8:01:17 GMT 7
DOW is definitely in the apex of a rising wedge unless it can break up when Fed come along a mess things up again by injecting more stimulus. There are already signs that DOw and the rest of US indexes are slowing down, awaiting for any news that may give them a lift; otherwise, an adjustment downward will be expected.. 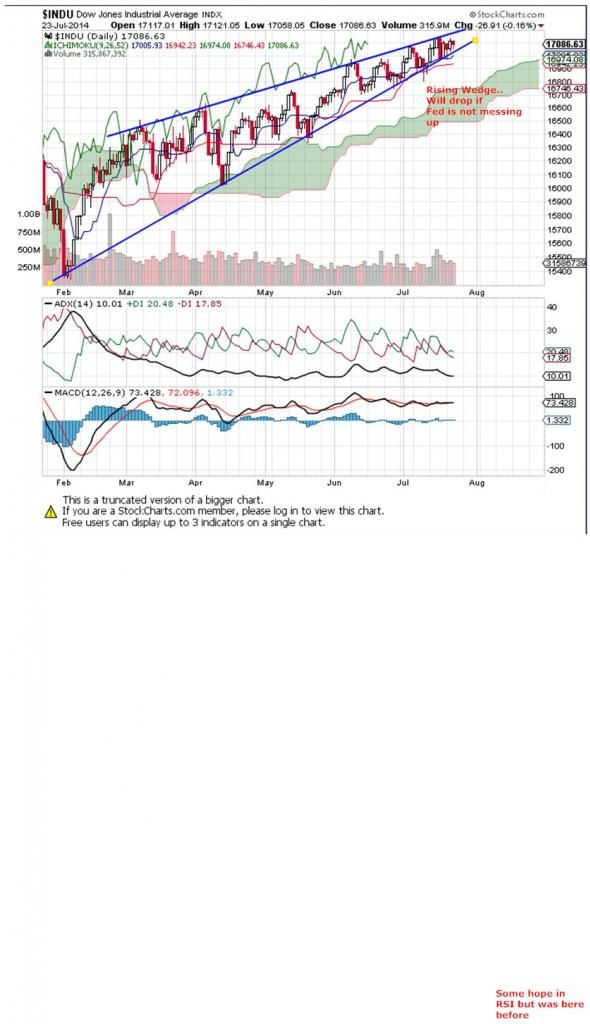 |
|
|
|
Post by stockpicker on Jul 26, 2014 7:17:29 GMT 7
For the very first time since Feb 2014, DOW took a tumble, broke and fell below the rising wedge, making way for the first fall below a trendline for a very long time. The US markets ignored the rise in the sale of durable goods and concentrated in the earnings in which Amazon and Visa reported dismay results. DOW will find the next support around 16,800 and if that support is also bleached, will see DOW falling heavily. 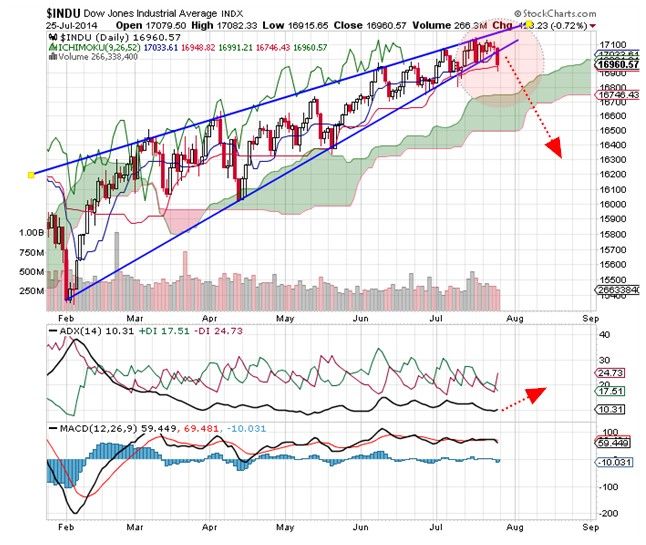 |
|
|
|
Post by stockpicker on Jul 27, 2014 0:15:49 GMT 7
This article is interesting when it showed a flattened 30y-5y yield chart indicating that the yield gap btw the 30-year and 5-year bond has narrowed to a level only seen in 2009. What is interesting is not about the narrowing yield gap but what happened when it started to narrow.. 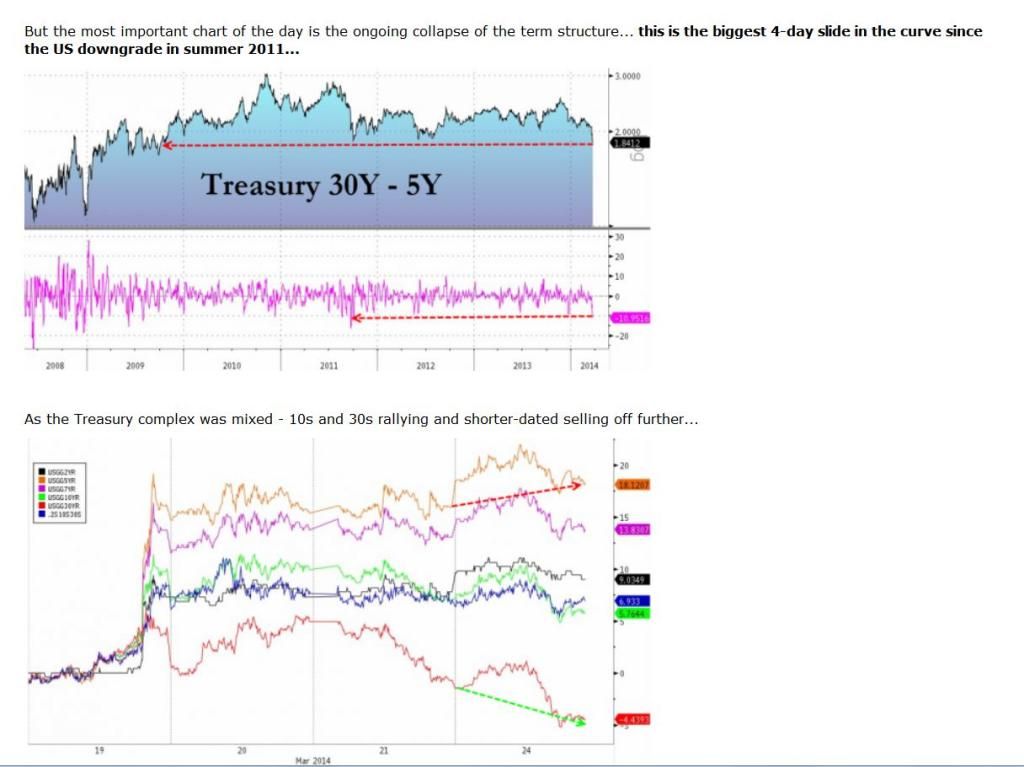 If we examine the attached 30-5 yield chart, we could find that the yield gaps were also low around Aug 2011 and June 2012 but nothing happened although the US market took a tumble then; however, the market and the yield gap recovered soon after. It is believed that Bernanke's Operation Twist in Sept 2011 and QE3 infinity in Sept 2012 were behind the scene at that time. Now we found another low in the 30-5 yield curve.. Wonder what will Yellen do this time.. |
|
|
|
Post by stockpicker on Jul 27, 2014 18:55:37 GMT 7
Why Yield Curve flattened? When investors know that future interest rate is going to be higher, they will price the yield of the longer term bond lower to balance up for the value gain and vice versa. This flattened the yield curve causing the yield gap between the shorter and longer term to be narrowed or yield curve flattened. This was what happened in the recent months as the market is expecting FED to increase its rate soon in or before 2015. The curve can be also flattened if the investors expected slower economy growth or higher inflation. bonds.about.com/od/advancedbonds/a/yieldcurve.htmWhatever that means, the market is expecting something to change in the very near future and it may not be a good for the market.. This chart will show that whenever there is a contraction or flattening in the yield curve, it may develop an inverted yield curve causing a recession to follow soon after.. 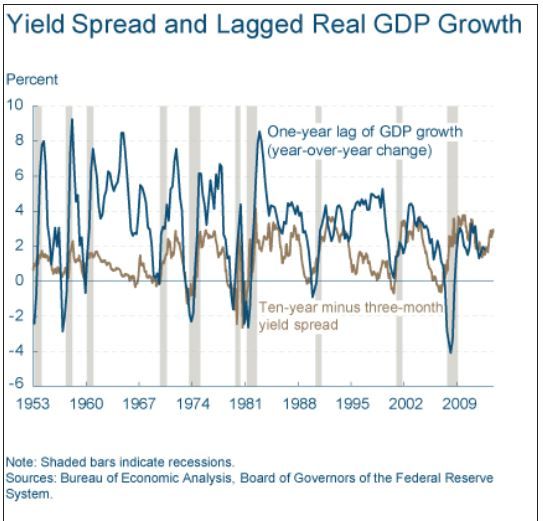 The above chart embedded in this article posted on 10 March 2014 (dated only in the summary of the homepage) was pretty sure that there was absolutely no sign of any flattening, let alone inversion. The author might want to change his mind now if he had noticed the yield curve had just been flattened recently. internationalbanker.com/brokerage/relationship-yield-curve-previous-peaks-business-cycle/ |
|
|
|
Post by zuolun on Jul 27, 2014 21:48:19 GMT 7
As long as the key support is not broken convincingly, DJ may continue its higher highs and higher lows hitting new record high after every pullback; TP @ 17,500 points while the rising wedge remains a formation. Certain chart pattern maintains its uptrend for years, prior to a steep correction / bearish major trend reversal. Example: Ezion as at 24 July 2014 — Ascending Broadening Wedge, classic support @ S$1.99. 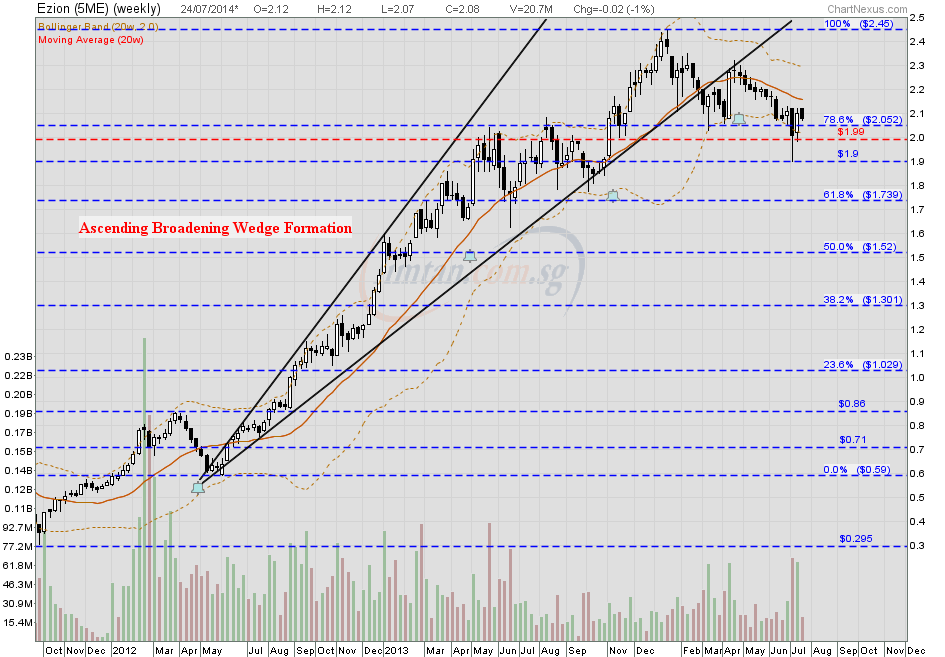 Example: Ezion as at 30 Nov 2012 Example: Ezion as at 30 Nov 2012 — Rising Wedge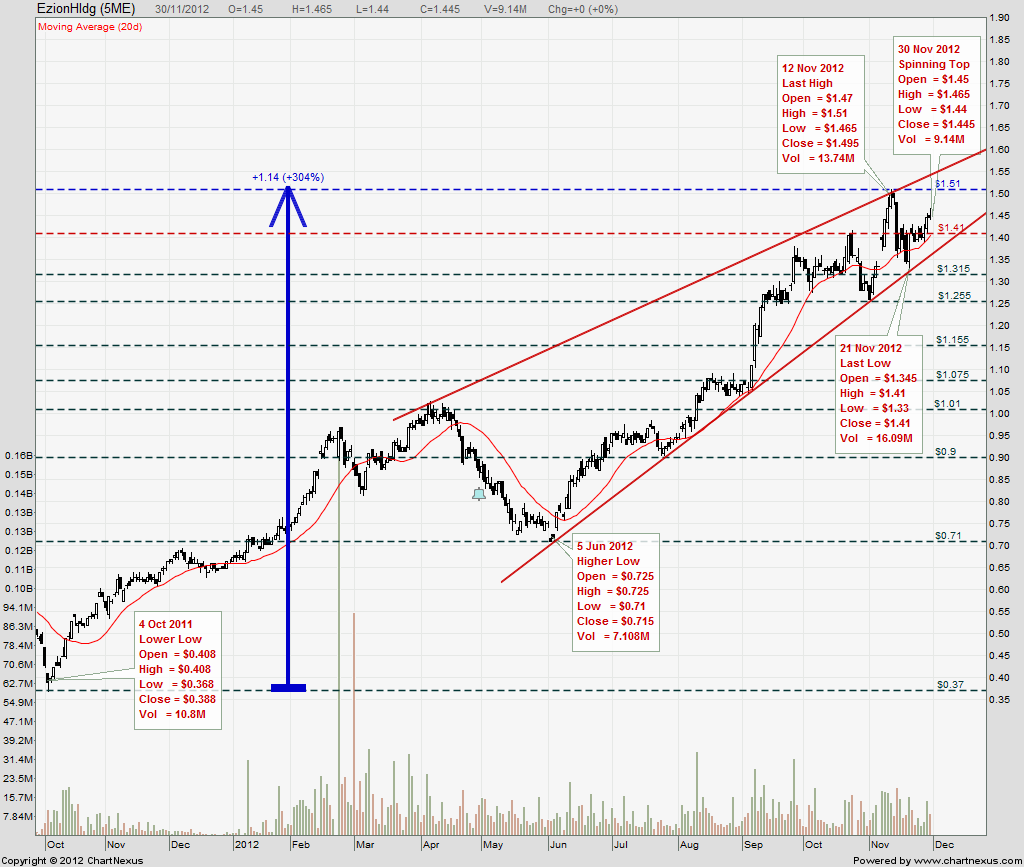 Dow Jones Industrial Average (DJIA) Index: Rising Wedge Formation — 18 July 2014 Dow Jones Industrial Average (DJIA) Index is showing a Rising Wedge formation. A Rising Wedge formation is generally consider to be a bearish pattern that show a wide bottom near the begins and contracts as prices move higher and display a narrows trading range near the end of it. However watch out if DJIA index breakout from the slant green line as that might confirm a bearish Rising Wedge and DJIA might go lower from here to the next support level. The DJ is running on autopilot without emotions; after hitting every record high with a slight pullback, the default setting will trigger a higher high. On 12 May 2014, the DJ broke the last high @ 16,631 and closed at fresh record high @ 16,695.47. The DJ is well-supported by the 50d SMA and trading at the upper bollinger bands indicating bullishness. However, the extremely strong up-move has not been accompanied by strong trading volume and it's forming a bearish rising wedge pattern with higher highs and higher lows. This bearish price volume divergence is a clear -ve signal indicating that the up-move is a bull trap set up, expect a nasty sell-off. DJ — A potential blue-sky breakout; TP 17,500DJ closed with an inverted hammer @ 16,695.47 (+112.13, +0.68%) on 12 May 2014. Immediate resistance @ 16,703, immediate support @ 16,381. |
|
|
|
Post by stockpicker on Jul 28, 2014 8:27:51 GMT 7
The weekly and longer term daily chart attached showed that DOW is still running within the channels or wedges but it is quickly showing signs of weaknesses. A series of 8 weekly sequential exchanges from rise to fall in DOW was last appearing around 2007. As expected, the flattening of the yield curve have caused trouble in the US banking index and the US housing index. The banking index is quickly showing signs of performance deterioration with downtrend indications.. Once the head and shoulder pattern is broken down, it will start to fall, bringing DOW and other US markets including the Global markets into trouble...On the other hand, the housing index was greatly troubled by the stimulus withdrawal and the speculation of Fed rate rises. After breaking away from the rising wedge, the housing index was running on a different track, losing its momentum and direction, awaiting a decision to be make. The above observations appear to suggest that the US markets are struggling to stay awake, loosing its forward momentum after being trouble with the speculation that Fed will soon start increasing the Fed rate in 2015. The US inflation rate also hit more than 2.1% in the last 2 months adding more to the worries. These worrying development could have hit the nerves of the investors and initiated the flattening of the yield curve. Unless these worries are taking away with Fed turning its wheel backwards and restart its stimulus program, it is very likely that the US markets will first turn bad before it could become better. 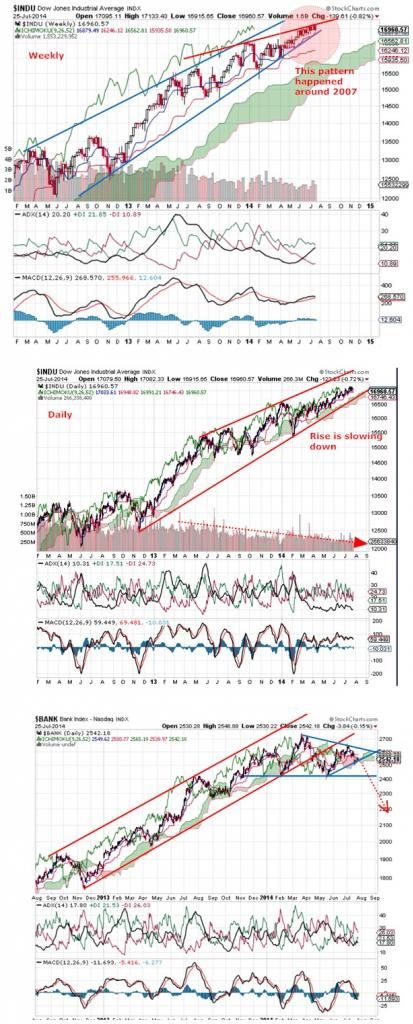  |
|
|
|
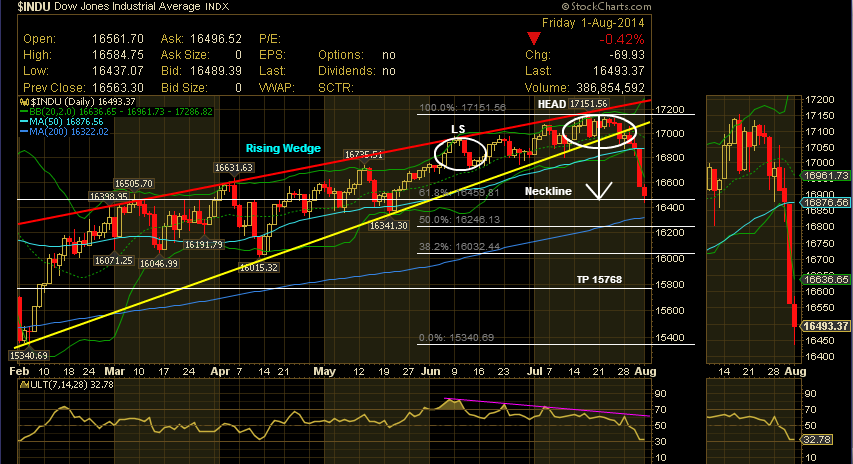
Post by stockpicker on Aug 1, 2014 9:23:39 GMT 7
DOW has just broken the second trendline (blue) as shown.. if it go ahead and break the next 3rd trendline (red) around 16,000, that will trigger further falls.. 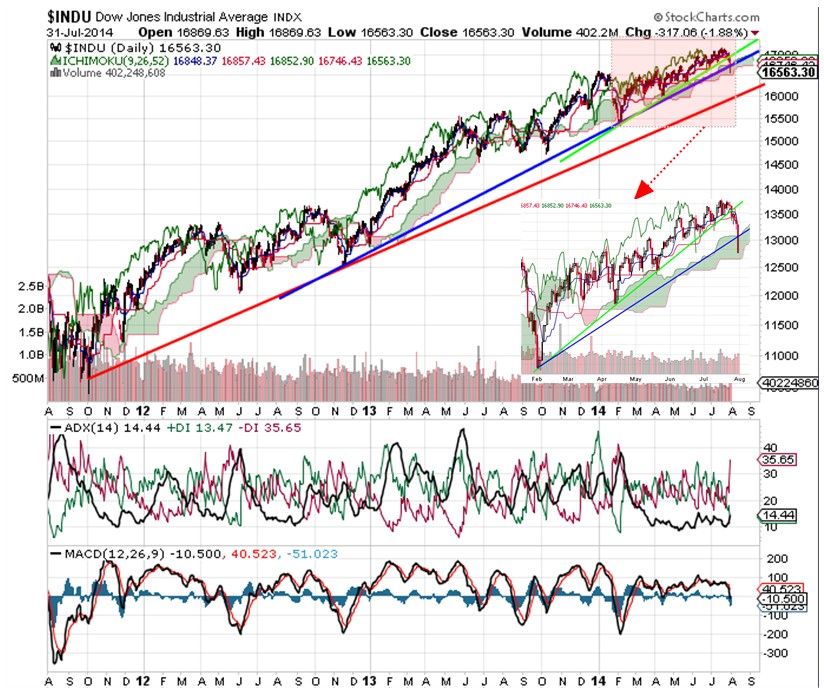 |
|
|
|
Post by zuolun on Aug 4, 2014 2:31:50 GMT 7
|
|