|
|
Post by zuolun on Jun 4, 2015 5:14:19 GMT 7
I learned 3 lessons: 1) There are plenty of opportunities in the market. It is so easy to make good money if you have the kung-Fu. 2) There are just enough risk investing in stock market. It can make a poor person very poor. 3) Remind me of The three rules to survive in trading, "Cut loss, cut loss and cut loss". I have many relatives still holding counters such as Jadason, Life Brandz, Advance SCT, and Metech(Aka Centillion) . The value of these stock now is only about 1-3% of their prime-day       |
|
|
|
Post by zuolun on Jun 8, 2015 9:59:17 GMT 7
Thank you Bro Zuolun, Is it correct to apply the same strategy of Sino Gradness (REF DATE: 18th MAY 2015) to Zelan now ? , The more you practise drawing your own charts, the better you are!  Your're right! Sino Grandness's Bearish Gartley Bat pattern is still valid. Compare Sino Grandness with ZELAN; the latter is +ve because it's still trading above the 4 MAs as at 5 Jun 2015. Watch the resistance @ RM0.395, the last high; once the share price shoots and sits firmly above it, ZELAN has potential to hit RM0.43 or point D. Sino Grandness and ZELAN: Chart Pattern ~ Bearish Gartley Pattern  |
|
|
|
Post by sptl123 on Jun 8, 2015 23:22:56 GMT 7
sptl123, The more you practise drawing your own charts, the better you are! Your're right! Sino Grandness's Bearish Gartley Bat pattern is still valid. Compare Sino Grandness with ZELAN; the latter is +ve because it's still trading above the 4 MAs as at 5 Jun 2015. Watch the resistance @ RM0.395, the last high; once the share price shoots and sits firmly above it, ZELAN has potential to hit RM0.43 or point D. Thank You very much Bro Zuolun. (A) I practice and redraw the Gartley Pattern. a) Shift point D to a future date since it is a potential/future event. b) With Fibnonacci ratio indicated so beginner like me could read easily. (B) Trading Ideas~ I have long Zelan because: (i) Price above all 4 SMA and MACD cross Signal line. (ii) Chikou-span above kumo and above price. (iii) Price now above kumo and above Tenkan-Sen. I think I will add more if and when Kumo breakout and price above Kijun-Sen. As that mean the price is moving toward D to complete the projected Gartley Pattern. Bro Zuolun, are the above technically correct or incorrect ? 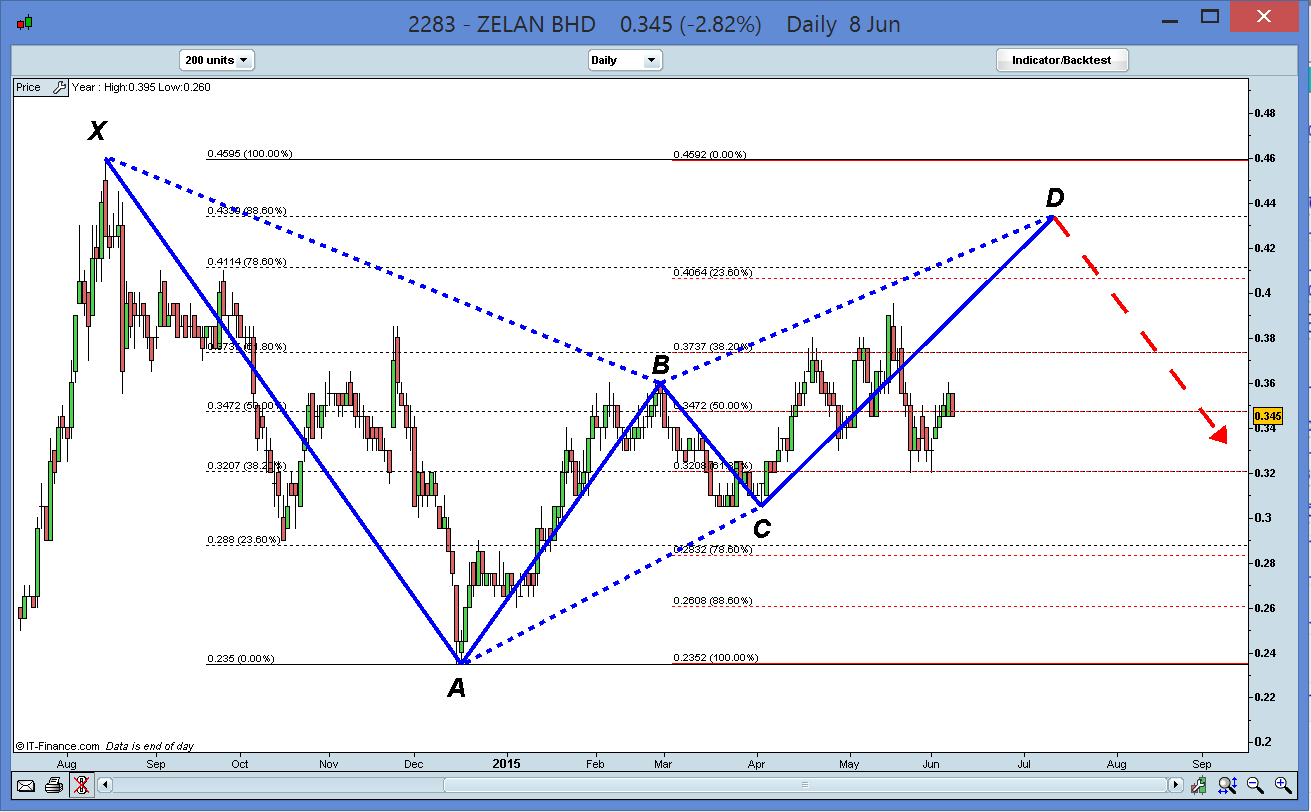 |
|
|
|
Post by zuolun on Jun 12, 2015 14:11:58 GMT 7
 Noble and QT Vascular: Chart Pattern ~ Racing to the bottom Noble and QT Vascular: Chart Pattern ~ Racing to the bottom  |
|
|
|
Post by zuolun on Jun 12, 2015 15:59:18 GMT 7
CityDev and NOL: Chart Pattern ~ Bear Flag Breakout  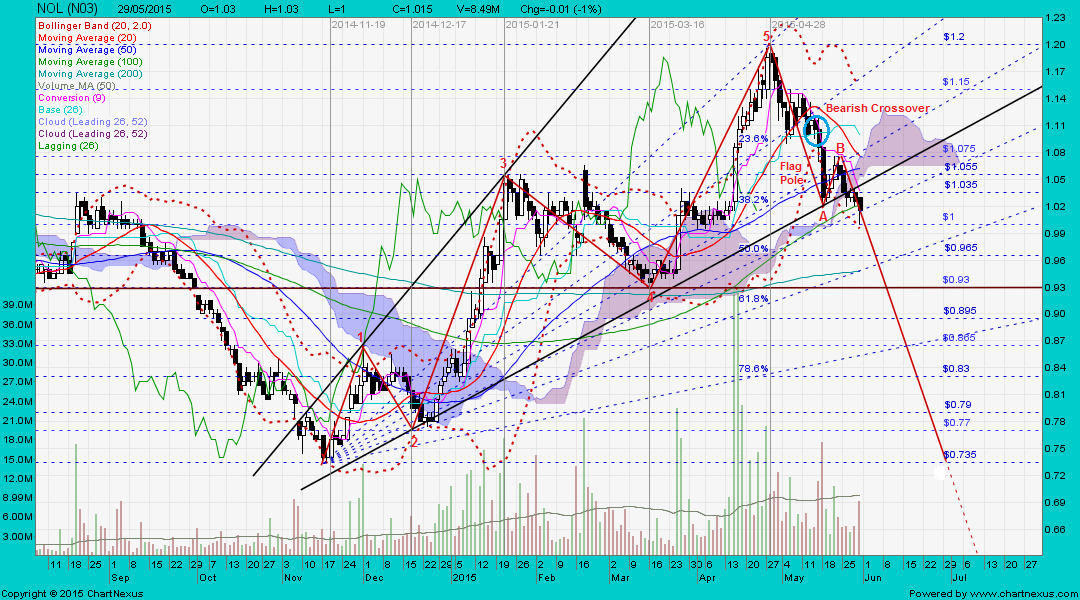
|
|
|
|
Post by zuolun on Jun 13, 2015 9:40:06 GMT 7
Tuan Sing and Rowsley: Chart Pattern ~ Descending Triangle Formation 
|
|
|
|
Post by zuolun on Jun 17, 2015 7:07:54 GMT 7
Sino Grandness and ZELAN: Chart Pattern ~ Bearish Gartley Bat Pattern Breakout 
|
|
|
|
Post by zuolun on Jun 23, 2015 12:12:04 GMT 7
Midas and TigerAir ~ Bearish Gartley Breakout 
|
|
|
|
Post by zuolun on Jun 24, 2015 12:18:29 GMT 7
Sino Grandness and Ezion~ Classic Mushroom-Of-Death chart pattern 
|
|
|
|
Post by zuolun on Aug 11, 2015 9:32:28 GMT 7
Hyflux and TigerAir ~ Chart pattern: Symmetrical triangle, biased to the downside 
|
|
|
|
Post by zuolun on Aug 14, 2015 19:28:55 GMT 7
The significant difference bet. price crashing down on low vol. and price crashing down on high vol.
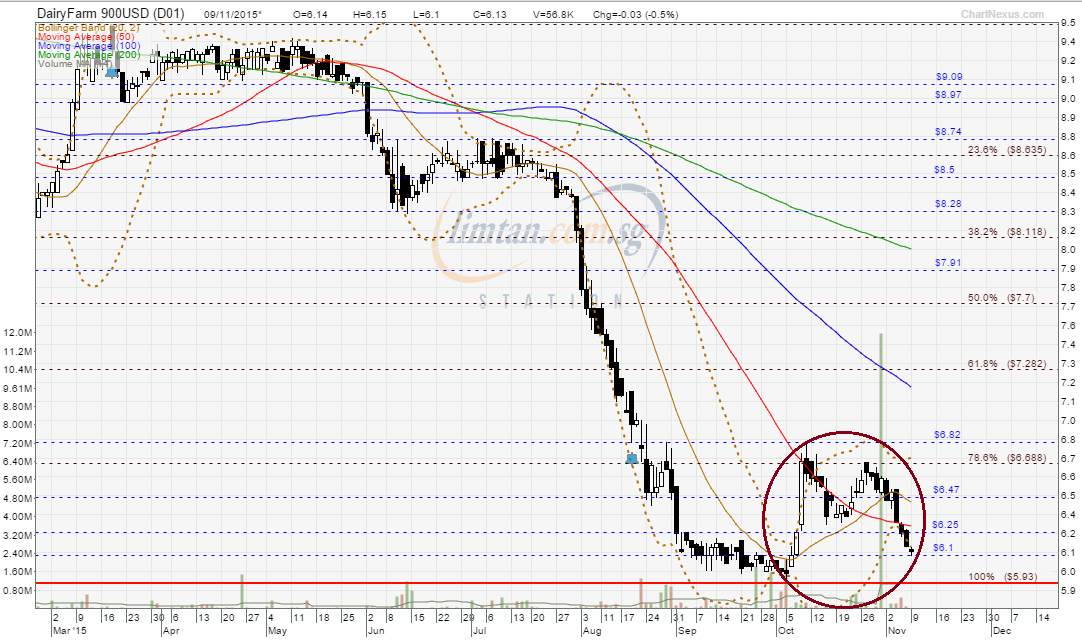
Sometimes, certain things could only be visible on the chart when the share price starts its unusual / volatile movement (up or down all in a row, with or without volume). Bollinger bands are very powerful technical indicator. When using it as a key indicator, volume is not necessarily required, instead, the breakout (upside or downside) at the upper or lower Bollinger band is more important. Likewise, in a downtrend, volume is not required for a downside breakout at support level. However, in an uptrend, volume is necessary for an upside breakout at resistance level. Note: A price drop (or rise) on high volume all in a row is a stronger signal indicating that something in the stock has fundamentally changed. DairyFarm, OSK and COASTAL: Chart pattern ~ Bearish Bollinger Band Breakout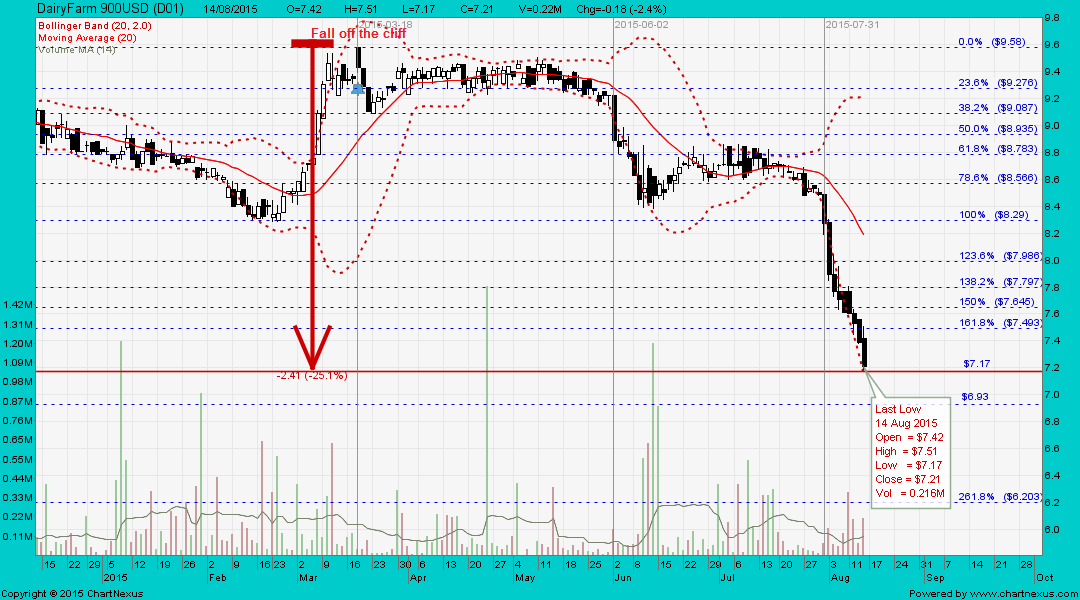 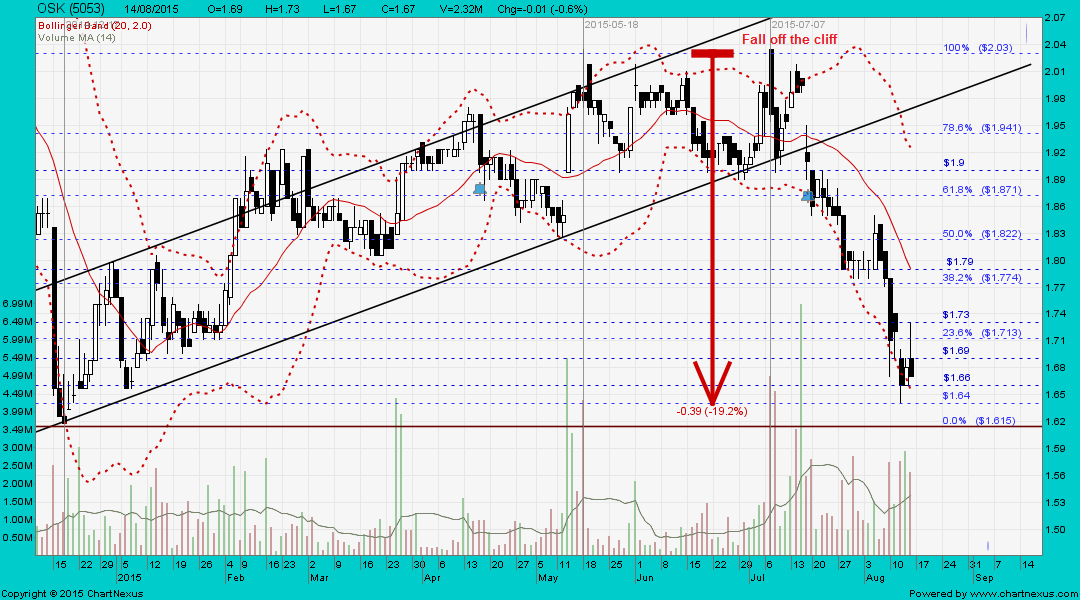 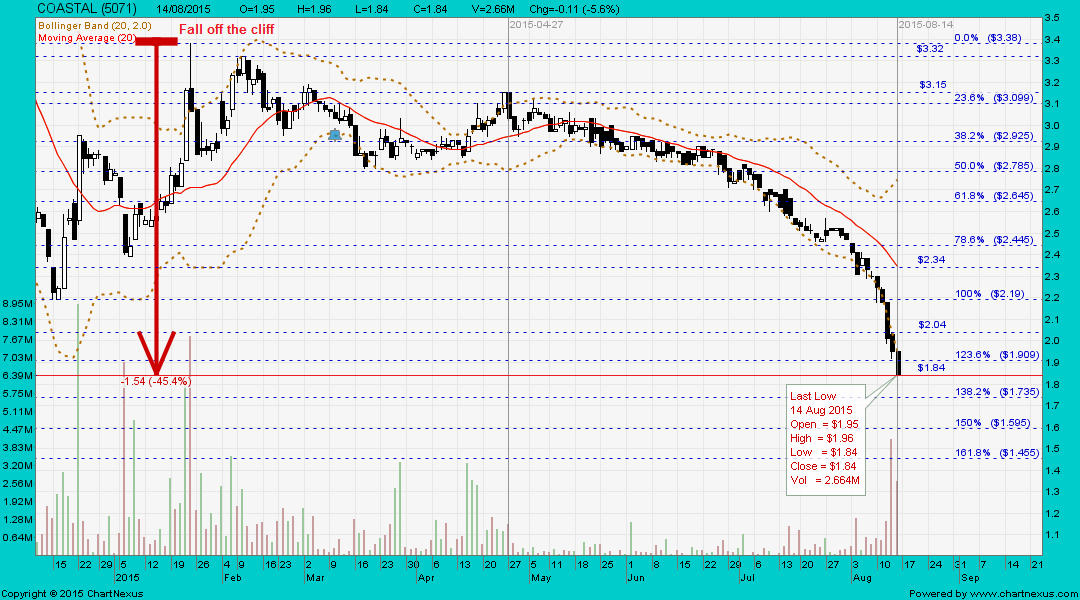
|
|
|
|
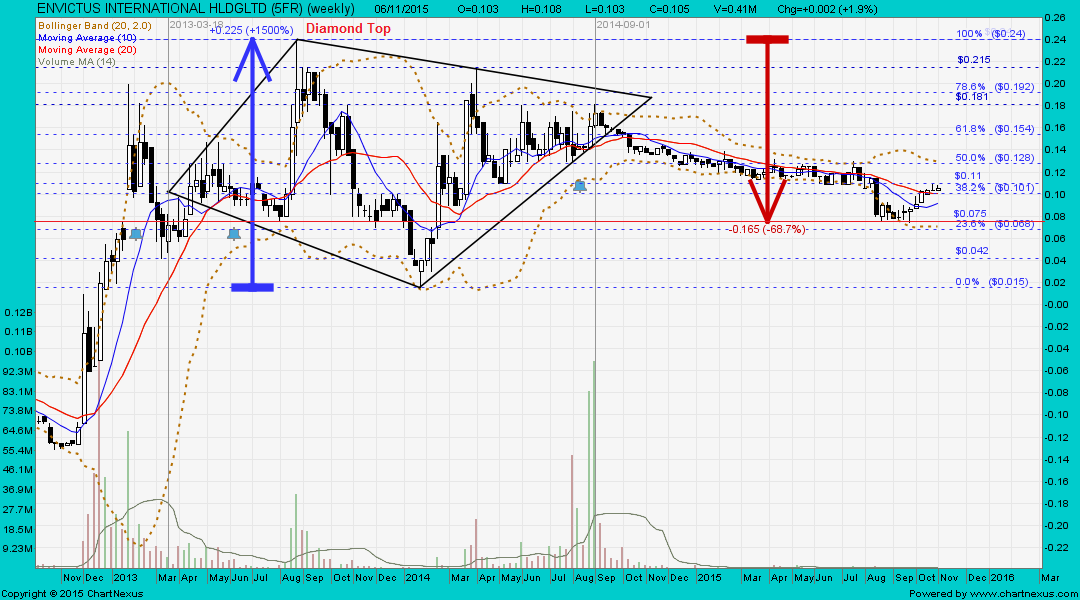
Post by zuolun on Oct 2, 2015 11:46:13 GMT 7
Sarine Tech vs SuperGroup (dated 3 Jan 2014): Chart Pattern — Diamond Top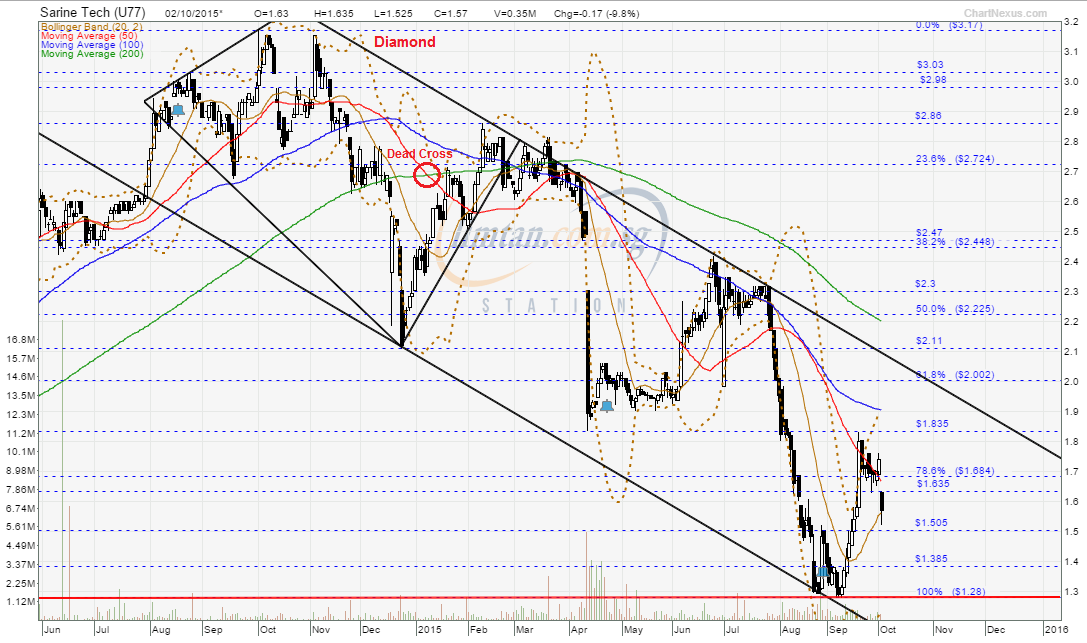 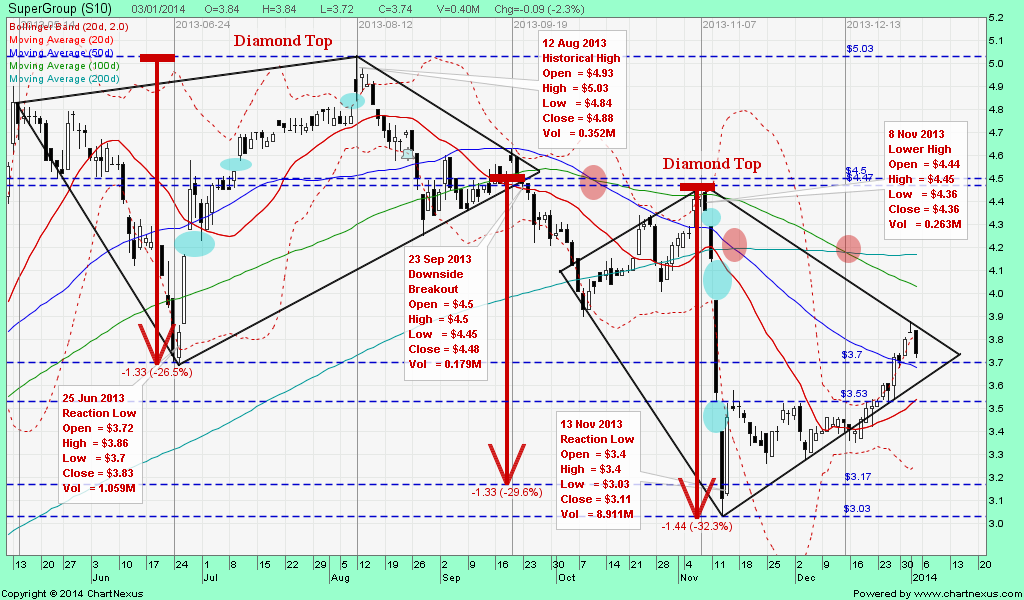
|
|
|
|
Post by zuolun on Nov 3, 2015 6:44:44 GMT 7
 Bearish Gartley formation Bearish Gartley formation1. STI 2. GLP 3. KepCorp 4. HK Land 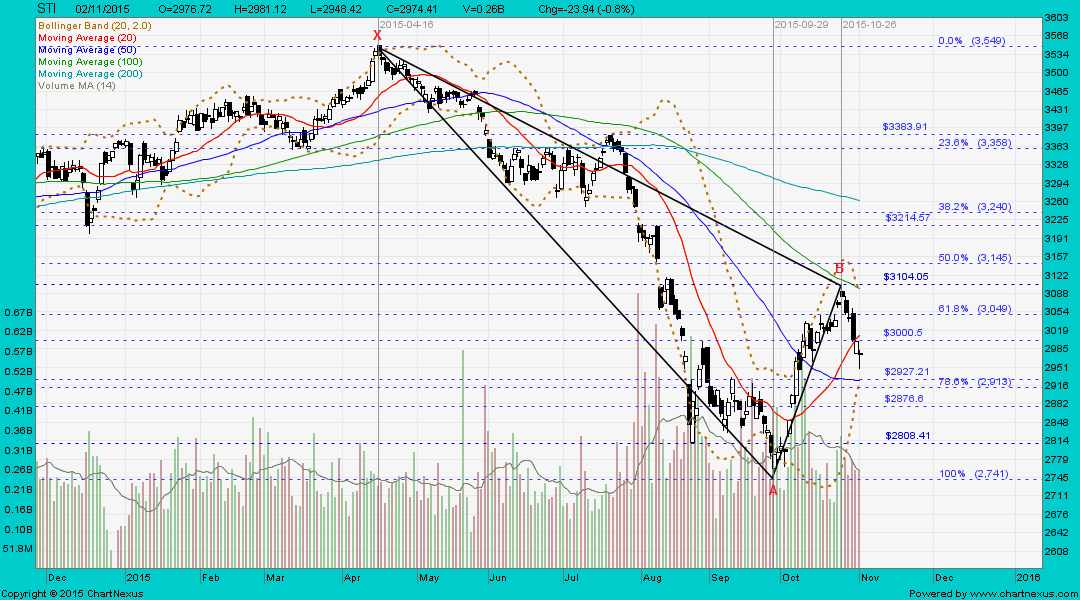 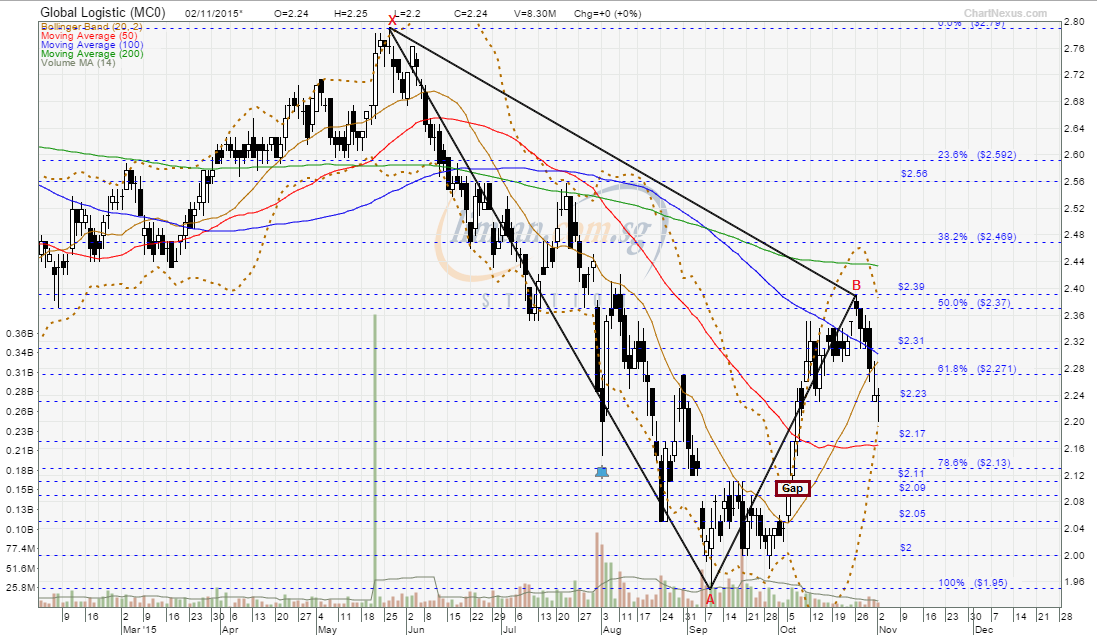 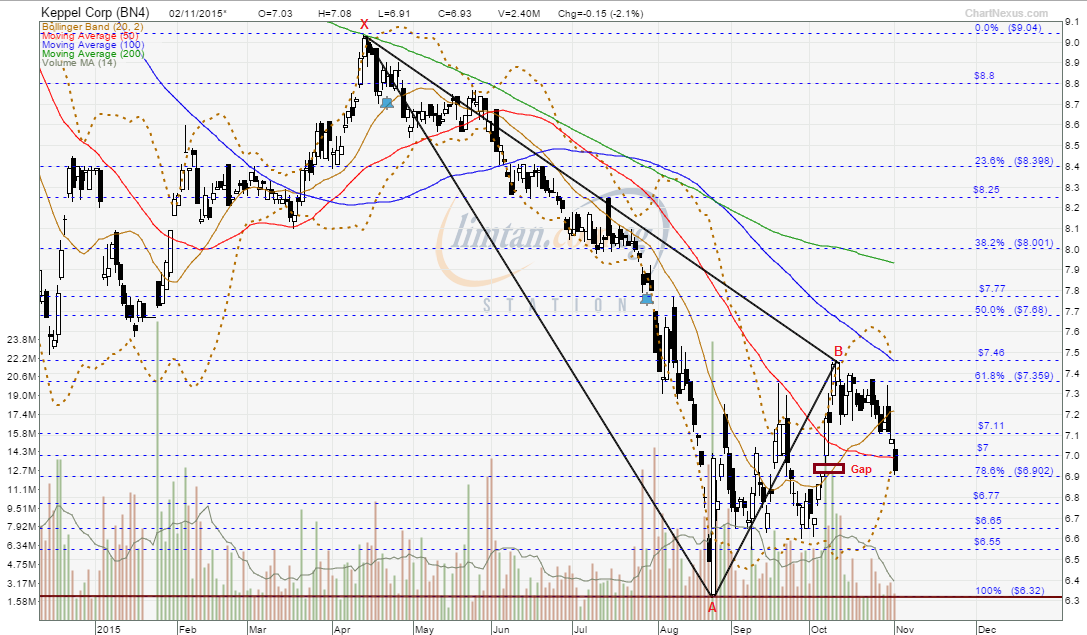 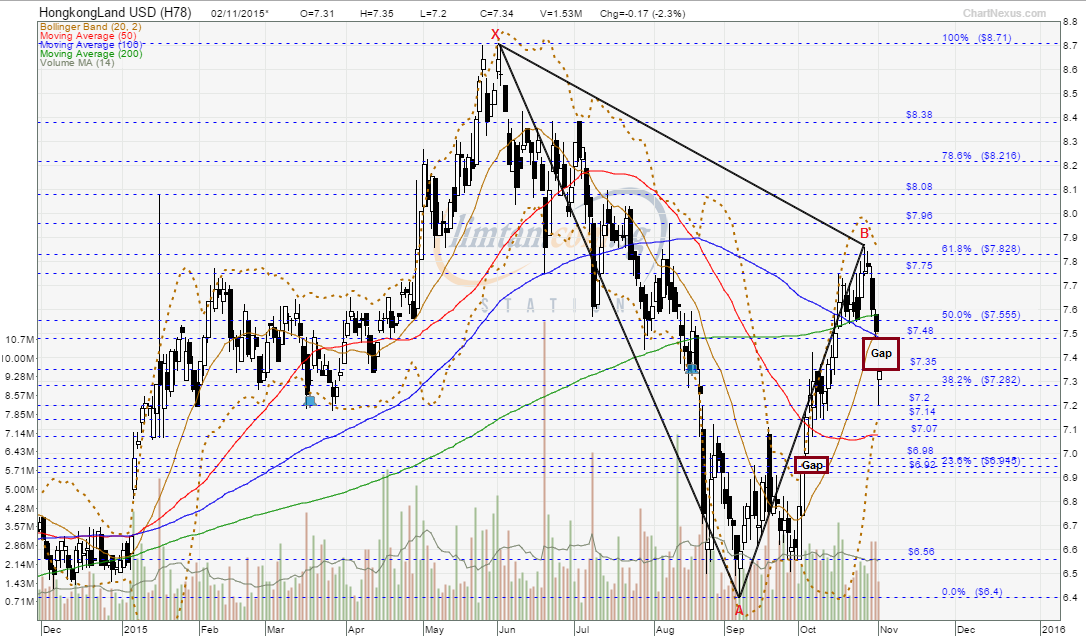 |
|
|
|
Post by zuolun on Nov 9, 2015 6:51:10 GMT 7
|
|
|
|
Post by zuolun on Nov 9, 2015 13:26:35 GMT 7
|
|


 ]
]