|
|
Post by zuolun on Dec 17, 2013 5:52:41 GMT 7
|
|
|
|
Post by zuolun on Dec 18, 2013 13:11:23 GMT 7
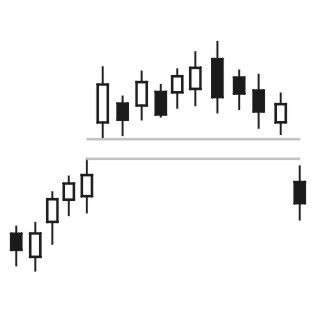
Rounding Top/Rounding Bottom Chart Pattern碗形结构,圆形顶和圆形底的反转形态圆形顶,即碟形顶(saucer top),属于转向形态,显示大跌市即将来临,后市跌势将会很大。
顾名思义,圆形顶的形态特征是倒转半圆形或碟形,成交量在顶部形成后,开始逐步减少。凡确认圆 形顶见顶形态 ,投资者宜尽快沽货离场,以免所持股份变成“蟹货”。
圆形顶的形成,是股价经过一段升势后,升势开始放缓,每次新高位较上一个高位距离不远。由于升 势放缓,部分 先知先觉的投资者便撤退离场,令卖方力量增加。淡友先在圆形顶部与好友势力对抗,其后在好友数 目逐步减少下 ,淡友就得以渐渐控制局面。股价遂持续下滑,直至淡友全面控制局面后,市场需求转为供过于求, 跌势才会较急 。由于形成过程稍长,有时需数月始完成圆形顶。
个别情况下,即使圆形顶形成,股价也不会实时急跌,仅会反复徘徊,横行发展,这徘徊区称为“碟 柄”或“碗柄 ” 。但由于跌势已成,该“碟柄”或“碗柄”一般很快便被突破,股价会转而向下,朝预期中的下跌趋 势而行。
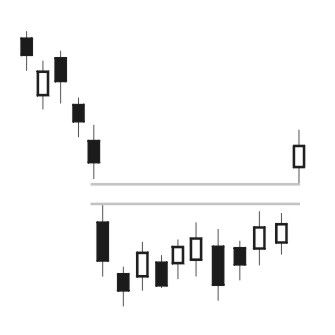
圆形底,又称碟形底(saucer bottom),属于见底形态,显示跌势已逆转,大升市即将来临,后市升势可以很大。其走势及趋向,与圆形 顶刚好相反。
顾名思义,圆形底的形态特征是倒转半圆形或碟形,成交量在底部形成后,开始逐步减少。凡确认圆 形底见底形态 ,投资者宜待圆形底升势转急初期,才追买股票。
圆形底的形成过程如下:当股价经过一段跌势后,跌势开始放缓,沽售(或沽空)股票的成交量开始 减少。每次新 低位较上一个低位距离不远。由于跌势放缓,部分先知先觉者开始趁低吸纳,收集手法普遍是有耐性 地限价收集, 淡友力量因屡攻不下而开始减少,令圆形底部的成交量亦减少。其后好友数目逐步增加,渐控制局面 ,股价才能逐 步上扬。及好友完全控制局面,市场需求转为求过于供,升势方转急。由于形成过程稍久,往往需时 数月始完成圆 形底形态。
个别情况下,即使圆形底形成,股价并不会实时急升,仅会反复横行徘徊,这徘徊区称为“碟柄”或 “碗柄”。但 当升势既成,这“碟柄”或“碗柄”很快会被突破,股价转而向上,朝预期的上升趋势而行。Technical Analysis: Chart PatternsA chart pattern is a distinct formation on a stock chart that creates a trading signal, or a sign of future price movements. Chartists use these patterns to identify current trends and trend reversals and to trigger buy and sell signals. In the first section of this tutorial, we talked about the three assumptions of technical analysis, the third of which was that in technical analysis, history repeats itself. The theory behind chart patters is based on this assumption. The idea is that certain patterns are seen many times, and that these patterns signal a certain high probability move in a stock. Based on the historic trend of a chart pattern setting up a certain price movement, chartists look for these patterns to identify trading opportunities. While there are general ideas and components to every chart pattern, there is no chart pattern that will tell you with 100% certainty where a security is headed. This creates some leeway and debate as to what a good pattern looks like, and is a major reason why charting is often seen as more of an art than a science. There are two types of patterns within this area of technical analysis, reversal and continuation. A reversal pattern signals that a prior trend will reverse upon completion of the pattern. A continuation pattern, on the other hand, signals that a trend will continue once the pattern is complete. These patterns can be found over charts of any timeframe. In this section, we will review some of the more popular chart patterns. Read more...
|
|
|
|
Post by zuolun on Dec 27, 2013 8:34:23 GMT 7
|
|
|
|
Post by zuolun on Dec 27, 2013 16:45:53 GMT 7
|
|
|
|
Post by zuolun on Dec 28, 2013 13:44:27 GMT 7
|
|
|
|
Post by zuolun on Dec 30, 2013 12:50:54 GMT 7
|
|
|
|
Post by zuolun on Jan 1, 2014 9:52:27 GMT 7
Why the 200d SMA is important:
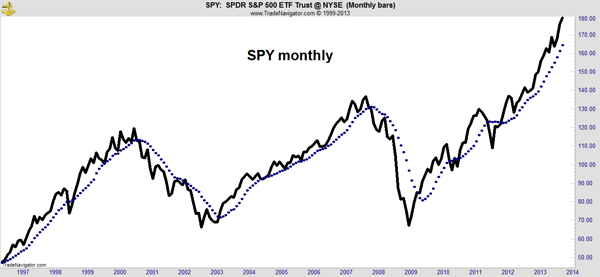
The Simple Moving Average (SMA) is the average price of an asset over a certain period of time. It is calculated by adding up the closing prices over a certain number of time periods, and then dividing by that number of time periods. SMA’s are used to measure momentum. The most watched SMA is the 200 day, it is widely recognized as the dividing line between bull and bear territory. The primary trend is considered to be up as long as the market is trading above its 200-day moving average but this trend turns bearish whenever the market closes below this average.
Oliver Velez: The Mighty 200 MA
|
|
|
|
Post by zuolun on Jan 4, 2014 8:29:48 GMT 7
|
|
|
|
Post by zuolun on Jan 5, 2014 15:37:58 GMT 7
|
|
|
|
Post by zuolun on Jan 9, 2014 11:53:46 GMT 7
Scalping With StochasticsHow to Trade Stochastics Like the Pro's Do
|
|
|
|
Post by zuolun on Jan 13, 2014 15:39:57 GMT 7
|
|
|
|
Post by zuolun on Jan 18, 2014 13:03:26 GMT 7
When using FA and/or TA, bear in mind that the major trend won't change overnight.
Chart-wise when the primary trend is down, a dead cat bounce is an opportunity to sell on strength or short, not long. 1. TechOil&Gas — Trading in a downward sloping channel 2. Mirach Ener — Trading in a rectangle 3. EMS Ener — Bearish symmetrical triangle breakout 4. SMRT — A penny stock in the making; TP S$0.60 5. Dukang — Descending triangle breakout; TP S$0.14 |
|
|
|
Post by stockpicker on Jan 18, 2014 19:46:14 GMT 7
I like this quote; it is the best known and simple quote for those who are playing with technical analysis, especially, Elliot Wave..and the beauty is .. it always work. "The best thing about Elliott wave patterns? Easy: They repeat. They repeat on all timeframes, across dozens of markets, all over the world. Once you know what to look for, you see the familiar 5s and 3s repeat in every chart. You know what that means? That means that the same trade set-ups the markets gave is 2013 are bound to be repeated in 2014" www.elliottwave.com/affiliates/featured-commentary/best-of-2013.aspx?code=84184 |
|
|
|
Post by zuolun on Jan 19, 2014 8:57:08 GMT 7
I like this quote; it is the best known and simple quote for those who are playing with technical analysis, especially, Elliot Wave..and the beauty is .. it always work. "The best thing about Elliott wave patterns? Easy: They repeat. They repeat on all timeframes, across dozens of markets, all over the world. Once you know what to look for, you see the familiar 5s and 3s repeat in every chart. You know what that means? That means that the same trade set-ups the markets gave is 2013 are bound to be repeated in 2014" www.elliottwave.com/affiliates/featured-commentary/best-of-2013.aspx?code=84184"What has been is what will be, and what has been done is what will be done, and there is nothing new under the sun." “已有的事,后必再有。已行的事,后必再行。日光之下并无新事。” |
|
|
|
Post by zuolun on Jan 24, 2014 6:09:14 GMT 7
|
|