|
|
Post by zuolun on Dec 18, 2013 19:56:22 GMT 7
|
|
|
|
Post by stockpicker on Dec 19, 2013 11:00:57 GMT 7
A chart to share on STI. This chart did not show STI in a good position, not until it has break up from the neckline or the trendline.. from the lower high lower low cluster, it would appear STI will want to test the 2950. If that does not hold up, it will aim for 2550 which is the target for breaking the neckline.. the breaking of neckline has not been confirmed because there was no volume at the time of the break and STI is presently testing it.
The US tapering did not dent but raise the market price because investors was happy with the certainty that interest rate will remain low for year 2014. However, the Asian markets were not too hopeful.. as if the QEs is better than low interest rate to stimulate the Asian economy. This is somewhat in line with what the charts are telling us at the moment..

|
|
|
|
Post by zuolun on Dec 19, 2013 13:49:01 GMT 7
I believe the STI had peaked at 3464 points on 22 May 2013 (in term of USD the STI hit above 4100 points on that day). The sell-off with extremely high volume done on the next day on 23 May 2013 was later confirmed by the dead cross (ref. the 5-year chart Feb 2008 to Aug 2013). The Bradley Turn Dates for 2014 shows a bullish 1H2014 could be the sub-wave-ii of Wave-C up to be followed by the sub-wave-iii of Wave-C down, a steep correction starting from 16 July 2014. 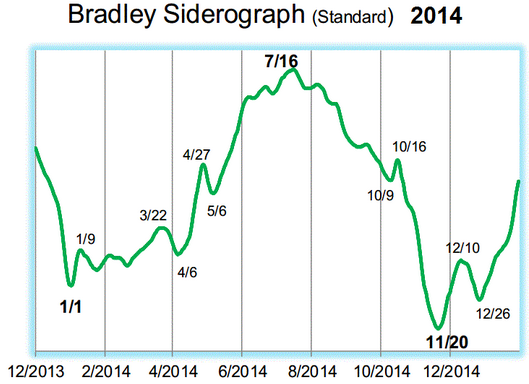 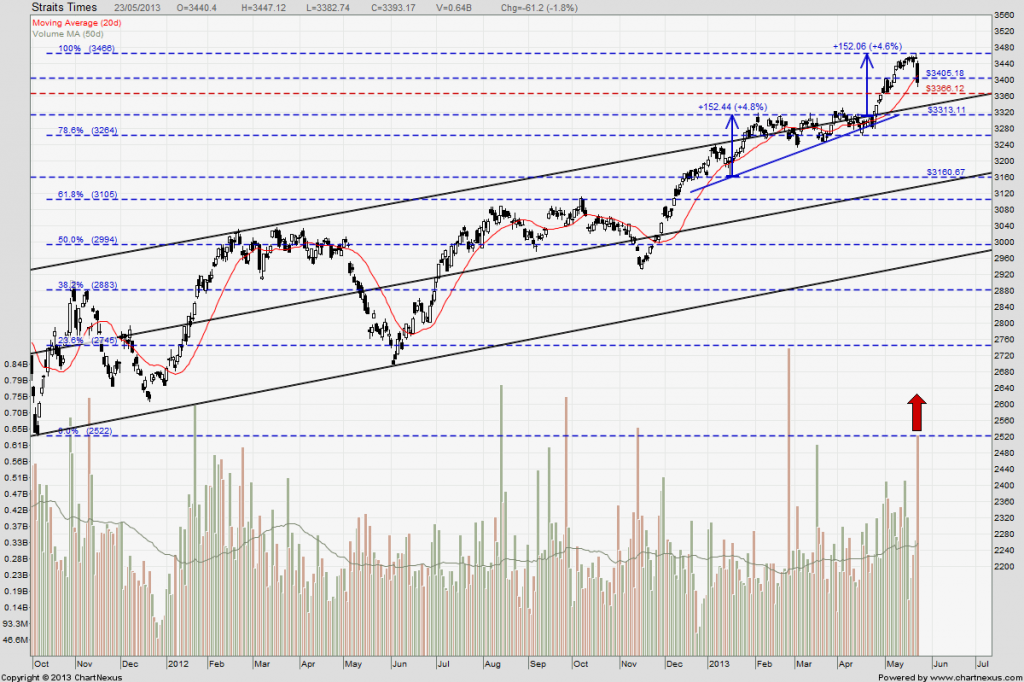  |
|
|
|
Post by oldman on Dec 19, 2013 14:03:02 GMT 7
Zuolun, your TA very chim lah.  |
|
|
|
Post by zuolun on Dec 19, 2013 14:38:10 GMT 7
Zuolun, your TA very chim lah. oldman, should the STI break below 2775, it means GAME OVER...put in more coins to continue the game.  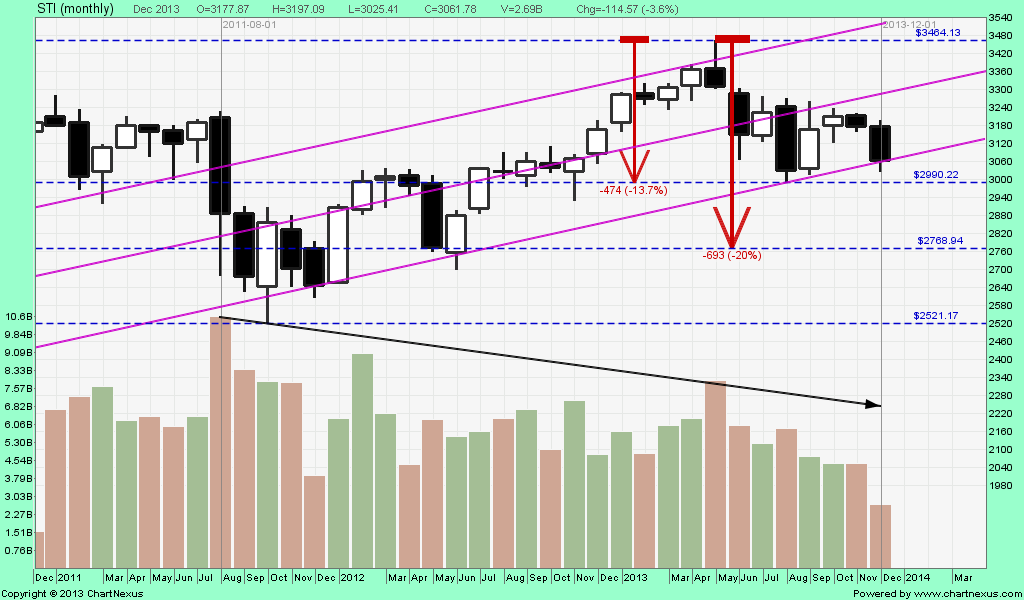 Extremely strong downtrend stocks:
1. HKland and Hi-P2. Jardine C&C3. OLAM4. SMRT5. SuntecReitWhen a stock retraces 20% from record high and continues to trade below the 4MAs with the 3 dead crosses hanging above the prevailing share price, it is in an extremely strong bear-market territory. Three (3) key criterions to confirm before riding the downside wave with confidence:1. Firstly, one will need to see the 10d SMA ticking downwards, coupled with three long black candles on the daily chart. 2. Then, this needs to be decked with two black candles on the weekly chart. 3. Finally, the monthly chart will need to have a long black candle that shows a loss of more than 12%. How to use the 3 dead crosses as a guide to short:
1. When the 1st deadly dead cross (50d SMA crosses below 100d SMA) appears, wait for the price to bounce up (the higher the better) then short. 2. When the 2nd dead cross (50d SMA crosses below 200d SMA) appears, wait for the price to bounce up (the higher the better) then short. 3. When the 3rd dead cross (100d SMA crosses below 200d SMA) appears, wait for the price to bounce up (the higher the better) then short. 4. After all the three (3) dead crosses have appeared; every dead cat bounce (the higher the better), short. 5. Repeat the same process over and over again as long as the strong downtrend prevails. Using the price and the volume as a trend indicator:
1. High volume is bearish when the stock is in distributing mode. 2. High volume is bullish when the stock is in accumulating mode. 3. Do not catch a stock falling on high volume or one that is rising on thin volume. |
|
|
|
Post by odie on Dec 19, 2013 16:17:41 GMT 7
fear and greed index now 46, neutral
|
|
|
|
Post by stockpicker on Dec 23, 2013 4:50:11 GMT 7
STI choked up gains, following US market rather than Hang Seng or Shanghai in the last few sessions. Whether it can improve further will depend on it can defeat the lower low and lower high cluster created recently. So far, STI has ignored the trend line or neckline without significant volume transaction when breaking up or down.. it remains a minor trendline or neckline until we see larger volume.. STI is still very weak with a possible sideway movement before a move.. The charts showed improvements in Stochastic as well as in Williams, indicating that STI will want to move higher; however, MACD is still hesitating for some reasons.. may be it is waiting for Hang Seng and Shanghai to improve their positions..  |
|
|
|
Post by zuolun on Dec 29, 2013 21:08:08 GMT 7
STI — Descending triangle formation; crucial support at 3006 points 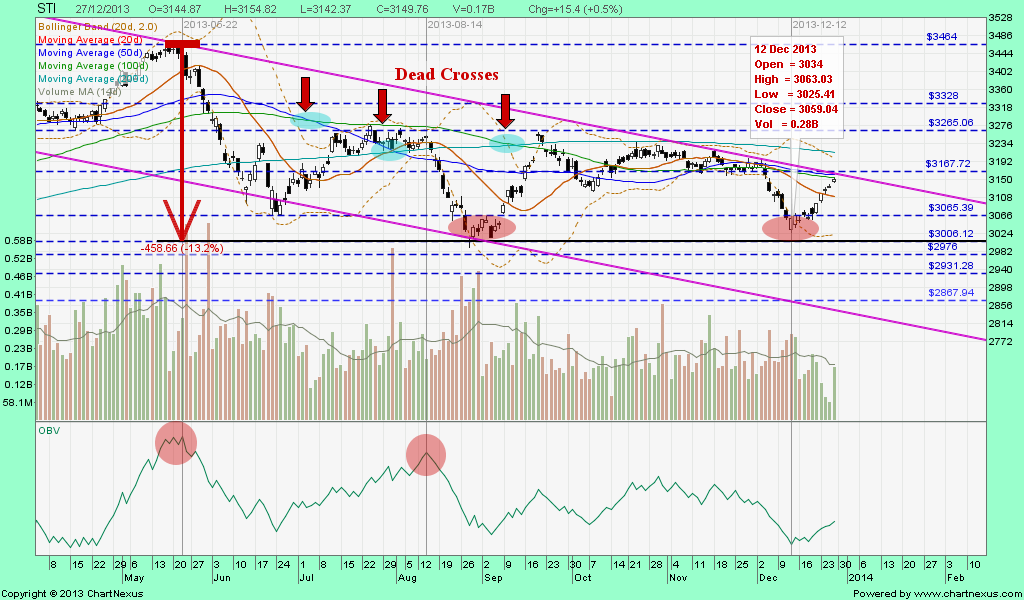
|
|
|
|
Post by zuolun on Jan 2, 2014 6:15:07 GMT 7
Chart is similar to a compass if one knows how to use it correctly
When the stock markets of other Asian markets plunged big time in end-May to end-Jun 2013, they reflected the mass capitulation by Foreign Funds. As the S$/US$ has appreciated by 15% since 2009 and S'pore had underperformed other ASEAN countries in term of % GDP growth 2012, Foreign Funds were mostly absent at end-Dec 2012. So the impact of capitulation by Foreign Funds on the STI was not great as compared to other Asian markets. Thus, the tight trading range bet. 3167 - 3328 points in the 1H2013 suggested that the STI has been supported mainly by local Fund managers since the beginning of 2013. These local Fund managers only support the 2 major pillars of the S'pore economy; the properties and bank stocks. But properties and bank stocks are sensitive to sharp interest rates spikes which will negatively affect their qtrly earnings — that's a fundamental and inverse change. So if you're the local Fund managers with portfolios heavy on S'pore properties and bank stocks, would you consider increasing or paring down the 2 main categories of stocks at current prices which had corrected at the most 10%? Southeast Asia Bears Brunt of Market Chaos — 20 Jun 2013 odie, The STI is up 20+ points now but trading volume is rather low. Fund managers could have initiated "window-dressing" earlier than the usual end-of-the-month/year in Dec 2013. It would be a blessing if STI could end the year of 2013 at 3167 points... "A lost decade for Japan" Vs "A lost year for STI".  — STI on 31 Dec 2013 at 3,167 points 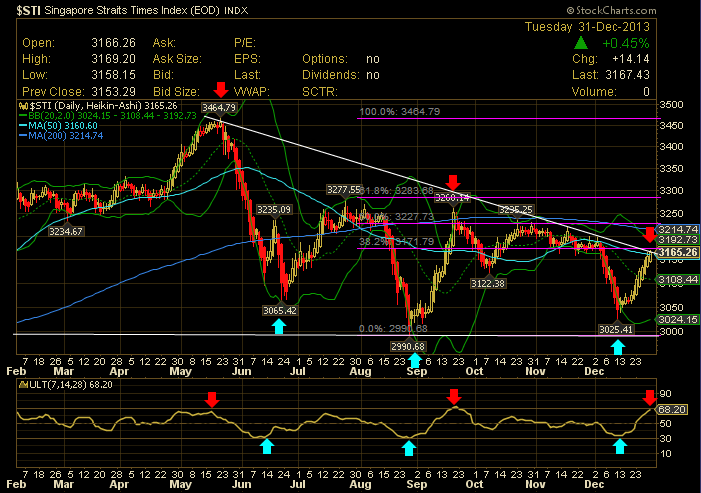 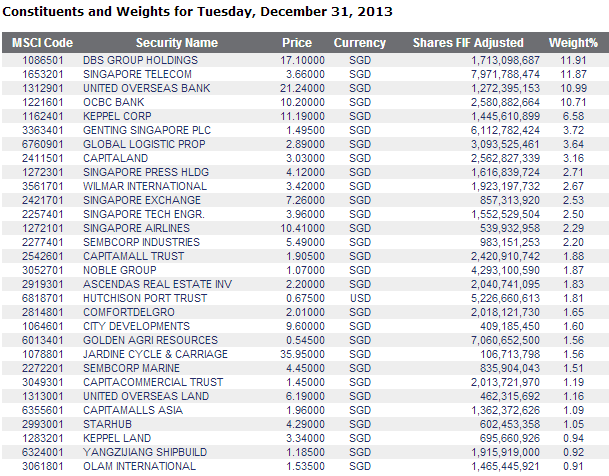 
|
|
|
|
Post by zuolun on Jan 2, 2014 11:55:41 GMT 7
STI — Expect a repeat chart pattern of 19 Sep 2013STI @ 3172.26 (+4.83, +0.2%) with extremely low volume on 2 Jan 2014 at 12.52 noon. 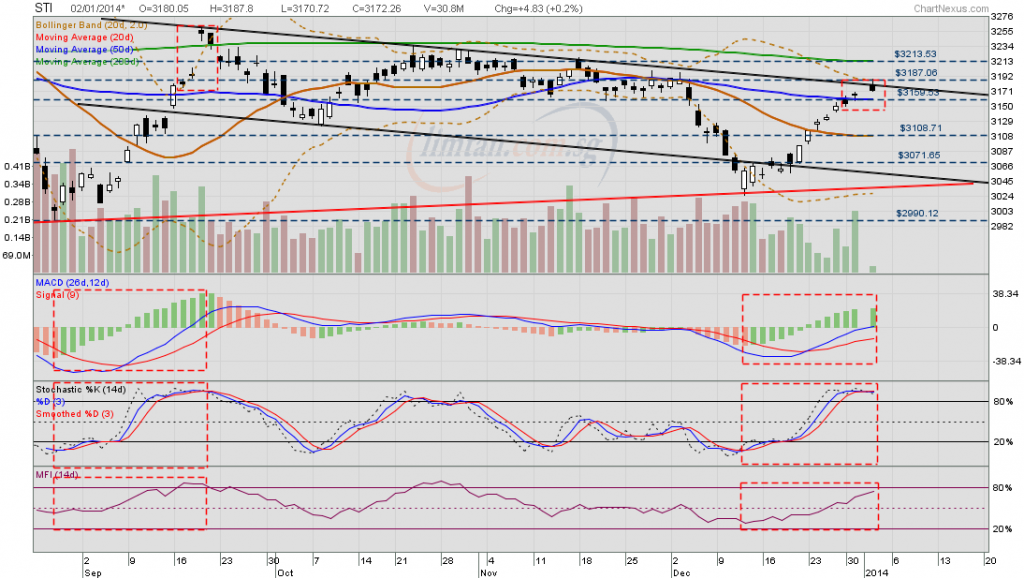
|
|
|
|
Post by odie on Jan 2, 2014 22:37:18 GMT 7
thanks zuolun bro for chart update
will eat durians if possible
|
|
|
|
Post by zuolun on Jan 3, 2014 13:05:04 GMT 7
STI — Expect a repeat chart pattern of 19 Sep 2013STI @ 3146.71 (-27.94, -0.9%) with extremely low volume done at 51.1m shares on 3 Jan 2014 at 2pm. 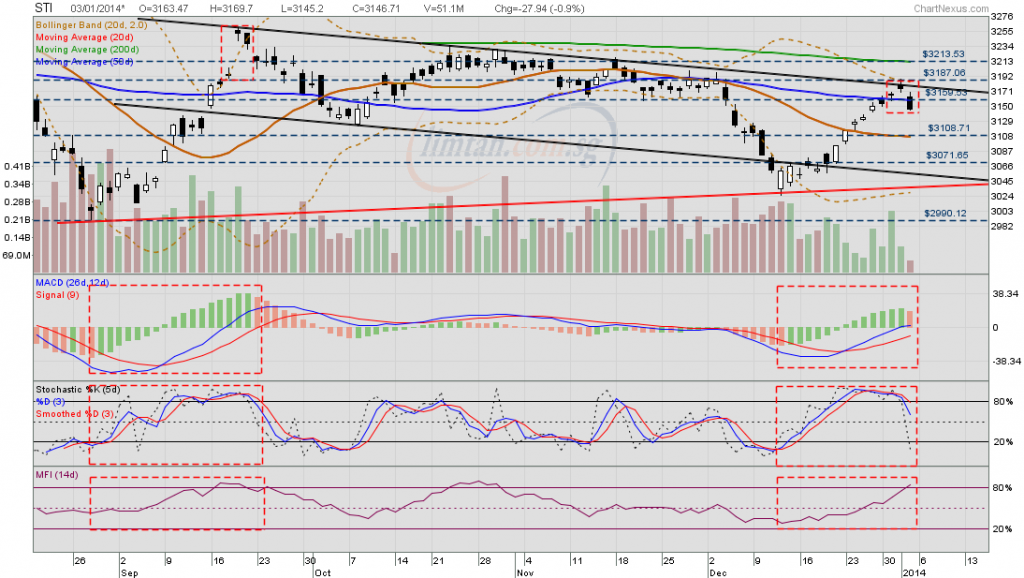
|
|
|
|
Post by zuolun on Jan 4, 2014 4:34:32 GMT 7
"Let our advance worrying become advance thinking and planning." - Winston Churchill Fund managers of Schroders Plc and Baring Asset Management: Avoid Singapore equities and properties — 25 Dec 2013 If you have invested in any of the 30 companies that make up the Straits Times Index (SGX: ^STI) – some of the largest publicly-listed companies in Singapore – there should be numerous research reports on them by the brokerage houses. Now, have you ever realised that you might tend to put more weight on reports that agree with your views and brush off reports that are not? This is an example of a confirmation bias, where we tend to seek out information that agrees with our preconceived notions of how things should be. A good way to fight this bias is to really understand the risks behind each of your investment. Read more...
|
|
|
|
Post by zuolun on Jan 4, 2014 9:05:15 GMT 7
|
|
|
|
Post by zuolun on Jan 9, 2014 10:45:37 GMT 7
|
|