|
|
Post by me200 on Mar 27, 2014 20:58:05 GMT 7
STI ETF pays ~3% dividend. It has been a long long time since I played ETFs. But I do recall that sometimes they include dividends. As always, I stand corrected. |
|
|
|
Post by zuolun on Mar 28, 2014 10:58:34 GMT 7
It has been a long long time since I played ETFs. But I do recall that sometimes they include dividends. As always, I stand corrected. The OBV indicator and the trading volumes on the STI ETF chart on 27 Mar 2014 showed that the 1st qtr window-dressing had caused a severe short squeeze. Based on the price action and volume analysis, the unusual huge buy-ups yesterday 27 Mar 2014 was due to short-covering for trades done on 14 Mar 2014. There're funny BBs doing delta hedging on the Straits Times Index stocks via STI ETF instead of SiMISC.  STI ETF — Bullish bollinger breakout, strong resistance @ 3.22, the 50% FIBO retracement STI ETF — Bullish bollinger breakout, strong resistance @ 3.22, the 50% FIBO retracement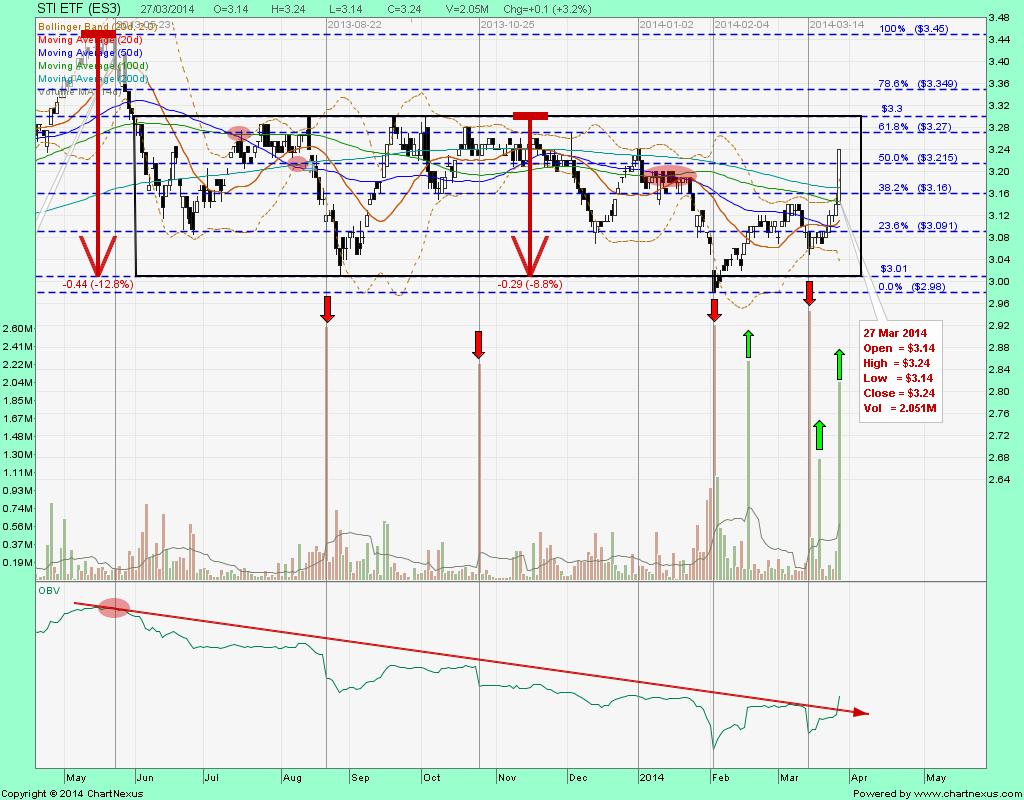 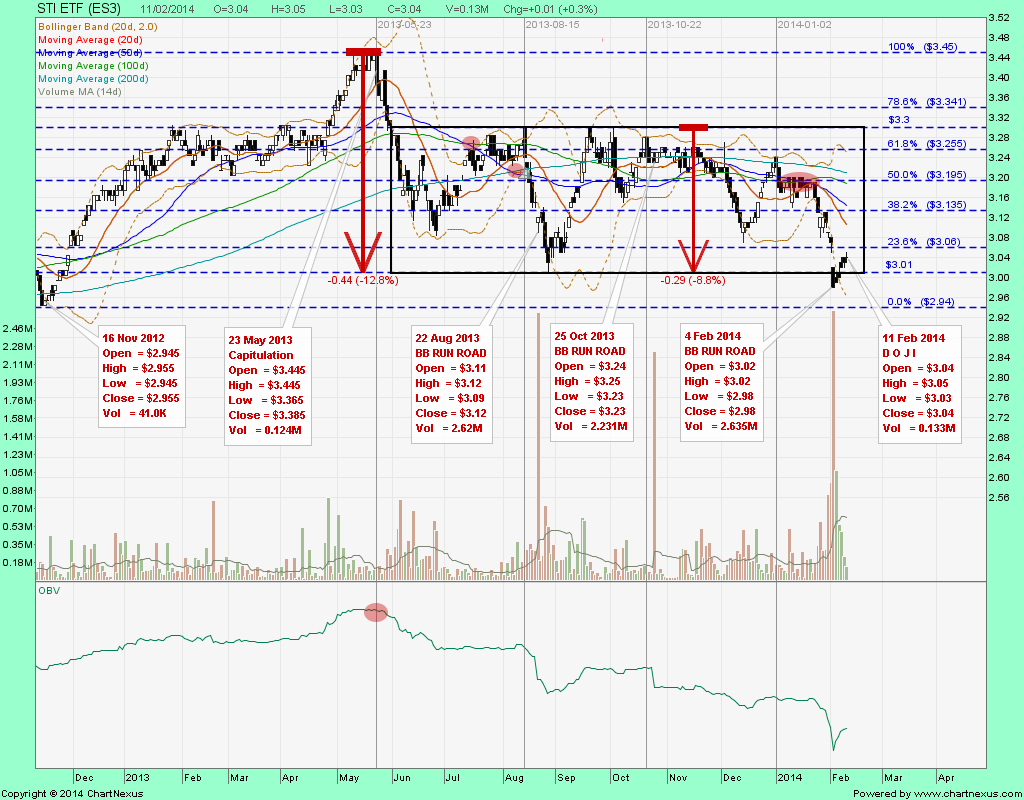
Just observation ...
The STI market close at 3162.50 today but the STI ETF close much higher at $3.24.
This is a wide spread and the $3.24 was done at pre-close with 281 lots.
Is the BB buying ahead as they anticipate STI moving to 3250 range?

|
|
|
|
Post by zuolun on Mar 28, 2014 17:20:35 GMT 7
Just observation ...
The STI market close at 3162.50 today but the STI ETF close much higher at $3.24.
This is a wide spread and the $3.24 was done at pre-close with 281 lots.
Is the BB buying ahead as they anticipate STI moving to 3250 range?
The OBV indicator and the trading volumes on the STI ETF chart on 27 Mar 2014 showed that the 1st qtr window-dressing had caused a severe short squeeze. Based on the price action and volume analysis, the unusual huge buy-ups yesterday 27 Mar 2014 was due to short-covering for trades done on 14 Mar 2014. There're funny BBs doing delta hedging on the Straits Times Index stocks via STI ETF instead of SiMISC. If the same group of BBs who had shorted the STI ETF earlier and covered (at pre-closing yesterday 27 Mar 2014) reverse to long and support-buy with high volume next week (after window-dressing), it would be bullish for the stock. Alternatively, if the BBs stay sideline and do nothing, the share price will come down hard when more retail players rush in to lock whatever profits left (especially when the resistance-turned-support at 3.14 is broken convincingly).  STI ETF — Bullish bollinger breakout, strong resistance @ 3.22, the 50% FIBO retracement STI ETF — Bullish bollinger breakout, strong resistance @ 3.22, the 50% FIBO retracementThe STI ETF closed with a bullish harami @ 3.18 (-0.06, -1.9%) with extremely thin volume done at 101 lots on 28 Mar 2014. 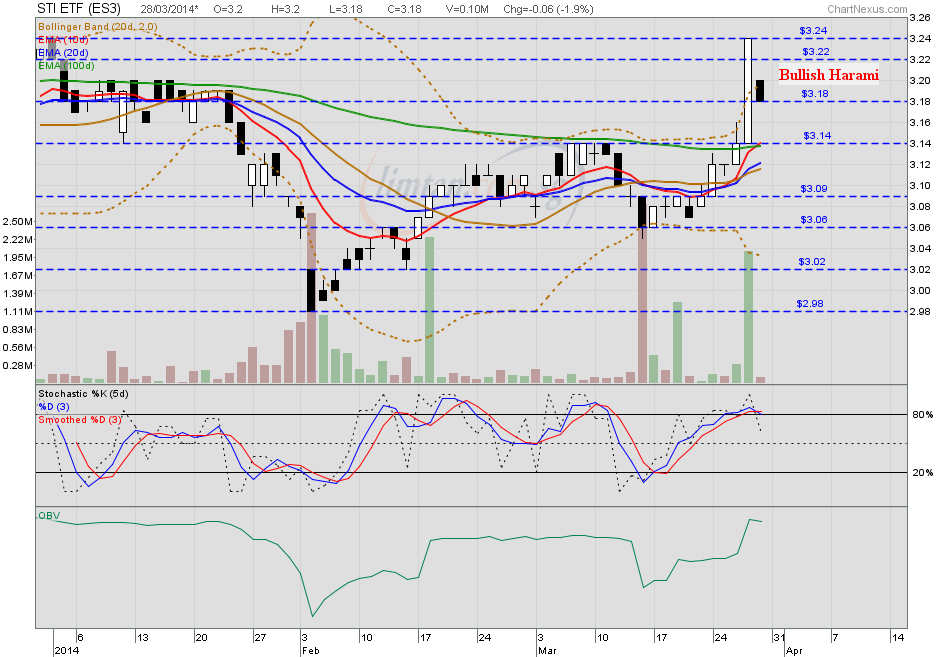 |
|
|
|
Post by odie on Mar 30, 2014 9:11:34 GMT 7
sti seems unlikely to break thru 3120
|
|
|
|
Post by zuolun on Apr 1, 2014 18:11:25 GMT 7
sti seems unlikely to break thru 3120 odie, STI — Trading in a rectangle, short-term reversalSTI closed with a doji @ 3188.62 (+9.9, + 0.3%) on 1 Apr 2014. Immediate resistance @ 3208, strong resistance @ 3268, immediate support @ 3073, the 23.6% FIBO retracement. 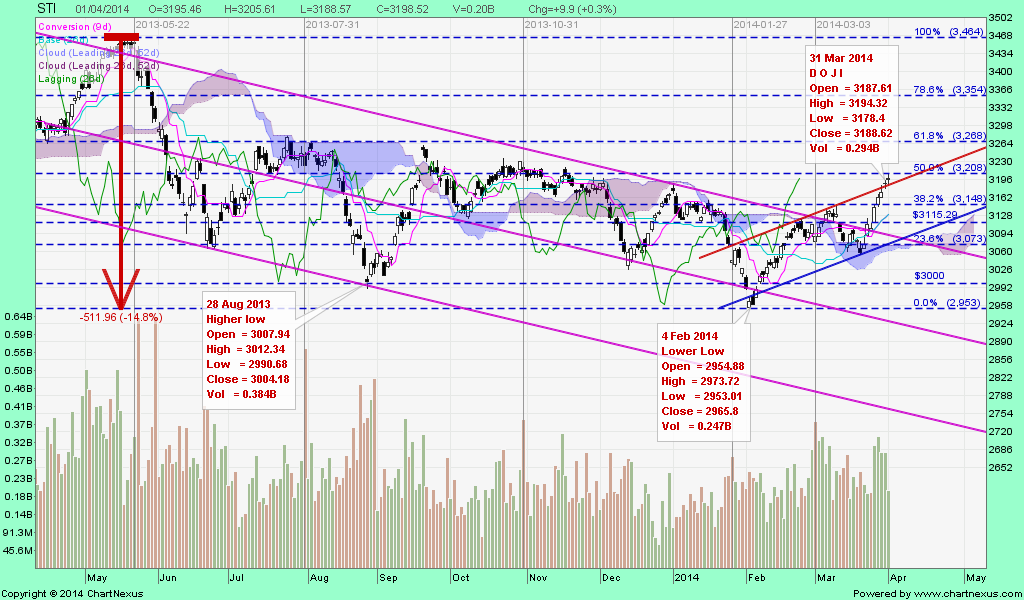 STI (weekly) — The Elliott Wave pattern STI (weekly) — The Elliott Wave pattern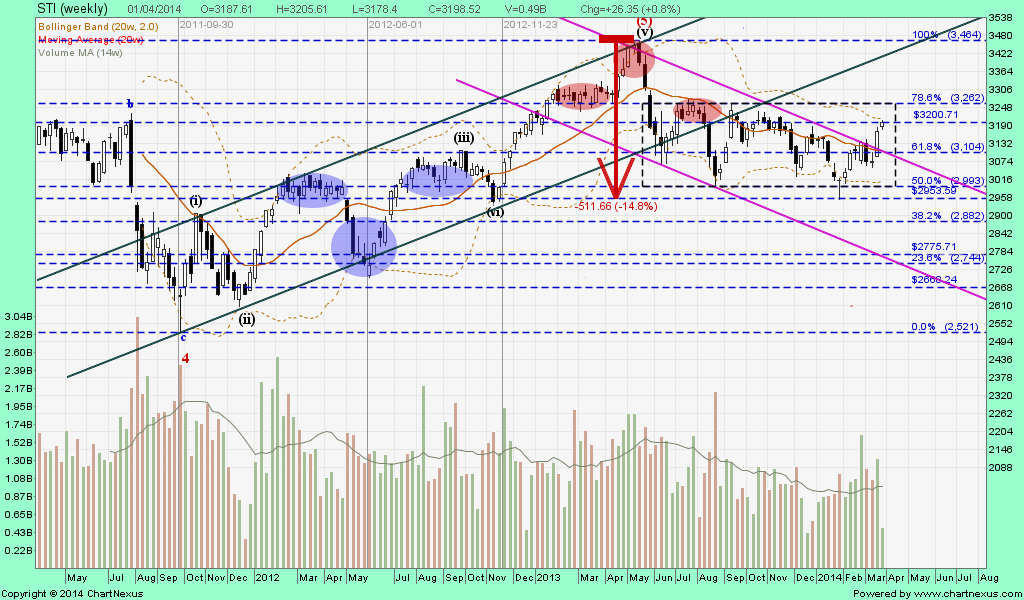 |
|
|
|
Post by zuolun on Apr 6, 2014 22:48:01 GMT 7
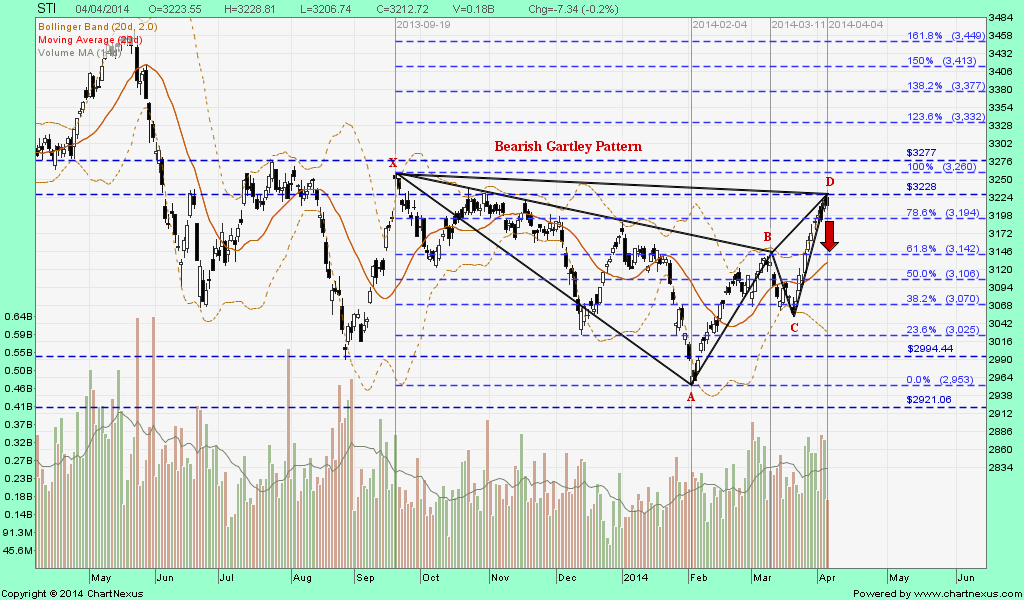
Somewhere In TimeSTI — Bearish Gartley pattern, potential bearish trend reversalThe STI closed with a dark cloud cover @ 3212.72 (-7.34, -0.2%) on 4 Apr 2014. Immediate support @ 3194, strong resistance @ 3268. Should the bearish gartley pattern materialize, expect the STI to back down to retest the last low at 2953 scored on 4 Feb 2014. - Chart patterns can be found over charts of any timeframe.
- Most of the patterns need a confirmation, an unconfirmed pattern has no further meaning.
- A confirmation must appear one up to three candles after the pattern.
- This confirmation is a big black marubozu with a decisive down-move, breaking a crucial support (high volume is not necessary).
 STI — Bearish Gartley pattern as at 21 Feb 2012 STI — Bearish Gartley pattern as at 21 Feb 2012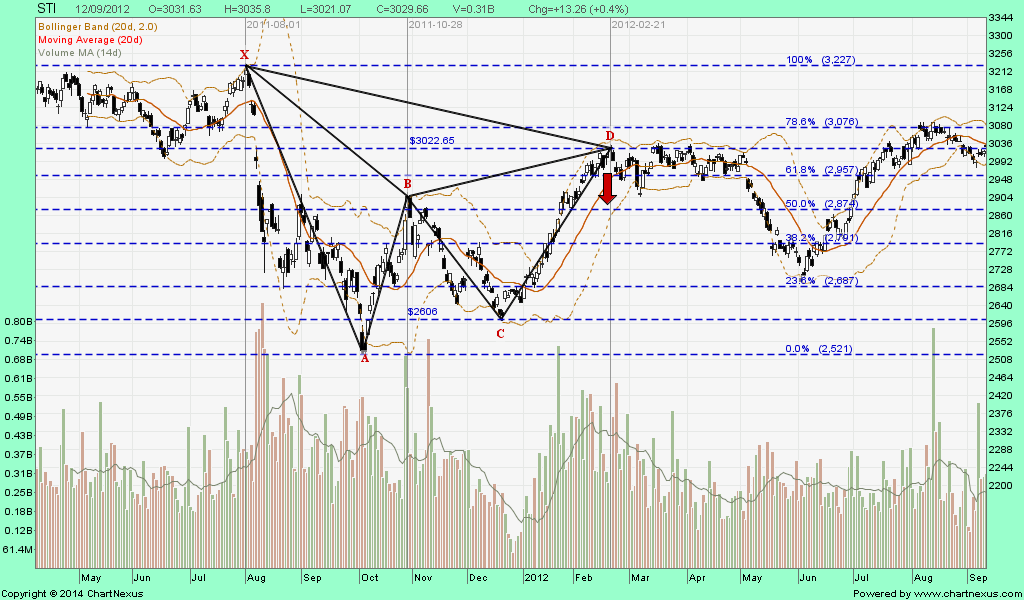
|
|
|
|
Post by zuolun on Apr 7, 2014 21:29:32 GMT 7
STI — Bearish Gartley pattern, potential bearish trend reversalThe STI closed with a dark cloud cover @ 3212.72 (-7.34, -0.2%) on 4 Apr 2014. Immediate support @ 3194, strong resistance @ 3268. Should the bearish gartley pattern materialize, expect the STI to back down to retest the last low at 2953 scored on 4 Feb 2014. - Chart patterns can be found over charts of any timeframe.
- Most of the patterns need a confirmation, an unconfirmed pattern has no further meaning.
- A confirmation must appear one up to three candles after the pattern.
- This confirmation is a big black marubozu with a decisive down-move, breaking a crucial support (high volume is not necessary).
STI — Bearish Gartley breakout, interim TP 2953, next TP 2921The STI closed with a spinning top @ 3193.59 (-19.13, -0.6%) on 7 Apr 2014. Immediate support @ 3188, immediate resistance @ 3228. 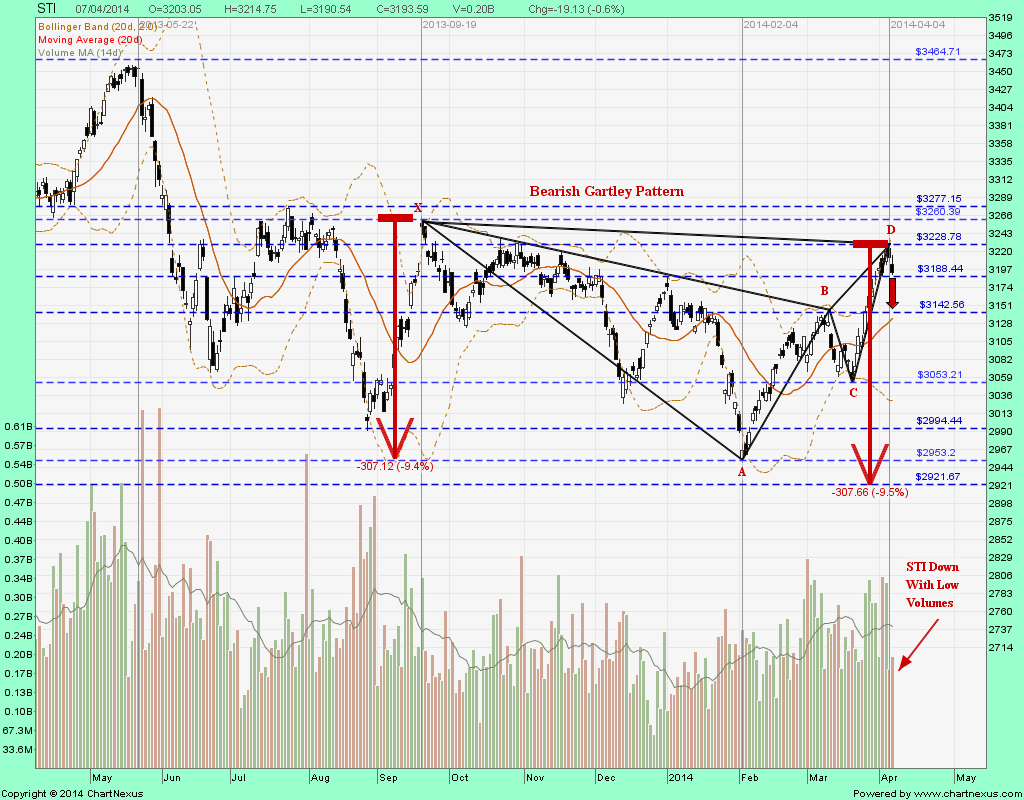 |
|
|
|
Post by zuolun on Apr 10, 2014 1:15:00 GMT 7
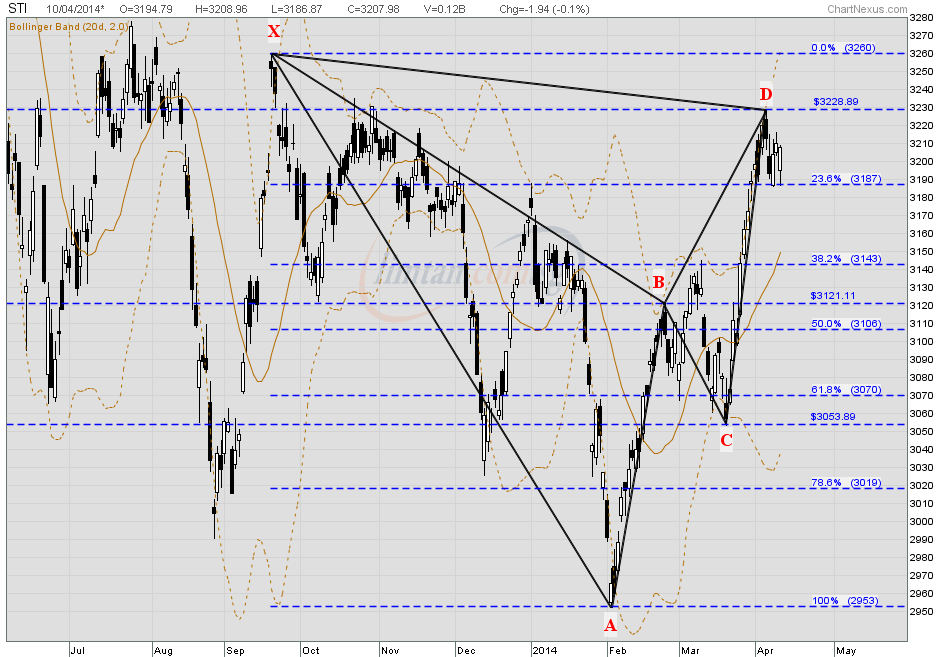
Testing...it is easier to draw the bearish Gartley pattern with this software. 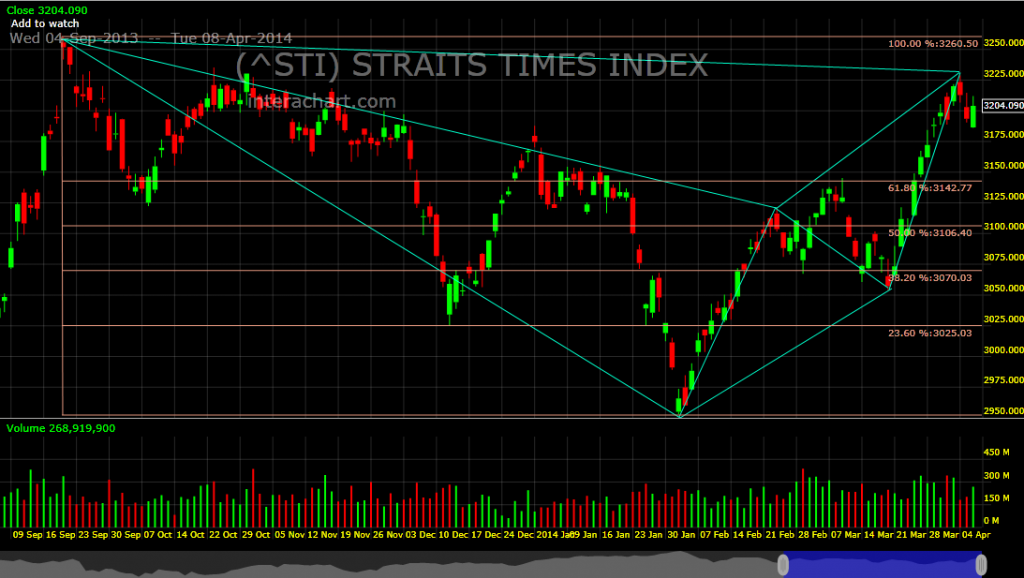 STI — Bearish Gartley Pattern STI — Bearish Gartley PatternThe STI closed with a spinning top @ 3209.92 (+5.83, +0.2%) on 9 Apr 2014. Immediate support @ 3188, immediate resistance @ 3228. The STI's bearish Gartley pattern still has no confirmation yet. 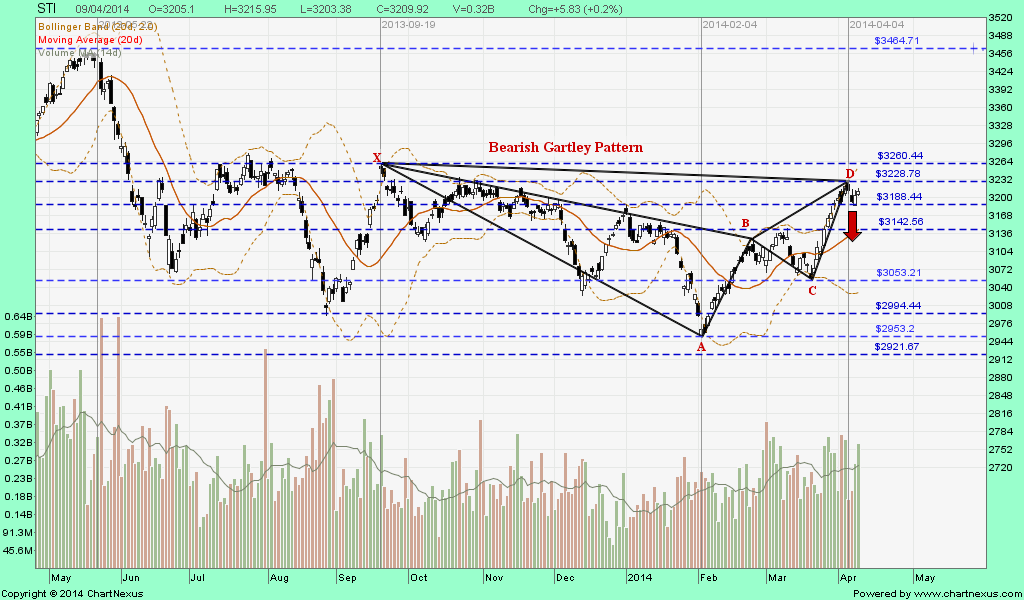 |
|
|
|
Post by zuolun on Apr 10, 2014 15:07:21 GMT 7
The STI is likely to trade tightly bet. 3188 to 3228 (Bollinger Band Squeeze), similar to the sideway trading pattern on Feb 2012, prior to a decisive down-move confirmation. The bearish Gartley pattern will be negated if the STI shoots above 3228 convincingly. STI — Bearish Gartley pattern on 10 Apr 2014 at 4pm
 STI — Bearish Gartley pattern as at 21 Feb 2012 STI — Bearish Gartley pattern as at 21 Feb 2012 |
|
|
|
Post by zuolun on Apr 11, 2014 23:12:15 GMT 7
STI — Bearish Gartley pattern, potential bearish trend reversalSTI closed with a spinning top @ 3198.22 (-5.36, -0.2%) on 11 Apr 2014. Immediate support @ 3188, immediate resistance @ 3228. Should the bearish gartley pattern materialize, expect the STI to back down to retest the last low at 2953 scored on 4 Feb 2014. 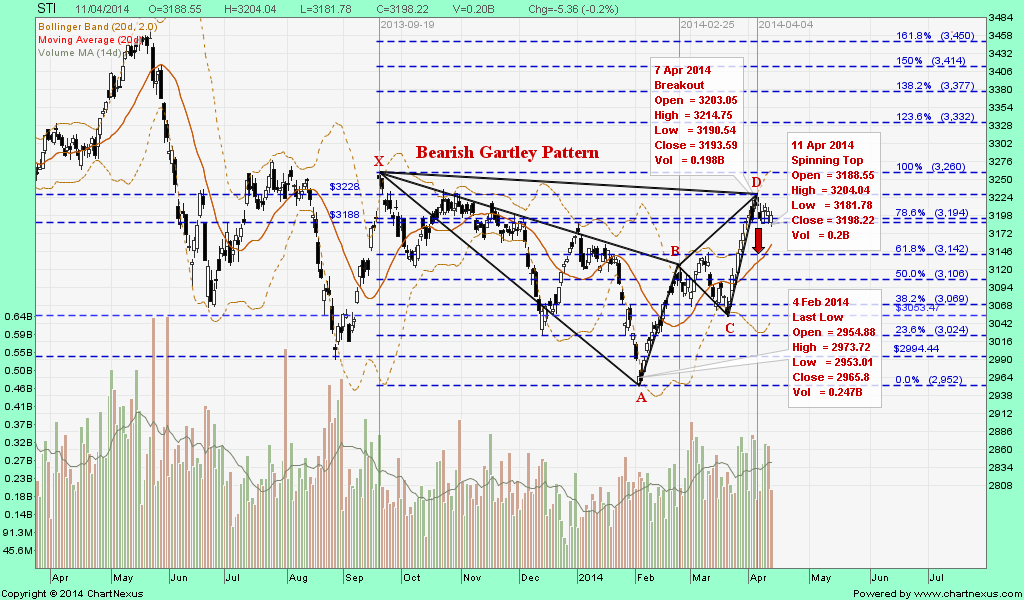
|
|
|
|
Post by zuolun on Apr 13, 2014 9:43:51 GMT 7
STI — Bearish Gartley pattern, potential bearish trend reversalSTI closed with a spinning top @ 3198.22 (-5.36, -0.2%) on 11 Apr 2014. Immediate support @ 3188, immediate resistance @ 3228. Should the bearish gartley pattern materialize, expect the STI to back down to retest the last low at 2953 scored on 4 Feb 2014. 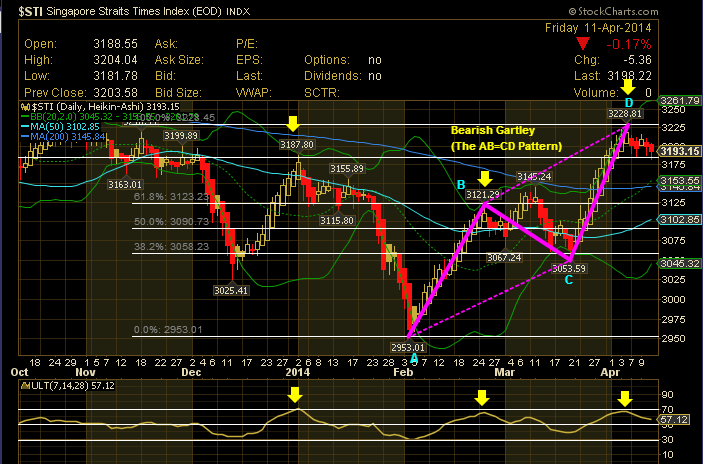
|
|
|
|
Post by odie on Apr 13, 2014 13:50:39 GMT 7
|
|
|
|
Post by odie on Apr 13, 2014 15:36:05 GMT 7
sbr.com.sg/residential-property/in-focus/home-prices-should-continue-crashing-until-2015-barclaysHome prices should continue crashing until 2015: Barclays Don't expect government unwinding anytime soon. The Singapore home price falls in 1Q14 are just the start of more declines throughout the next two years, according to Barclays Research. The research firm predicts residential prices to fall 5% in 2014 and another 5-15% in 2015, with the government only moving to arrest the decline when prices fall 10-15% from current prices. Here's the full analysis from Barclays Research: Both private and public home prices continued to fall in 1Q14 for the second and third consecutive quarters, respectively. We see no respite for both volumes and prices given 1) the ongoing government curbs, 2) looming oversupply and 3) rising interest/mortgage rates in 2H15. Indeed, we expect fundamentals to continue to deteriorate until 2H15. We continue to prefer commercial REITs to residential developers on relative fundamentals and valuations with CapitaMall Trust, CapitaCommercial Trust and Ascendas REIT (all rated OW) remaining our top picks in the sector while we have UW ratings on City Developments and Keppel Land. Both private and public home prices continued to fall in 1Q14. The Urban Redevelopment Authority's flash data for 1Q14 indicate that its index for private home prices fell 2.7 points to 211.6 in 1Q14, down 1.3% q/q and -0.8% y/y. This is the second decline after -0.9% q/q in 4Q13, bringing the cumulative decline to 2.2% since the peak. Private home prices are still 59% above the last trough in 2009. Public housing fared worse, falling for the third straight quarter for a cumulative slide of 3.9% from the peak. Private home price declines were steeper for mid- to high-end homes. In the Core Central Region (CCR), which usually represents high-end homes, prices fell 1.3% after declining 2.1% in 4Q13. This is the fourth consecutive quarter of price declines in this segment, bringing the total decline of CCR prices to 3.8% since the peak. Prices of mid-end homes fell 2.8% in 1Q14 while prices of suburban homes – proxied by the Outside Central Region (OCR) – was relatively more resilient even as it decreased for the second consecutive quarter by 0.3% after its 1.0% decrease in the previous quarter. We see no respite. Volumes have continued to fall with the developer volume down by 53% from a year ago to just 1,289 units for January-February. We expect no respite as the Total Debt Servicing Ratio (TDSR) rules in place since June 2013 continue to bite and as buyers get cautious on a looming oversupply. We maintain our negative stance on the Singapore residential sector as we estimate prices will fall 5% in 2014 and another 5-15% in 2015 as interest rates rise, coinciding with the peak in supply. We expect the vacancy rate to reach an unprecedented 9.9% by 2016. We believe that the government would only start unwinding measures when prices fall 10-15%, perhaps in 2015. We prefer REITs to developers: Given the deteriorating fundamentals of the developers, we believe SREITs offer a better risk-reward profile due to 1) SREITs' 90-300bps yield spreads above historical norms and those of global peers and 2) our expectation of better fundamentals for commercial. (Click here for our special REIT report: Singapore REITs: Fill the gap; SREITs poised to catch up of 7 March 2014).
|
|
|
|
Post by odie on Apr 13, 2014 16:53:03 GMT 7
|
|
|
|
Post by odie on Apr 13, 2014 16:53:42 GMT 7
Emerging markets and Asia Pacific
Chinese economic momentum continued to slow with PMI data for January and February declining. Data from HSBC/Markit on China’s manufacturing PMI showed that the index fell from 49.5 in January to 48.3 in February. Lower levels of activity are mainly due to action being taken by the People’s Bank of China to address worryingly high levels of
credit growth. In India, the domestic economy remains weak with high levels of inflation holding back consumer spending offset by strong exports. Asian central banks tended to hold rates, unless like India, they are fighting inflation.
Both emerging equity and debt markets improved in February and made positive returns although they lagged behind the US and Europe. There were material differences between individual markets with Latin America, China and Russia underperforming while South Africa and Australia outperformed. The MSCI Emerging Markets index returned 2.2% while Emerging Market debt returned 1.67%. Asian stock markets also followed the upward trend of global equities and in February returned 3.5%. During the month, most Asian currencies recovered along with their investment markets and appreciated against the US dollar.
|
|


