|
|
Post by zuolun on Aug 8, 2014 9:09:33 GMT 7
STI — Bearish Rising Wedge Breakout, potential downside TP 3056STI had a black marubozu @ 3287.72 (-26.5, -0.8%) on 8 Aug 2014 at 10am. Immediate support @ 3273, immediate resistance @ 3317. 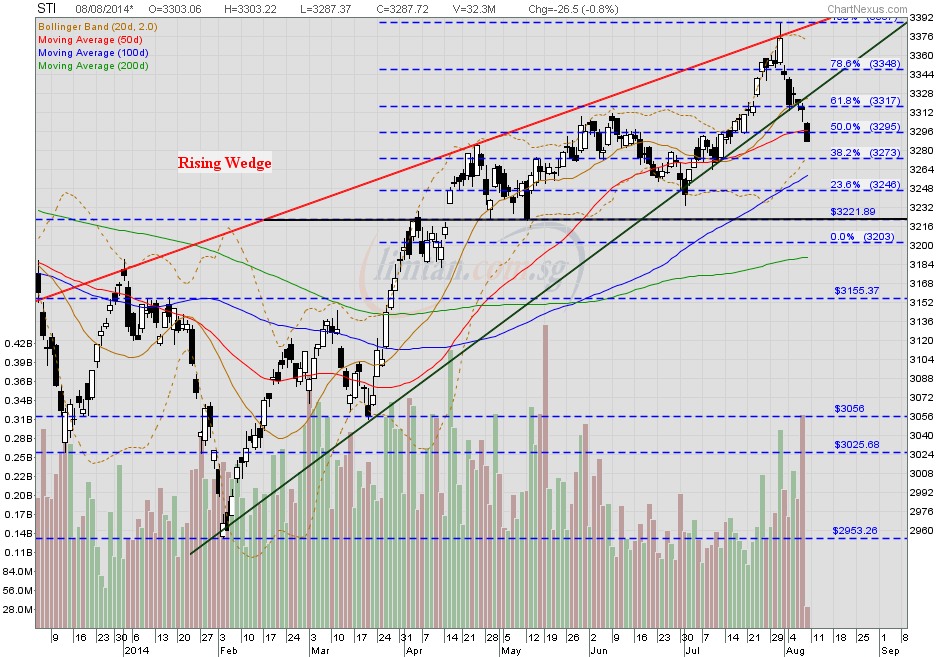 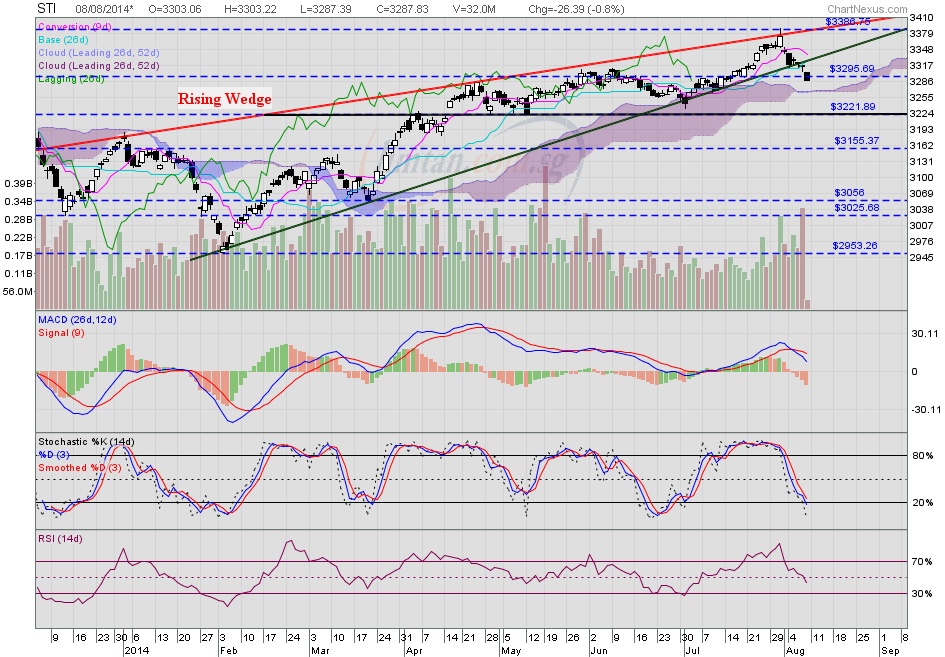 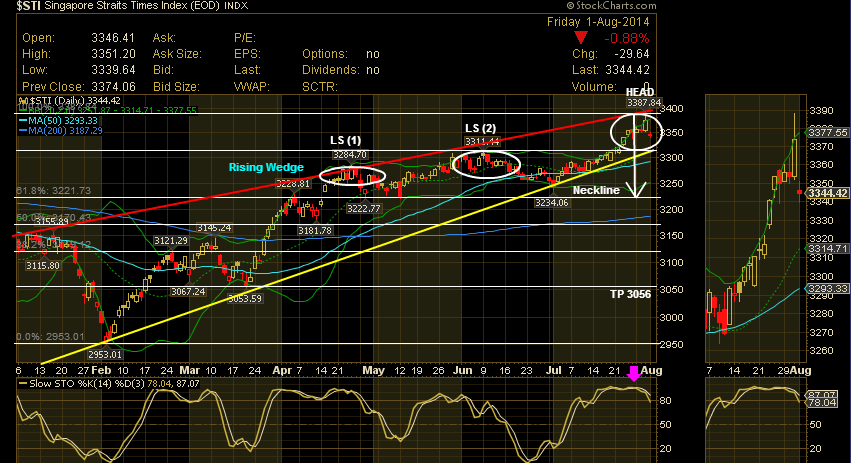
|
|
|
|
Post by zuolun on Sept 3, 2014 6:25:02 GMT 7
"S&P organizes its index by giving the biggest, most expensive stocks more "weight" in the index. Thus, the companies least likely to perform well for investors end up collecting the largest amount of investment capital from index funds.
That index isn't designed to help investors. It's designed to help sell S&P's bond ratings to issuers – i.e. large public companies."In the case of the S&P 500, the top 50 companies make up nearly half of the index — 2 Sep 2014 Straits Times Index (STI)Wild price movement on the top 6 STI stocks could swing the SiMSCI and vice versa.
1. 12.21% for Singtel 2. 11.62% for DBS3. 10.84% for OCBC4. 10.73% for UOB5. 6.35% for KepCorp6. 3.73% for GLP

|
|
|
|
Post by zuolun on Sept 3, 2014 9:53:44 GMT 7
|
|
|
|
Post by zuolun on Sept 12, 2014 13:46:20 GMT 7
STI — Symmetrical Triangle Breakout, TP 3388STI @ 3349.04 (+1.76, +0.1%) on 12 Sep 2014 at 2.45pm.  SiMSCI Futures and the top 6 STI stocks: SiMSCI Futures and the top 6 STI stocks: DBS, OCBC and UOB are strong uptrend stocks always ring-fenced by the major ang moh BBs. These 3 local banks are among the top 6 STI stocks often being used by them to swing the SiMSCI Futures and/or the STI. On 5 Sep 2014, they simultaneously heavily-shorted the SiMSCI Futures and the ST Index stocks forcing the bulls on these 2 markets to cut their losses and then U-turned by doing short-covering on both markets with negligible changes at EOD; killing 2 birds with one stone. The SiMSCI Futures was supposedly designed for investors to hedge their long positions on the ST Index stocks but it has now become a powerful tool for the major big players who have the financial muscle to swing both markets simultaneously and profit from the panic retailers, especially the aggressive heavy-weight CFD punters. If you've access to SiMSCI Futures and do a simple and straightforward comparison with the STI (volume and value done), it's not surprised to see the 2 markets swing simultaneously on certain time of the day, i.e. a Flash Crash effect. Many CFD retail punters now are extremely complacent thinking that since the STI is range-bound moving small steps (+20 / -20), they dare to punt via CFD with heavy volume but the danger lies in the SiMSCI Futures — when the major ang moh BBs do a wild swing on both markets; 50 to 100 points swing on the STI (with the closing unchanged) is enough to wipe off 20% margin in the CFD share trading account. On 11 July 2014, this strategy was applied to UOB closing @ S$24.03 with extremely heavy volume done at 4.4m shares then, i.e. they simultaneously heavily-longed the SiMSCI Futures and the ST Index stocks, forcing the silly CFD retailers who shorted UOB to desperately cover shorts by buying back @ almost S$1.00 higher.  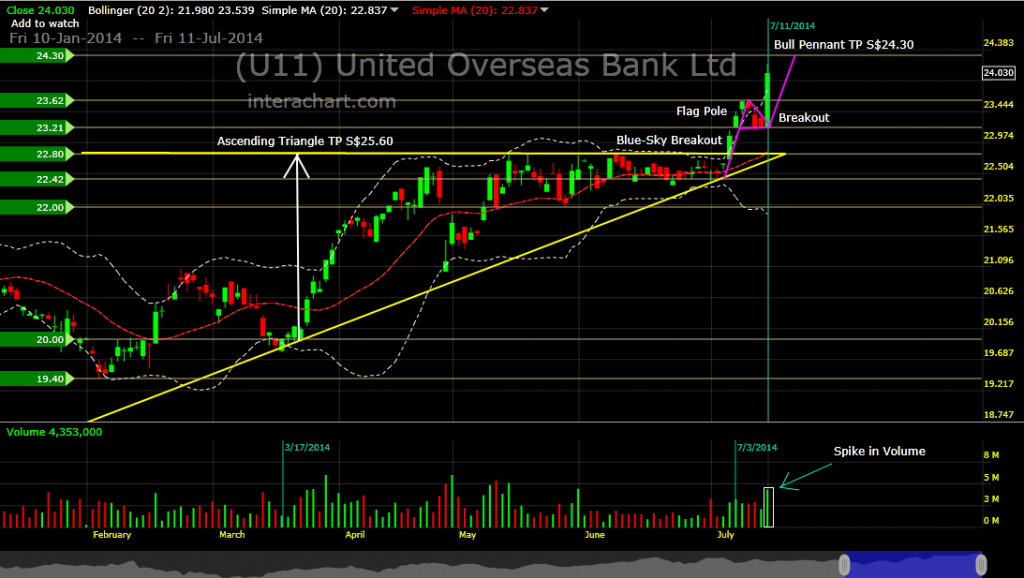 Singapore MSCI Futures closed @ 376.95 (-1.15, -0.3%) on 5 Sep 2014.  STI closed @ 3341.73 (-4.61, -0.1%) with 182.4m shares done = total volume of the 30 STI Component Stocks, on 5 Sep 2014.  STI @ 3325.01 (-21.33, -0.6%) with 85.4m shares done = total volume of the 30 STI Component Stocks, on 5 Sep 2014 at 12.05 noon. 
|
|
|
|
Post by odie on Sept 15, 2014 20:18:54 GMT 7
|
|
|
|
Post by kenjifm on Sept 16, 2014 14:04:10 GMT 7
 Will Adam and Eve Pattern Play out? 3625 will be a critical support for any upside for now. |
|
|
|
Post by zuolun on Sept 16, 2014 14:41:07 GMT 7
SiMSCI Futures and the top 6 STI stocks: Many CFD retail punters now are extremely complacent thinking that since the STI is range-bound moving small steps (+20 / -20), they dare to punt big-cap blue chip ST Index stocks via CFD with heavy volume but the danger lies in the SiMSCI Futures — when the major ang moh BBs do a wild swing on both markets; 50 to 100 points swing on the STI (with the closing unchanged) is enough to wipe off 20% margin in the CFD share trading account. UOB is one of the primary pillars of the STI; weightage @ 11.65% as at 16 Sep 2014. 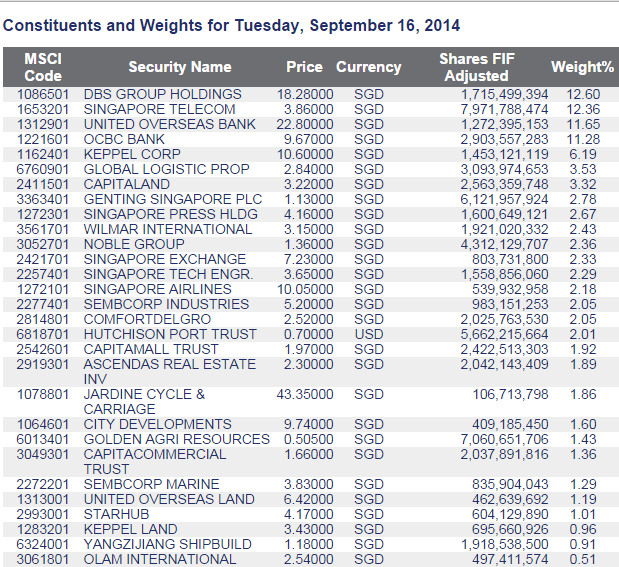 UOB — J-Hook Bull Pattern potential upside interim TP S$24.72UOB closed with an inverted hammer @ S$23.04 (+0.04, +0.2%) with 1.53m shares done on 12 Sep 2014. Immediate support @ S$22.76, immediate resistance @ S$23.33. Expect the gap bet. S$23.33 and S$23.83 created on 1 Aug 2014 to be closed, after a healthy pullback. ...United Overseas Bank Ltd., Southeast Asia’s third-largest lender, owned 14 percent of Evergrowing Bank as of Dec. 31, according to Evergrowing’s annual report. — 12 Sep 2014 J-Hook Bull Pattern won't happen liao...  UOB — Expect a Three Black Crows Chart Pattern UOB — Expect a Three Black Crows Chart Pattern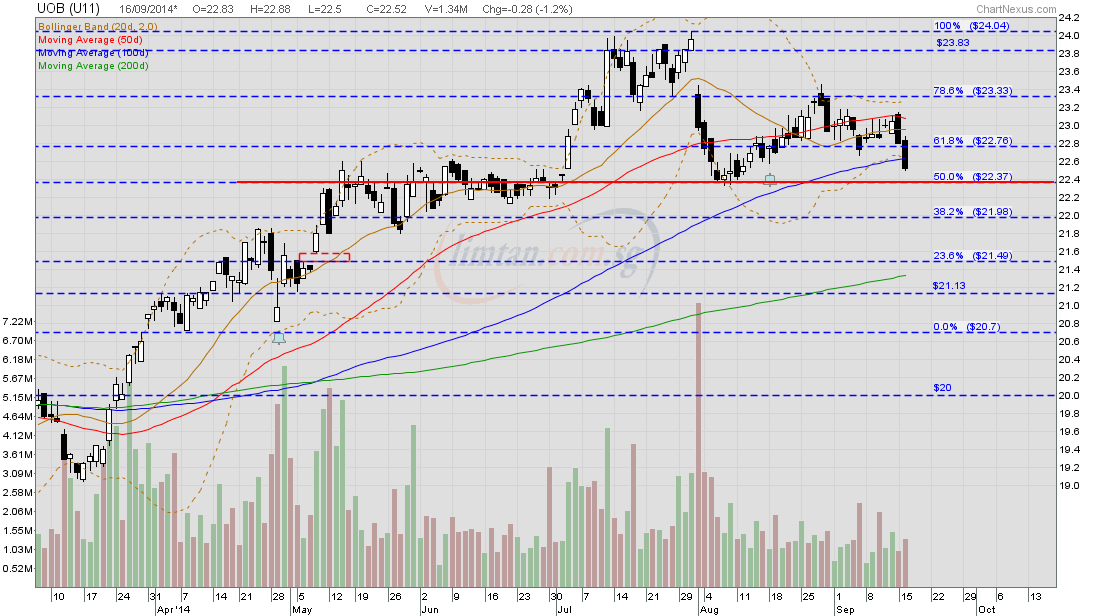
|
|
|
|
Post by odie on Sept 16, 2014 21:04:18 GMT 7
don't worry bro zuolun
uob is very steady one
strong support at 2237
|
|
|
|
Post by zuolun on Sept 17, 2014 0:50:00 GMT 7
|
|
|
|
Post by zuolun on Sept 18, 2014 11:36:14 GMT 7
thanks bro zuolun for alert think sti is in deep shit LOL STI had a shooting star @ 3300.34 (+3.86, +0.1%) on 18 Sep 2014 at 12.30 noon. 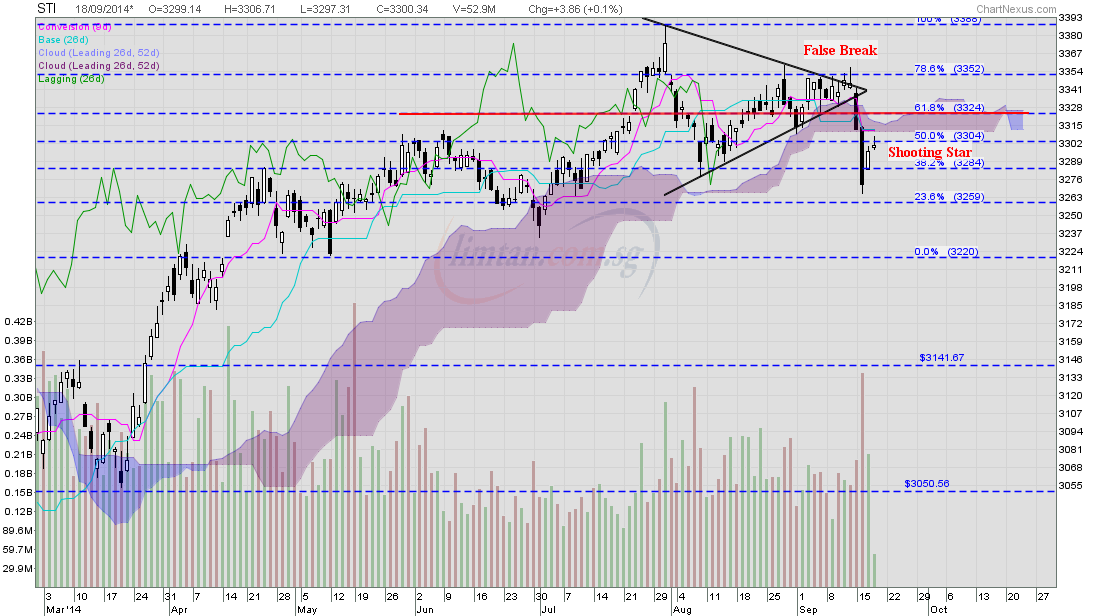 STI — Symmetrical Triangle Breakout, TP 3388STI @ 3349.04 (+1.76, +0.1%) on 12 Sep 2014 at 2.45pm. |
|
|
|
Post by odie on Sept 18, 2014 12:17:46 GMT 7
|
|
|
|
Post by odie on Sept 18, 2014 12:28:56 GMT 7
zuolun bro, one third of the 2 black candles bodies (3338 - 3273 = 65) is 65 x 1/3 = 21 the spinning top is at 3301 - 3273 = 28 which is more than one third of the two bodies of the black candles combined (3338 - 3273 = 65) maybe sti got small chance provided it closes above 3273 + 21 = 3284  |
|
|
|
Post by odie on Sept 23, 2014 8:49:56 GMT 7
|
|
|
|
Post by odie on Sept 26, 2014 18:09:44 GMT 7
zuolun bro,
vix fear indicator now only 5.
mkt is running scared.
|
|
|
|
Post by zuolun on Sept 30, 2014 13:08:56 GMT 7
STI — Bearish Rising Wedge Breakout, last line of defense @ 3217 points, the 200d SMASTI had a spinning top @ 3262.78 (-26.94, -0.8%) on 30 Sep 2014 at 2pm. Critical support @ 3263, immediate resistance @ 3287. 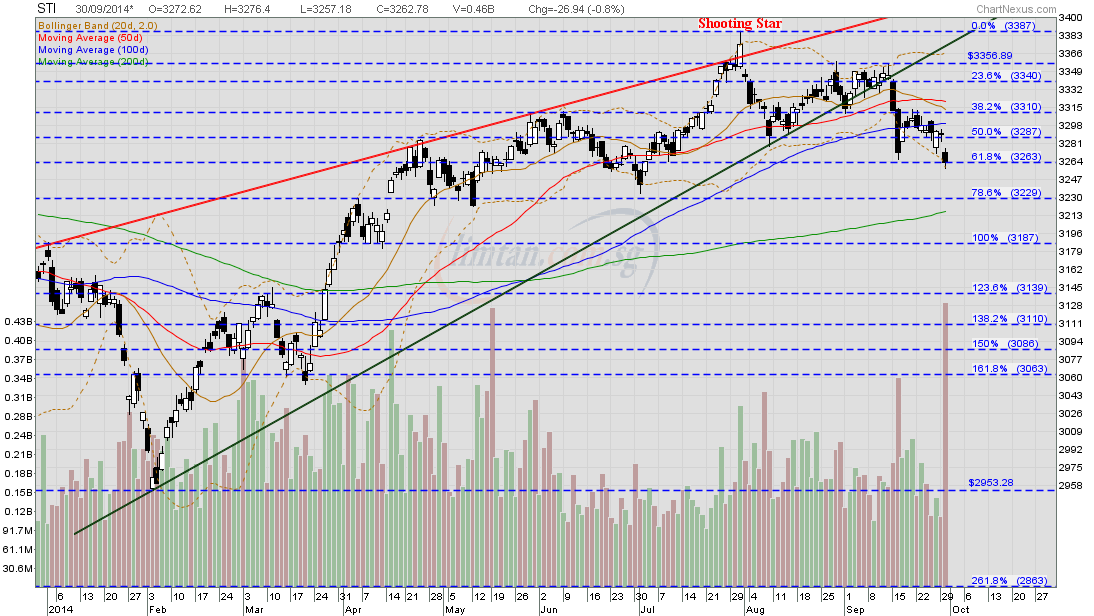
|
|


