|
|
SIA
Aug 27, 2014 10:56:26 GMT 7
Post by odie on Aug 27, 2014 10:56:26 GMT 7
zuolun bro, thanks for advice i am using cfds too  |
|
|
|
SIA
Sept 1, 2014 9:57:22 GMT 7
Post by odie on Sept 1, 2014 9:57:22 GMT 7
stopped out at 10.03 |
|
|
|
Post by zuolun on Sept 16, 2014 15:13:48 GMT 7
stopped out at 10.03 odie, SIA's chart pattern is biased to the downside, risk / reward ratio is 70:30. Once the 200d SMA support @ S$9.91 breaks down convincingly, the plunge will be similar to Genting SP and POSH.   SIA — On The Edge, the last line of defense @ S$9.91, the 200d SMA SIA — On The Edge, the last line of defense @ S$9.91, the 200d SMASIA had a spinning top unchanged @ S$10.05 with 1.04m shares done on 16 Sep 2014 at 4.30 pm. 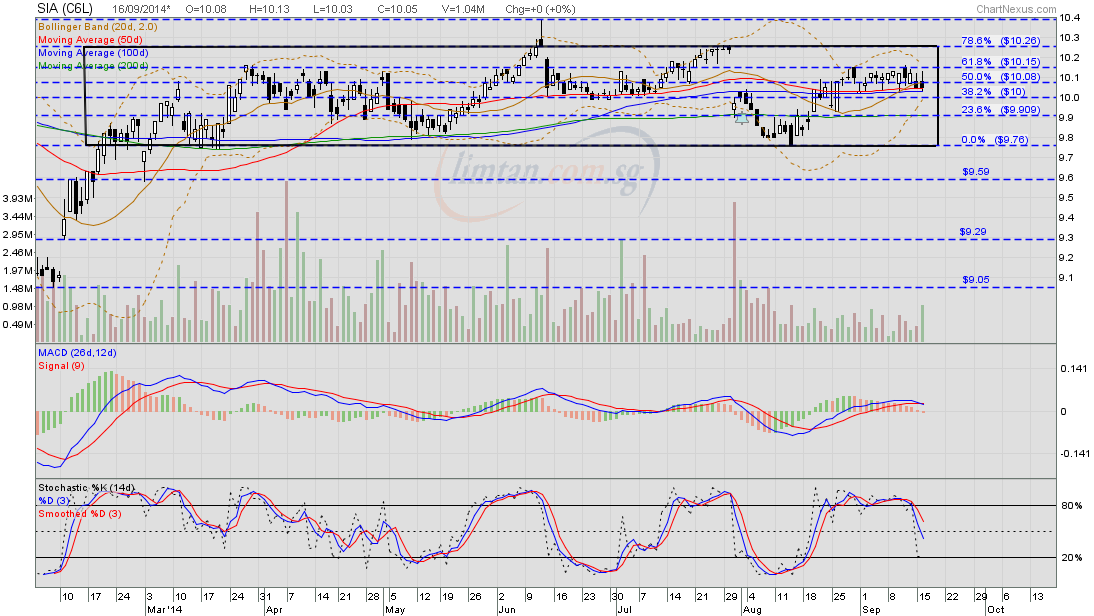 Genting SP and POSH: Chart Pattern — Bearish Bollinger Bands Breakout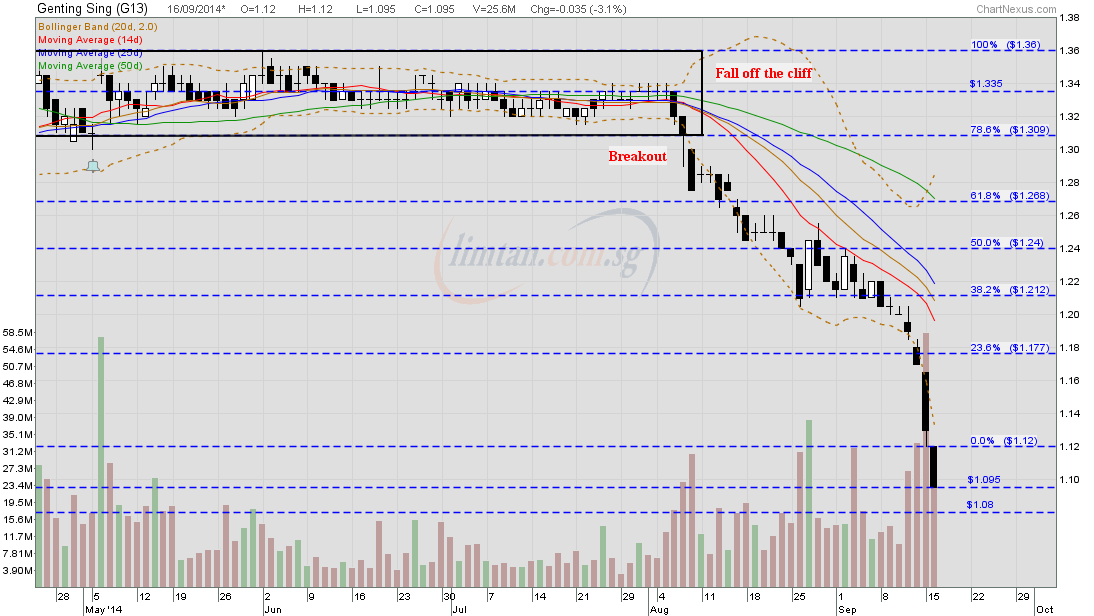 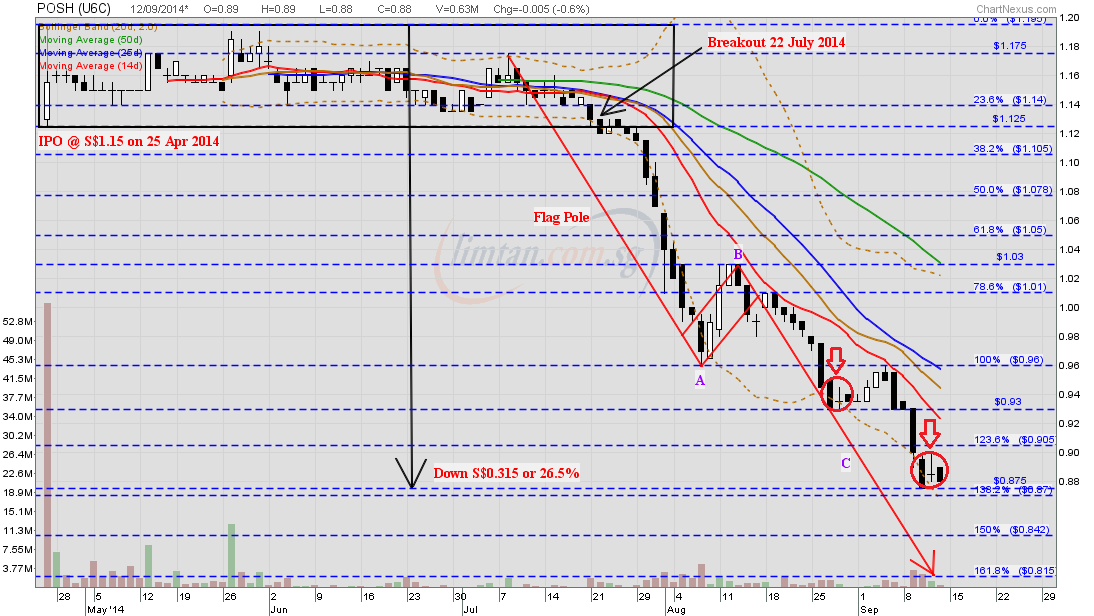 |
|
|
|
SIA
Sept 16, 2014 15:27:27 GMT 7
zuolun likes this
Post by odie on Sept 16, 2014 15:27:27 GMT 7
wah, bro zuolun, this bugger got 2 gaps still not closed one gap at 912 to 930 and another at 1015 to 1020 LOL think all CKs going to queue on friday overnight for iphone 6 and 6+ liao you shld go to facebook and go to singtel and starhub and m1 pages a lot of angry customers, pure entertainment reading some comments LOL |
|
|
|
Post by zuolun on Sept 16, 2014 15:40:20 GMT 7
wah, bro zuolun, this bugger got 2 gaps still not closed one gap at 912 to 930 and another at 1015 to 1020 LOL think all CKs going to queue on friday overnight for iphone 6 and 6+ liao you shld go to facebook and go to singtel and starhub and m1 pages a lot of angry customers, pure entertainment reading some comments LOL |
|
|
|
Post by odie on Sept 16, 2014 15:49:54 GMT 7
noted with thanks, zuolun bro trying small small with 1 lot LOL |
|
|
|
SIA
Sept 16, 2014 16:22:00 GMT 7
zuolun likes this
Post by odie on Sept 16, 2014 16:22:00 GMT 7
|
|
|
|
Post by zuolun on Sept 16, 2014 17:06:54 GMT 7
odie, My daily chart is not meant for swing trading. Your 30 min chart should be the correct chart for intraday/contra trading. SIA 30 min chart 16 Sep 2014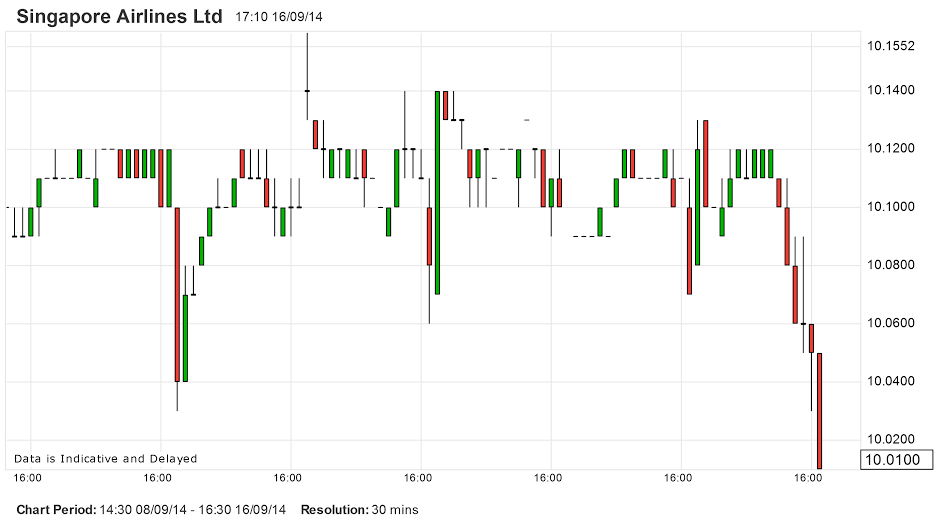 SIA — On The Edge, the last line of defense @ S$9.91, the 200d SMA SIA — On The Edge, the last line of defense @ S$9.91, the 200d SMASIA closed with an inverted hammer @ S$10.01 (-0.04, -0.4%) with 1.32m shares done on 16 Sep 2014. Immediate support @ S$10.00, immediate resistance @ S$10.08. 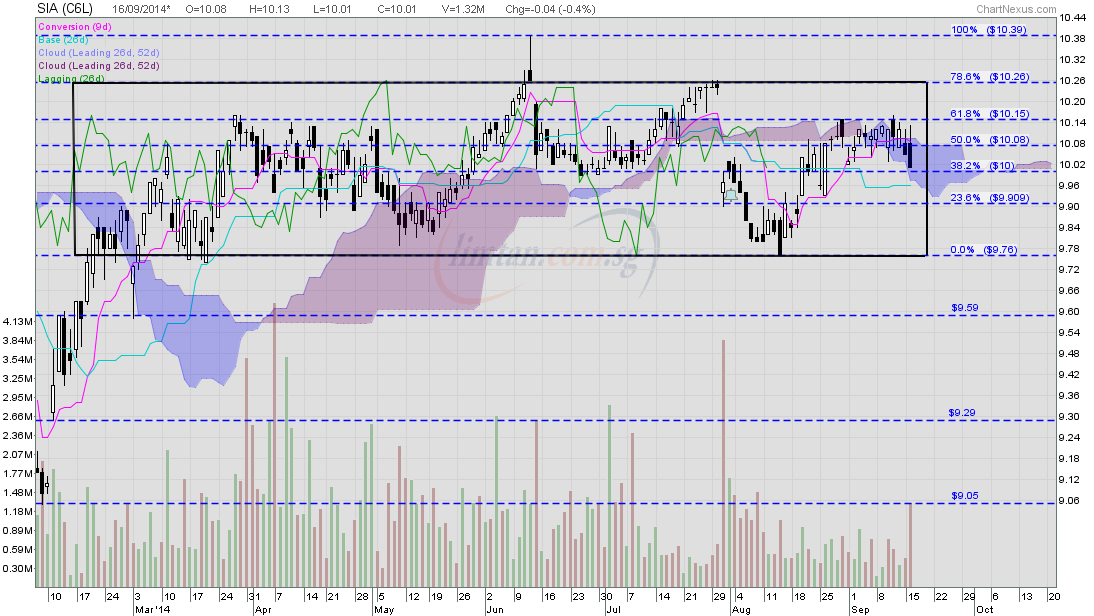 odie, SIA's chart pattern is biased to the downside, risk / reward ratio is 70:30. Once the 200d SMA support @ S$9.91 breaks down convincingly, the plunge will be similar to Genting SP and POSH. SIA — On The Edge, the last line of defense @ S$9.91, the 200d SMASIA had a spinning top unchanged @ S$10.05 with 1.04m shares done on 16 Sep 2014 at 4.30 pm. |
|
|
|
SIA
Sept 16, 2014 18:20:20 GMT 7
zuolun likes this
Post by odie on Sept 16, 2014 18:20:20 GMT 7
odie, My daily chart is not meant for swing trading. Your 30 min chart should be the correct chart for intraday/contra trading. SIA 30 min chart 16 Sep 2014thanks zuolun bro hope can make some kopi $$ tmr |
|
|
|
SIA
Sept 17, 2014 8:12:15 GMT 7
odie likes this
Post by zuolun on Sept 17, 2014 8:12:15 GMT 7
odie, My daily chart is not meant for swing trading. Your 30 min chart should be the correct chart for intraday/contra trading. SIA 30 min chart 16 Sep 2014thanks zuolun bro hope can make some kopi $$ tmr  |
|
|
|
SIA
Sept 17, 2014 9:10:09 GMT 7
Post by odie on Sept 17, 2014 9:10:09 GMT 7
zuolun bro,
stopped out at 10.10
LOL
|
|
|
|
Post by zuolun on Sept 17, 2014 9:27:19 GMT 7
stopped out at 10.03 zuolun bro, stopped out at 10.10 LOL odie, You feed your broker + his family members on a regular basis!  STI dead cat bounce with extremely thin volume done 7early8early in the morning.  STI @ 3288.96 (+16.34, +0.5%) with 47.97m shares done = total volume of the 30 STI Component Stocks, on 17 Sep 2014 at 9.45 am. 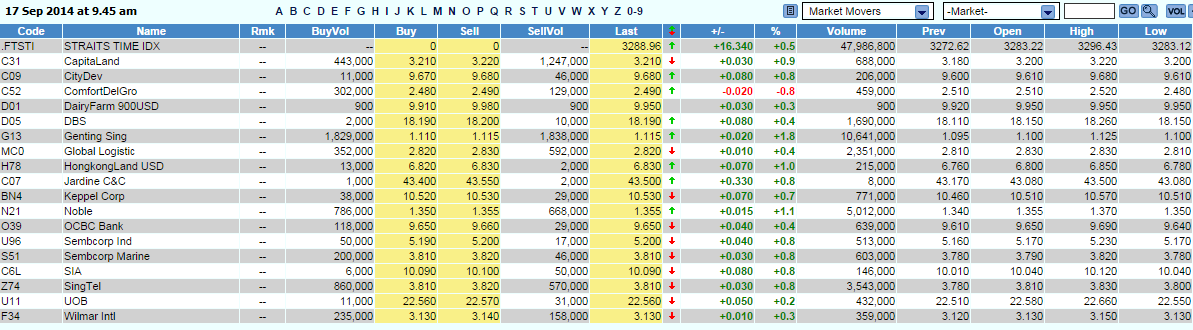 |
|
|
|
SIA
Sept 17, 2014 9:45:03 GMT 7
Post by odie on Sept 17, 2014 9:45:03 GMT 7
zuolun bro,
tonight alibaba ipo
means nasdaq will close green green
LOL
|
|
|
|
SIA
Sept 25, 2014 13:41:33 GMT 7
oldman likes this
Post by zuolun on Sept 25, 2014 13:41:33 GMT 7
SIA — On The Edge, the last line of defense @ S$9.91, the 200d SMASIA had a hammer @ S$9.95 (-0.01, -0.1%) with thin volume done at 150 lots on 25 Sep 2014 at 2.35pm. Immediate resistance @ S$10.00, immediate support @ S$9.91, the 200d SMA. 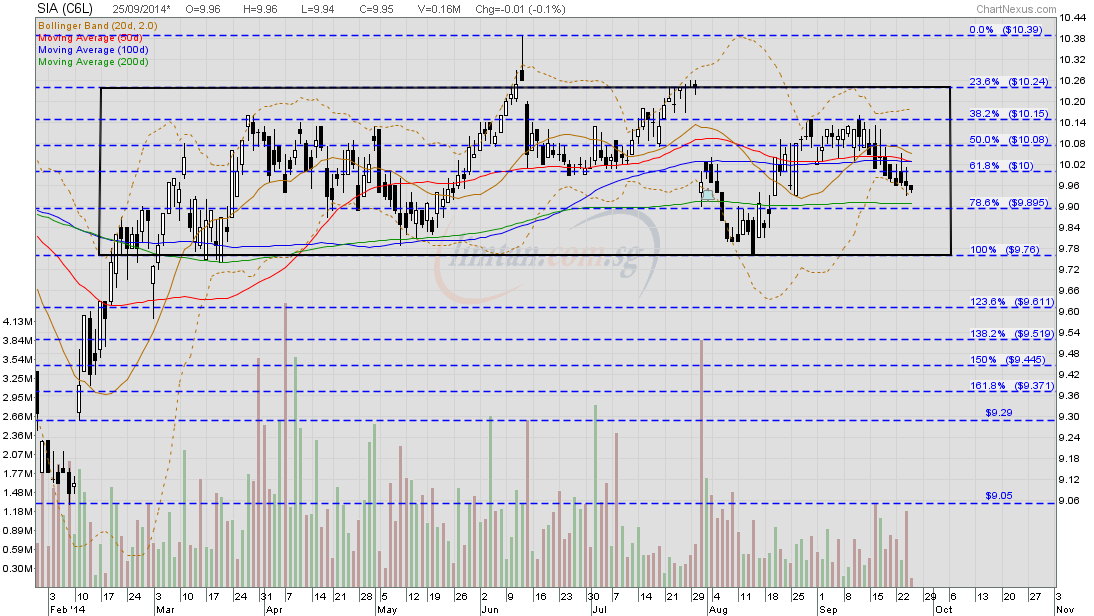
|
|
|
|
Post by zuolun on Sept 30, 2014 23:40:01 GMT 7
SIA — Broke the 200d SMA with high volume, expect a "waterfall" decline to close the gap bet. S$9.13 to S$9.29SIA gapped down and closed with a long black marubozu @ S$9.84 (-0.11, -1.1%) with 1.34m shares done on 30 Sep 2014. Immediate support @ S$9.76, immediate resistance @ S$9.91. 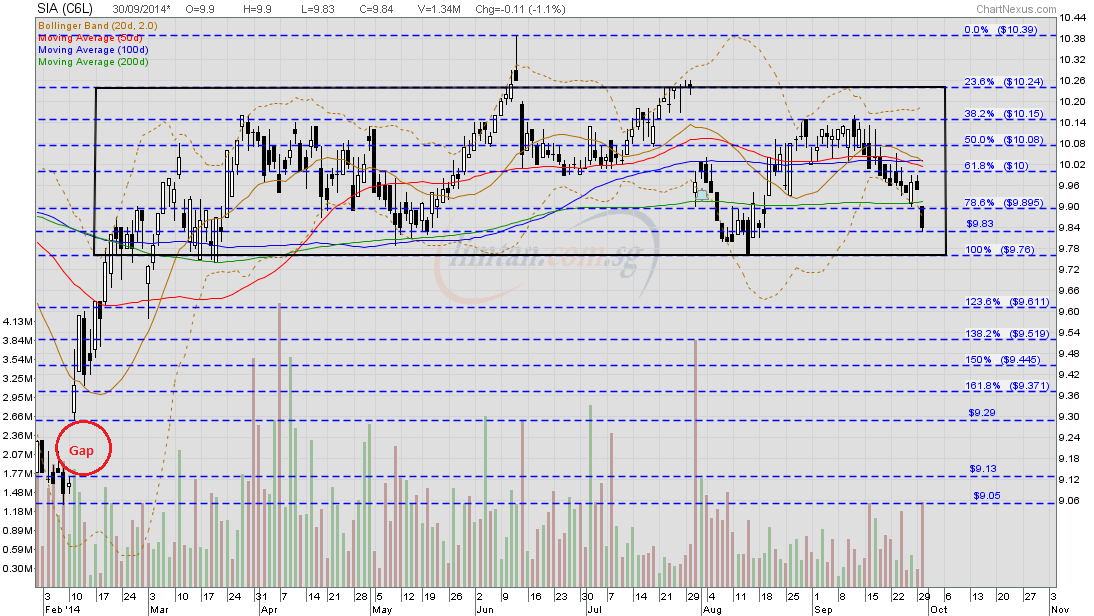 SIA (weekly) — Trading in a downward sloping channel SIA (weekly) — Trading in a downward sloping channel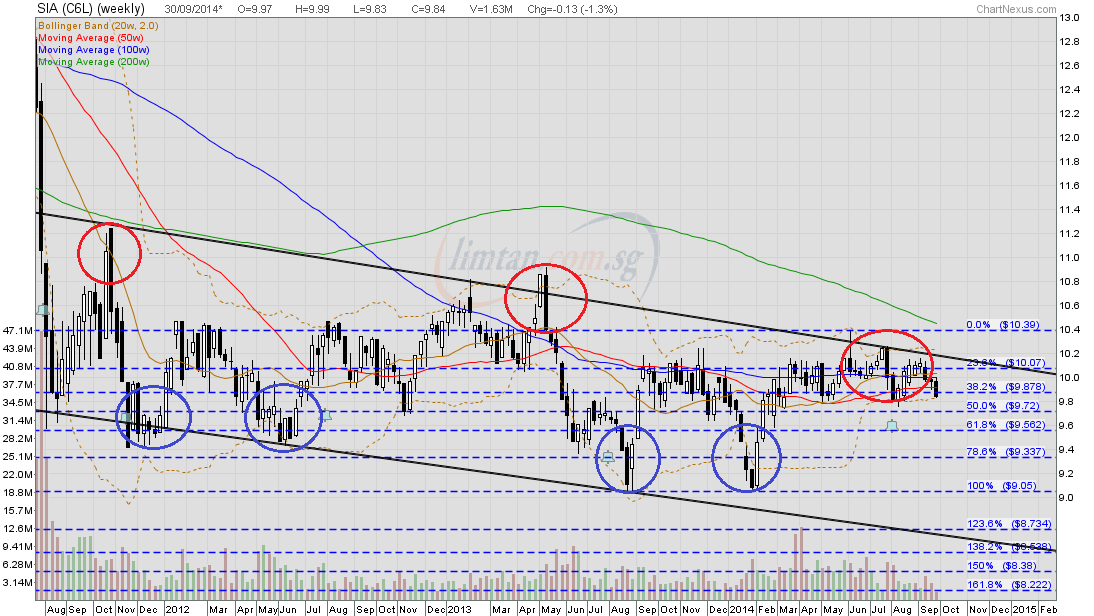 odie, SIA's chart pattern is biased to the downside, risk / reward ratio is 70:30. Once the 200d SMA support @ S$9.91 breaks down convincingly, the plunge will be similar to Genting SP and POSH. SIA — On The Edge, the last line of defense @ S$9.91, the 200d SMASIA had a spinning top unchanged @ S$10.05 with 1.04m shares done on 16 Sep 2014 at 4.30 pm.
|
|


