|
|
Post by stockpicker on Aug 7, 2014 8:11:38 GMT 7
The Global situation is turning ugly day by day with the following events making situation worser 1. The default of Argentina though there were speculations that this default would be resolved 2. The recession in Italy 3. The Sanction of Russia and the Russian's ban of $billion imports as a retaliation US stock has little change because of the earning season. Prudential and some companies reported better than expected results yesterday. About 75 percent of those that have posted results this season have beaten analysts’ estimates for profit, while 64 percent exceeded sales projections, data compiled by Bloomberg show. However, if the Global condition does not improve, we will likely see US market taking a plunge when the earning season ends around 3nd week of August. Meanwhile, the market is waiting for ECB to announce its rate decision which will be at 1:45 p.m. in Frankfurt. Most economists expected ECB to keep the benchmark rate at 0.15 percent. Technically, DOW is in a very weak position after having broken the rising wedge that has enclosed it since Feb 2014. It is now below the ichimoku clouds and sits just above the 200-day MA. Coming up will be the head and shoulder which will give a "big band" if it's neck line is broken. We should see volume increasing as DOW broke the 200-day as well as the neckline. 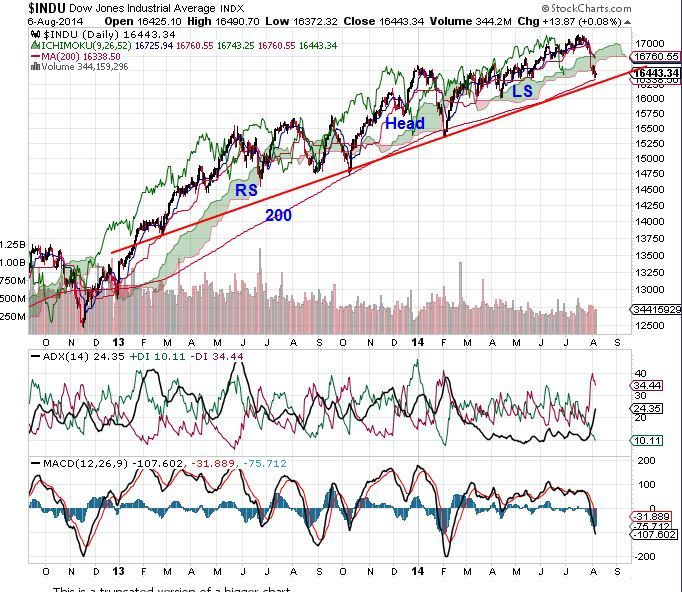 [/URL] The speculation about flattening of yield curve has somewhat eased. The yield curve of 30-5 year reported earlier has taken a breather at the moment going sideway although it has broken the 2011 low and is now heading to bleach the 2009 low. The investors were worrying that Fed would hike interest rate mid next year. 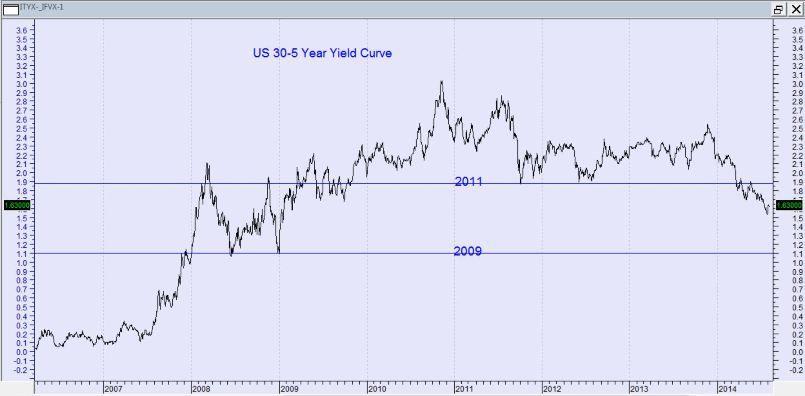 |
|
|
|
Post by stockpicker on Aug 8, 2014 9:40:01 GMT 7
DOW reached a decision point. It parked right at 200 day MA waiting for a decision; however, the news today is not kind to stock.. US just announced air striking Iraq. Stock turned for the worst just now but recovered slightly a few minutes ago. The past told us to be careful whenever DOW is at strong support.. DOW rallied many times before at 200 MA, the last time happened early 2014, DOW rallied more than 1,500 points. At present, the -DI is showing some resistance and is about to turn around, making a reversal as shown if the condition favours such move.. It is good to wait for DOW to break 200 MA decisively before acting further 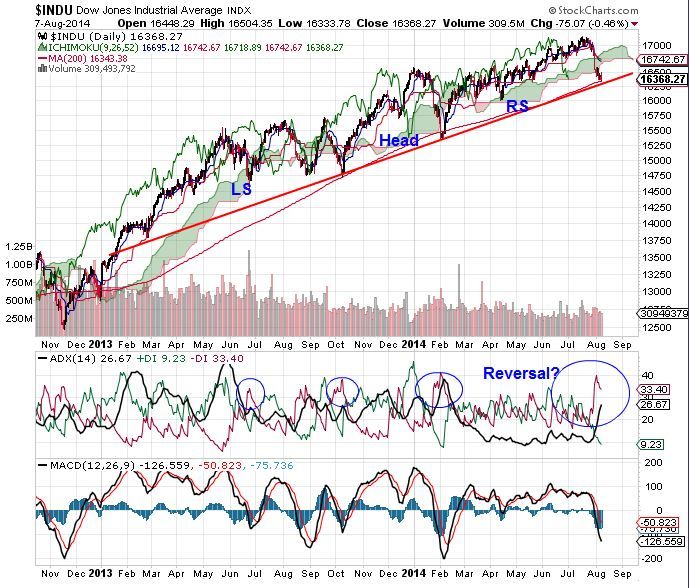 |
|
|
|
Post by stockpicker on Aug 9, 2014 10:36:06 GMT 7
As expected, DOW rebounced from the 200MA last night. The US market was so sensitive and worked up that it had taken Russian Military drill along the Ukraine border as Russian building up military tension in the Ukraine war. DOW jumped over 1% last night when Russia said that its military drill was over. Going ahead, we should see a-not-so-calm market coming up especially when the indexes are reaching the support and resistance levels.. VIX dropped about 5% in response www.gmanetwork.com/news/story/374071/news/world/russia-s-defense-ministry-says-military-drills-near-ukraine-over |
|
|
|
Post by stockpicker on Aug 9, 2014 16:41:54 GMT 7
|
|
|
|
Post by stockpicker on Aug 24, 2014 18:28:19 GMT 7
US market has an eye for the interest rate hike when Fed was debating on whether to increase the Fed rate by mid 2015...those who believed Fed will increase rate said that the impact has been priced-in but some disagreed, saying the after effects such as the increase cost in housing mortgage etc may not have been priced-in and market will adjust accordingly to reflect the Fed rate hike. Technically, DOW has overcome most of the hurdles and resistances and on its way to create new high.. but last Friday's trading has created a bearish harami candlestick which indicates a correction to come. This is supported by the MACD which showed a overbought and the readiness to go negative. As usual, this will have to be confirmed by another down day candlestick. Whether the correction will be serious will depend if the supports will be broken.. have fun trading.. 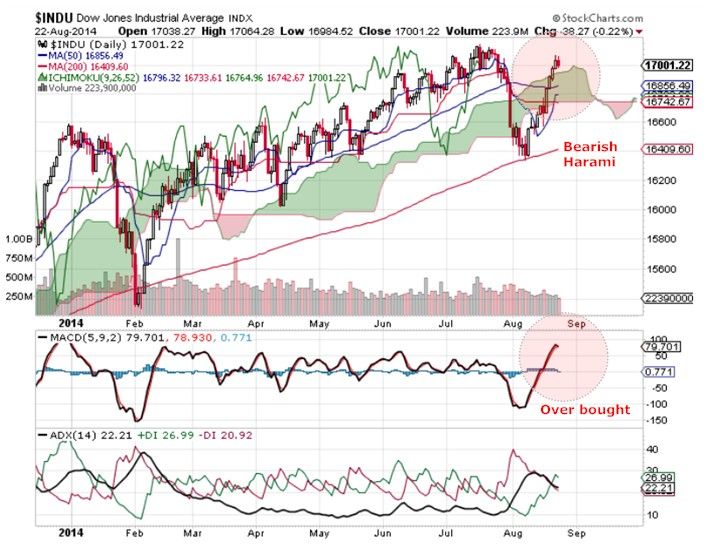 |
|
|
|
Post by stockpicker on Aug 27, 2014 9:28:15 GMT 7
Jackson hole always bring great joy to the European and US markets when the financial giants meet. They have done what they know best, NATO. But are the markets listening? Yes, said the equity market but not exactly, said the bond market. The bond market has diverged from the equity market since November 2013 when FED first announced that it would hike interest rate sometime next year. S&P broke the 2000 barrier and yesterday, DOW broke all time high but retreated to end just below the all-time-high. Is that the end? This DOW chart shows mixed results with short term MACD in the overbought indicating a sell down will begin but the other indicators clearly shows the bullishness of the trend with DOW able to leap further.. it has deviated from the basic principle of candlestick rules in the first instance and is now "above the clouds". It will be hard to predict the future unless there are more signs other than the double top that might be formed.. 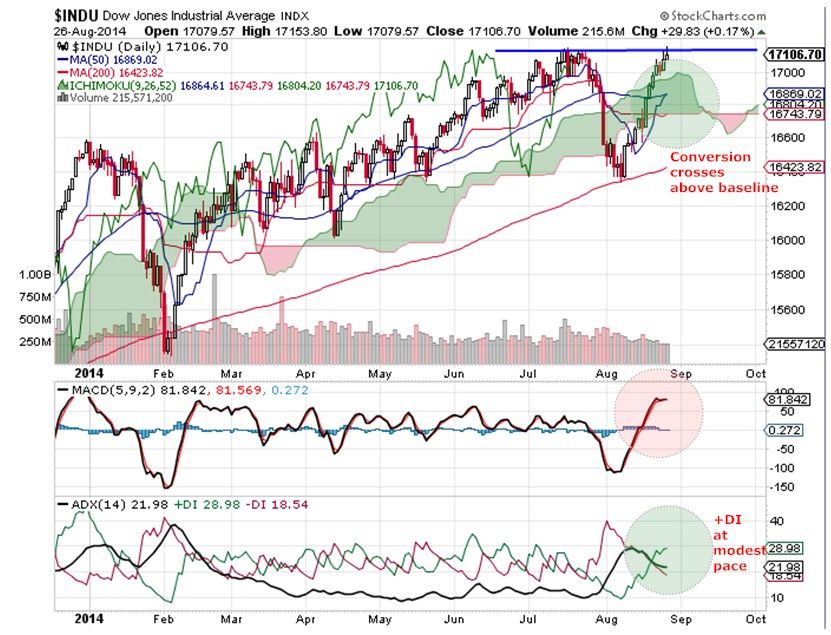 |
|
|
|
Post by zuolun on Sept 3, 2014 6:12:56 GMT 7
All the US Indices can shoot to the roof, without strong supporting volume — 2 Sep 2014 A simple way to beat the market, year after yearBy Brett Eversole 2 Sep 2014 There's nothing better than a simple, stupid investment idea. Most folks think you have to reinvent the wheel to beat the market. They think the only way to produce outsized returns is with complex strategies. The kind the average person can't follow. They're wrong. Today, I'll show a simple way to beat the stock market. Importantly, this idea makes intuitive sense. And there's an easy way to make the trade today. This simple idea beats the market by 1.8% a year. That might not sound like much, but over time, it leads to hundreds of percent in excess returns. Let me explain... Today's simple market-beating strategy requires us to rethink what "the market" actually is. In the U.S., our benchmark for stocks is the S&P 500. This index holds the largest 500 companies that trade in the U.S. That makes sense. If you want to own the U.S., own the biggest and the best. But there's a problem with this approach. As my colleague Porter Stansberry points out... "S&P organizes its index by giving the biggest, most expensive stocks more "weight" in the index. Thus, the companies least likely to perform well for investors end up collecting the largest amount of investment capital from index funds.
That index isn't designed to help investors. It's designed to help sell S&P's bond ratings to issuers – i.e. large public companies."Porter's describing "market cap weighting." It puts more of the index value into the largest companies, and less into the smaller companies. In the case of the S&P 500, the top 50 companies make up nearly half of the index. That's a problem... as the largest companies tend to be the most mature, and tend to provide lower returns over the long term. But history shows there's an easy way to beat this formula. The simple change is moving from market cap weighting to equal weighting. In the equal weight S&P 500, each stock is 0.2% (one 500th) of the index, regardless of size. That might seem like a minor change. But the increase to returns is enormous. Since its inception in 1989, the equal-weight S&P 500 is up 1,297% (including dividends). The normal S&P returned just 823% over the same period (also including dividends). Over that 25-year period, the equal weight S&P 500 returned 11.3% a year versus 9.5% in the market cap-weighted S&P 500... a 1.8% annual outperformance. Again, an extra 1.8% a year might not sound like much. But it adds up. And during the "lost decade" of the 2000s, the equal weight S&P 500 doubled while the normal index went nowhere. The great news for investors is that there's an easy way to make this trade today. It's called the Guggenheim S&P 500 Equal Weight Fund (NYSE: RSP, Stock Forum). While you've likely never heard of RSP, it's a seasoned fund that has been available for over a decade. It does a fantastic job tracking the equal weight S&P 500. And it makes following this idea easy. Like I said, this is a simple idea. But that's a good thing. We don't need to reinvent the wheel to beat the market. It takes an index everyone knows about, makes a small change, and increases long-term returns. Perfect. If you're a long-term investor looking to maximize gains, forget about the S&P 500. Put money to work the smart way. Shares of RSP are the easy way to do it.
|
|
|
|
Post by stockpicker on Sept 10, 2014 8:39:35 GMT 7
The US 3rd quarter will end in Sept and companies will be starting to report earnings come October. The US market may be trying to get ready for the start of the earning season in October with a correction. If the earning is good, up it goes with a recovery; otherwise, continue to fall to make new lows.
DOW created a bearish harami on Monday, 8 Sept and yesterday, responded with a pull away red candlestick, signifying the start of the correction cycle. If it continue to fall below 16,750, we may see more serious correction coming to test the 200 day @ 16,600, otherwise, it may rebounce to test higher highs.
|
|
|
|
Post by stockpicker on Sept 13, 2014 17:16:20 GMT 7
The US market went south although the retail sale and the business retail figure and inventories were good. The market were worried that the good news would prompt FED to change its usual tone on the interest rate policies next week. It is the time when good news becomes bad news.
|
|
|
|
Post by stockpicker on Sept 14, 2014 19:25:40 GMT 7
|
|
|
|
Post by zuolun on Sept 17, 2014 8:18:03 GMT 7
|
|
|
|
Post by stockpicker on Sept 19, 2014 6:48:35 GMT 7
FED is powerful with its wordings that interest rate will only rise end of 2015, calming the market that there is still time to make some money before the "curtain" shuts. DOW rallied triple digit last night, pushing up the index by 64% to 17,265. This bull is also helped by the ending poll with an early indication that Scotland will stay in England. Bearing unforeseen circumstances, this bull is here to stay with most indicators turning positive as shown in the attached chart. It now has a target around 17,600 until it bleaches the rising channel or cut below the rising wedge. 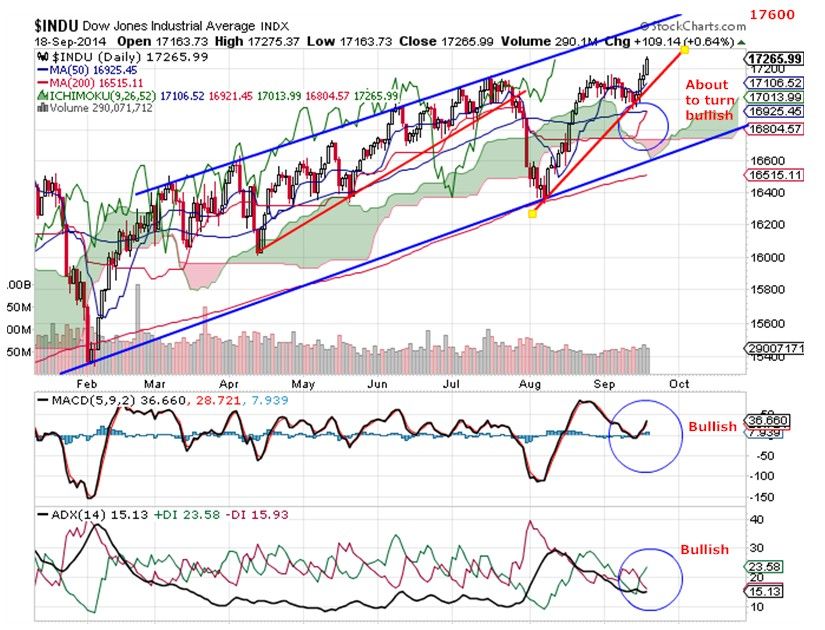 The US bank index has yet to break the symmetrical triangle that has enclosed it as shown in the earlier chart although it has risen 33 point or 1.3% last night due to the good news around. Going ahead, it is still better to be cautious as DOW has almost at the peak. Any bad news will send volatility to the market. |
|
|
|
Post by zuolun on Sept 19, 2014 13:47:42 GMT 7
DJ, RMG and POSH:Technical Analysis — In an uptrend support holds (buy on dip); in a downtrend support breaks (sell on strength). 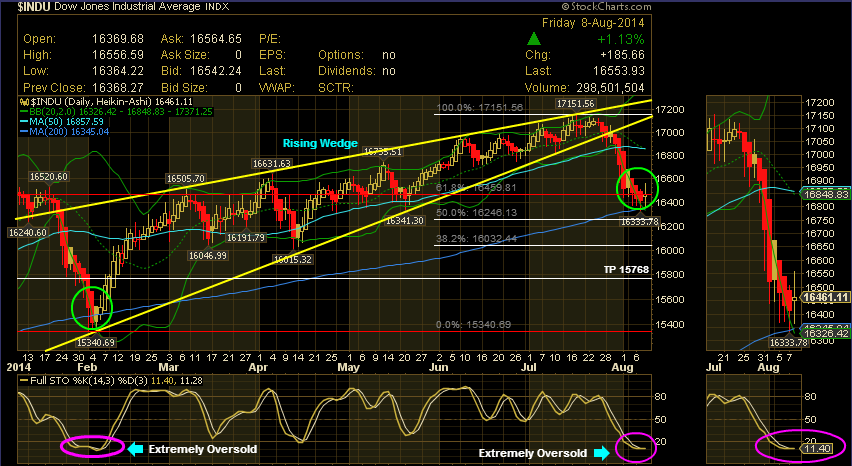  
|
|
|
|
Post by stockpicker on Sept 20, 2014 8:17:39 GMT 7
Finally, another shooting star spotted in DOW. This time accompanied by heavy volume. It has a very very long tail, a typical real shooting star . The last time happened in 9 June but that shooting star was not confirmed the next day. There were no bad news instead, good news all around. The British Scotland separation was nulled; Fitch affirmed USA's triple A rating etc etc. The last 30-minute sale dropping 30 points reaffirmed that there were bears out there, taking money off the table. The Bank index suffered a 20 points or 0.77% drop with Greed Fear Index showing market fears at high Indexes. The heavy volume indicating a capitulation with bulls running out of strength in the last minutes of the day. These are signs that a downtrend is imminent from here. But but, the shooting star will have to be confirmed the next day by a long red candle, pulling away from the top, showing the strength and determination of the bears. 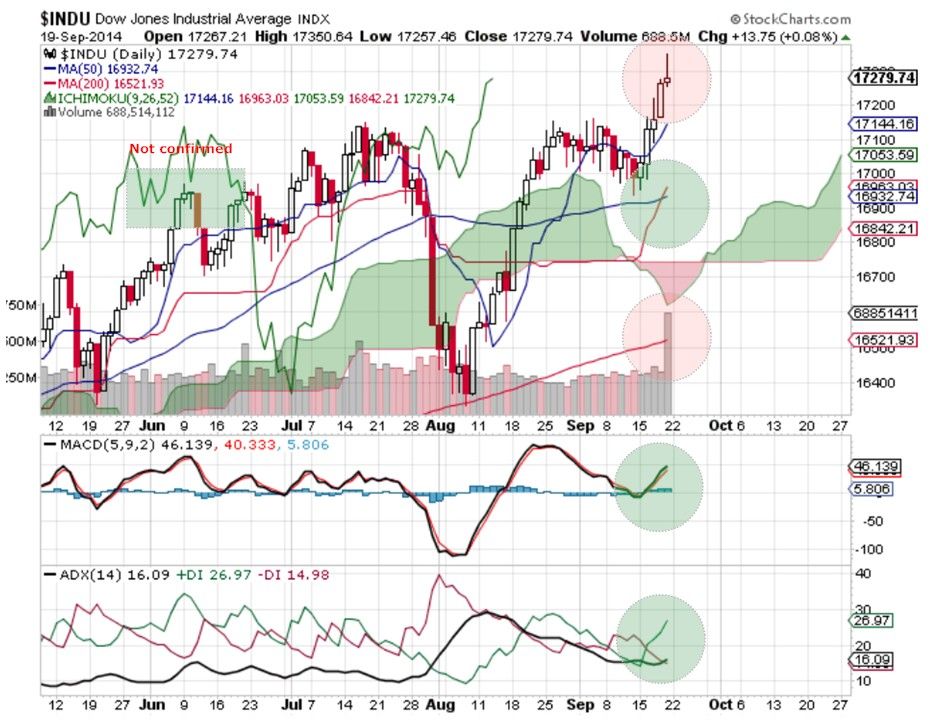 |
|
|
|
Post by stockpicker on Sept 23, 2014 17:15:33 GMT 7
DOW has a rough night last night and confirmed the shooting star, turning it into an evening star, signifying that this correction is going to be worst than the one in August. This can only be confirmed again when DOW breaks below the 200MA mark. As for the bank index $BANK, it has already broke below its 200MA, this will not help DOW to recover... it is good to stay sideline. www.investopedia.com/terms/e/eveningstar.asp |
|


