|
|
Post by zuolun on Apr 7, 2015 17:09:57 GMT 7
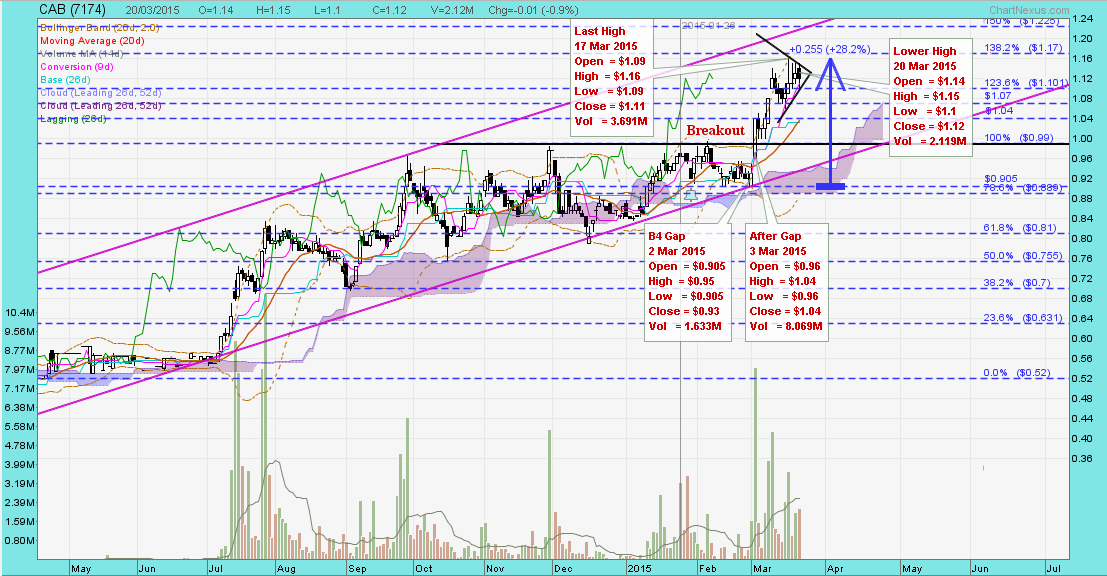
CAREPLS and CAB: Chart Pattern ~ Ascending Broadening Wedge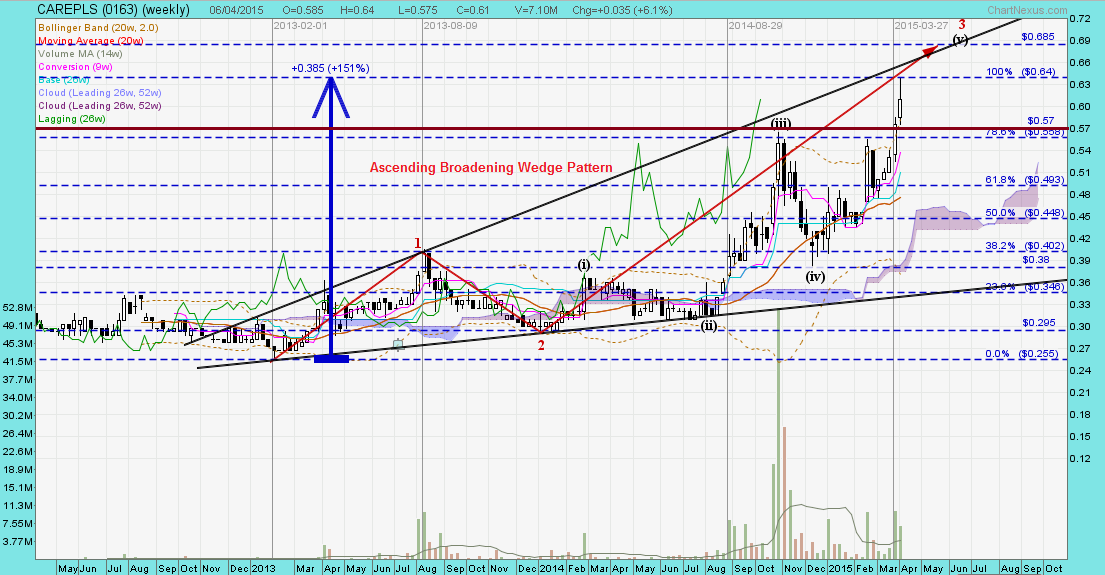 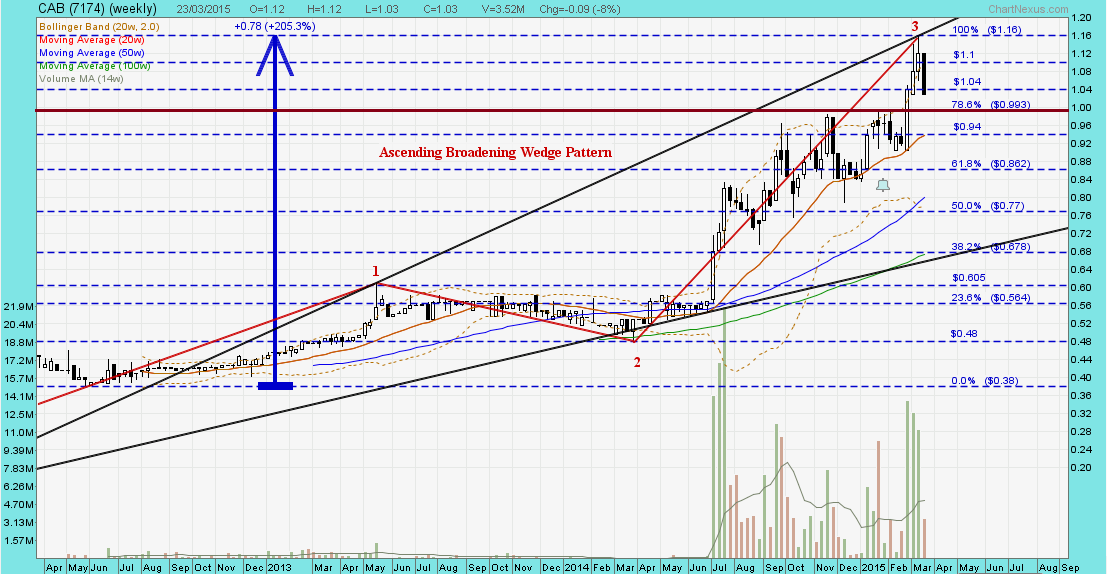
|
|
|
|
Post by zuolun on Apr 14, 2015 6:05:07 GMT 7
Sarin Tech and SuperGroup: Chart Pattern ~ Bearish Diamond Top Breakout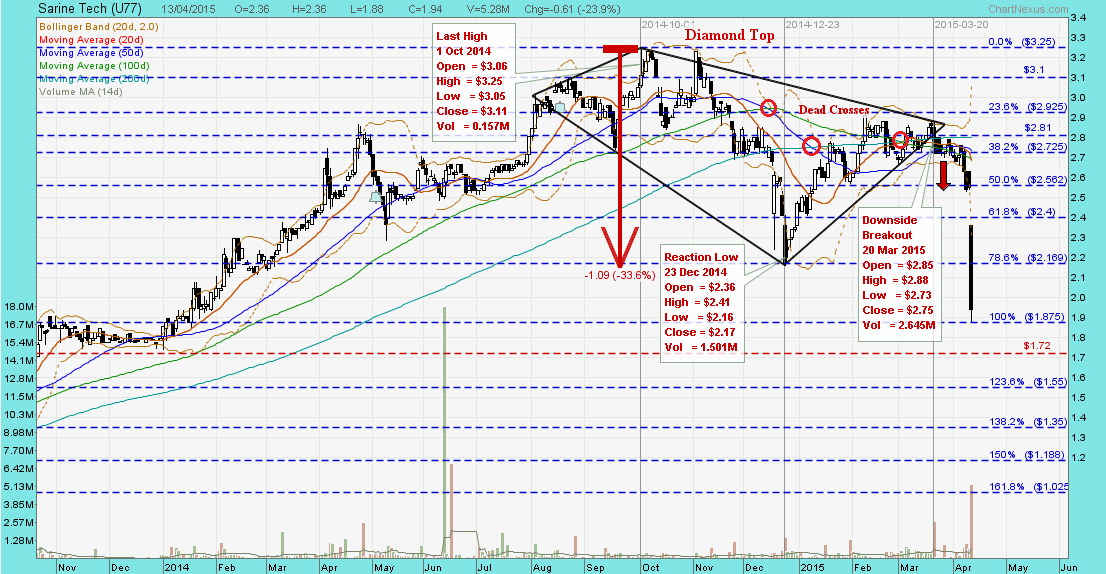 
|
|
|
|
Post by zuolun on Apr 24, 2015 13:24:53 GMT 7
Ying Li and AirAsia: Chart Pattern ~ Trading in a downward sloping channel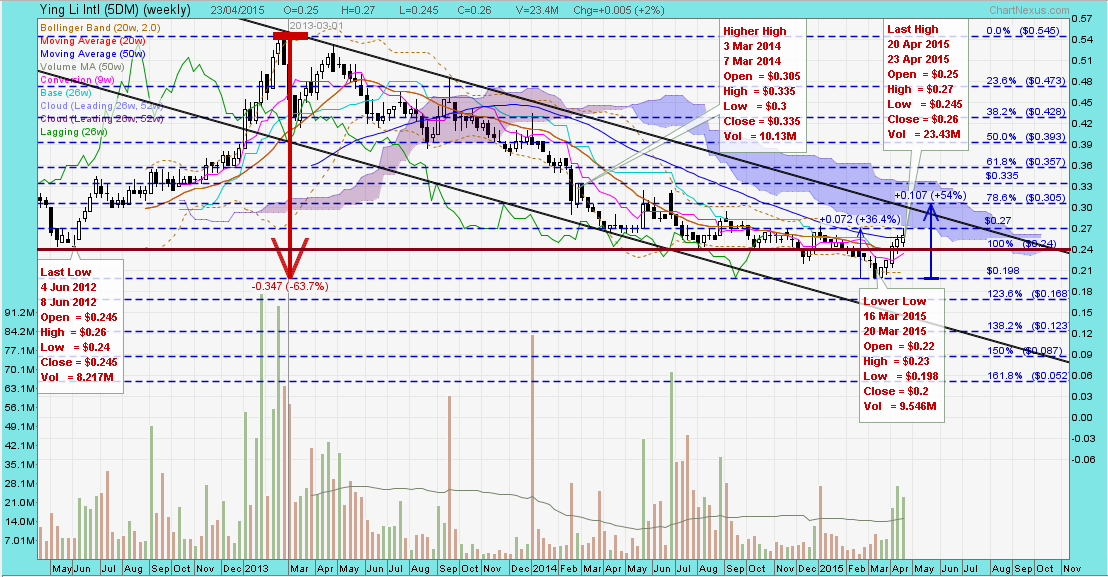 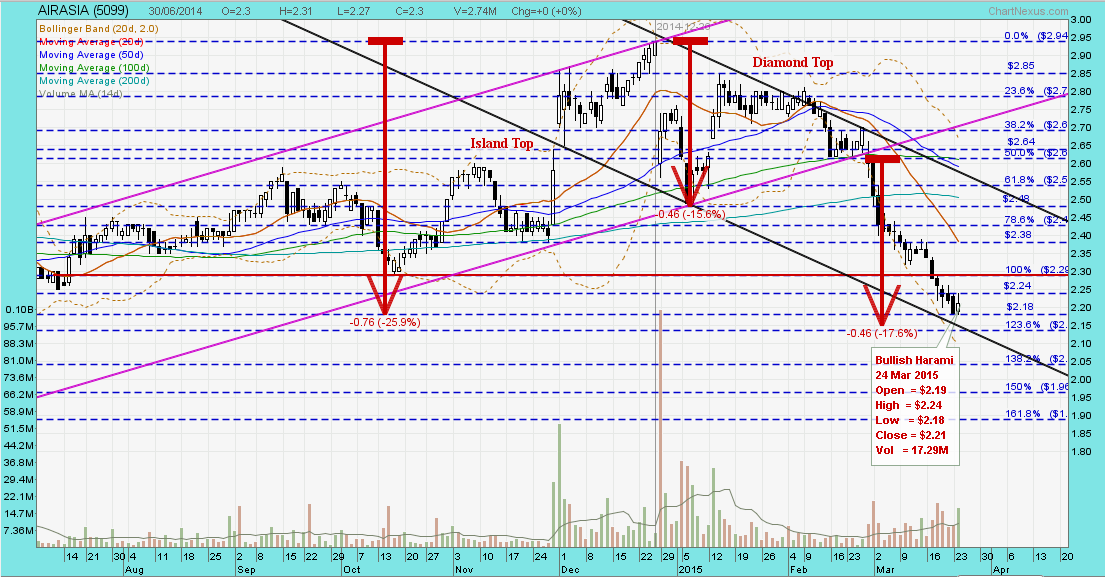
|
|
|
|
Post by zuolun on Apr 25, 2015 18:18:36 GMT 7
Meico and Evergreen: Chart Pattern ~ Riding on the impulsive Wave-3 up 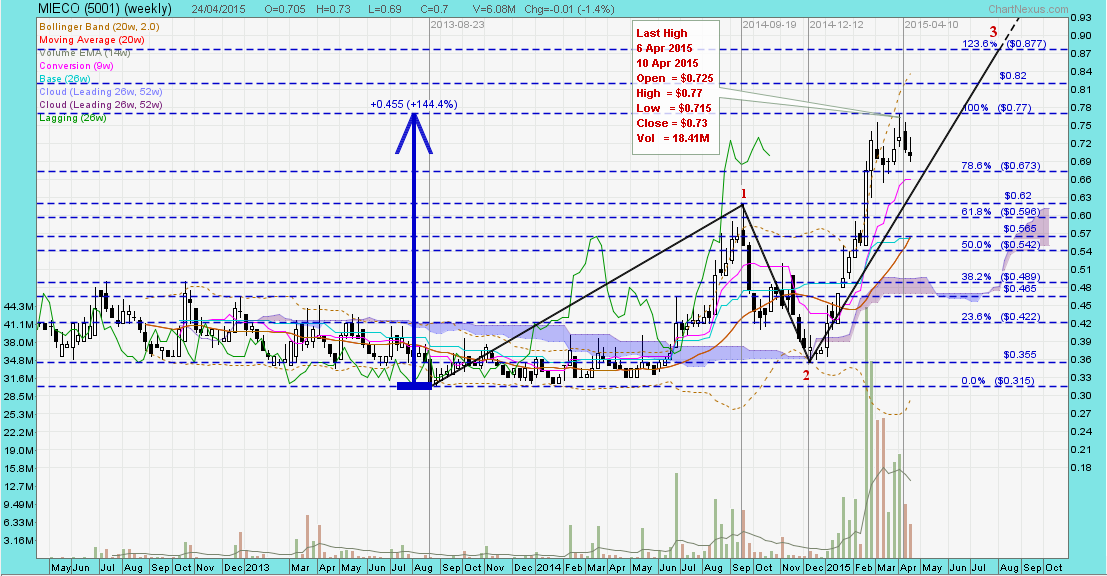 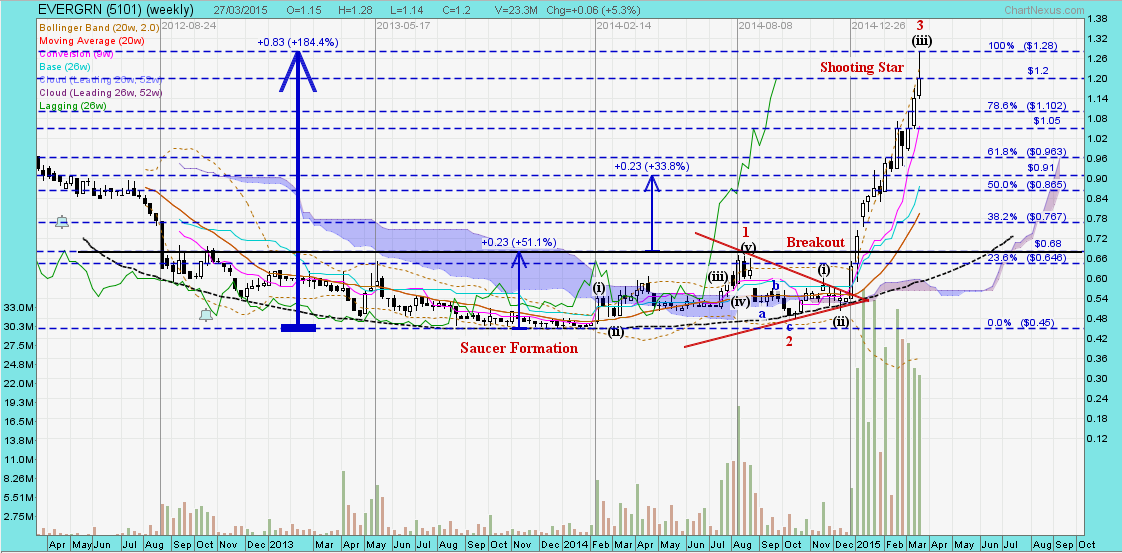
|
|
|
|
Post by zuolun on Apr 27, 2015 13:47:30 GMT 7
AURIC and Linc Energy: Chart Pattern ~ Riding on the corrective Wave-C down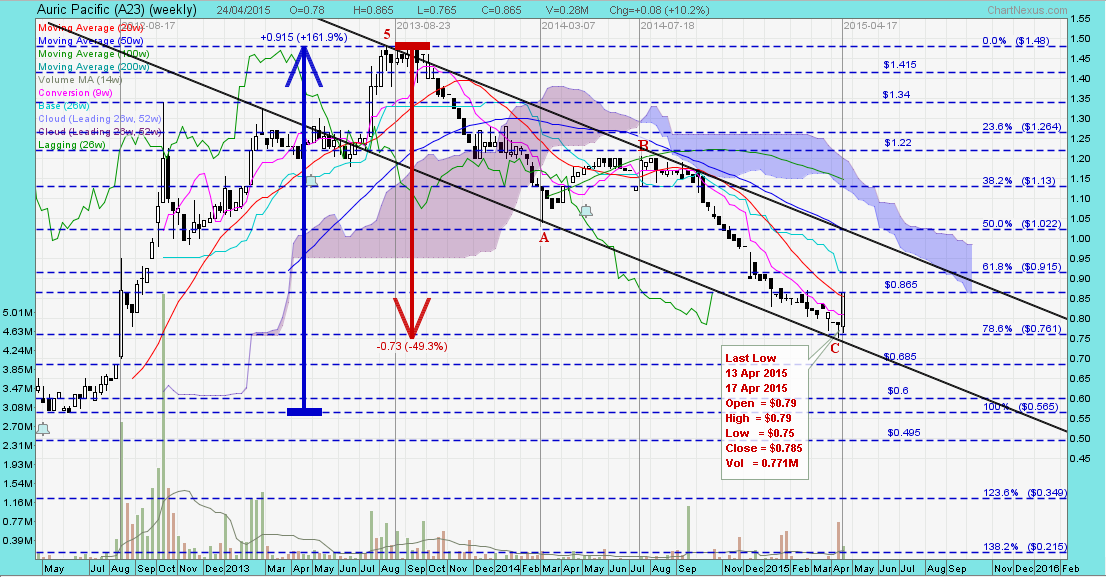 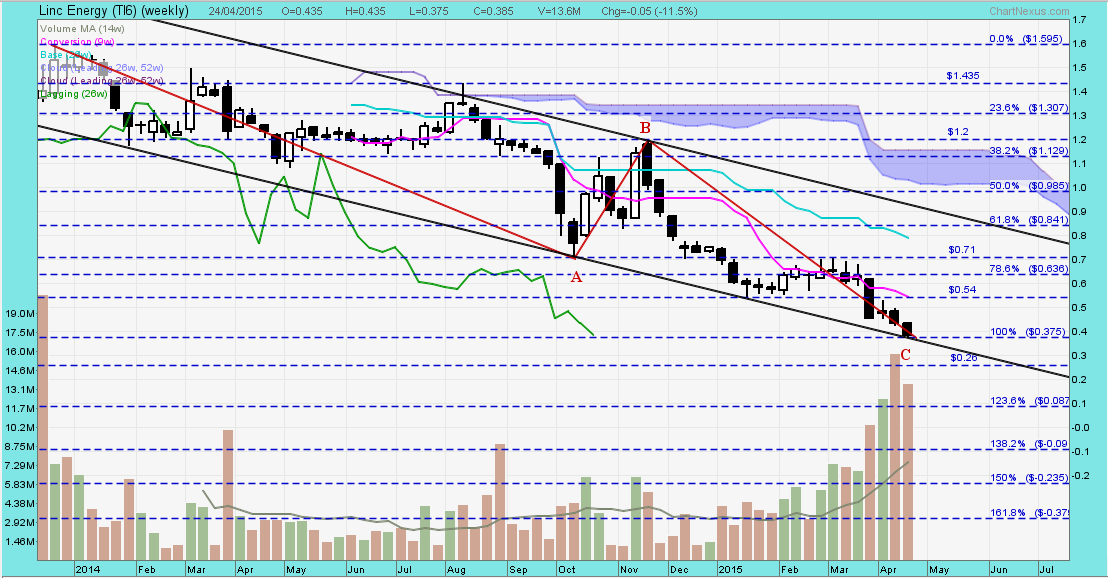
|
|
|
|
Post by zuolun on May 1, 2015 15:53:25 GMT 7
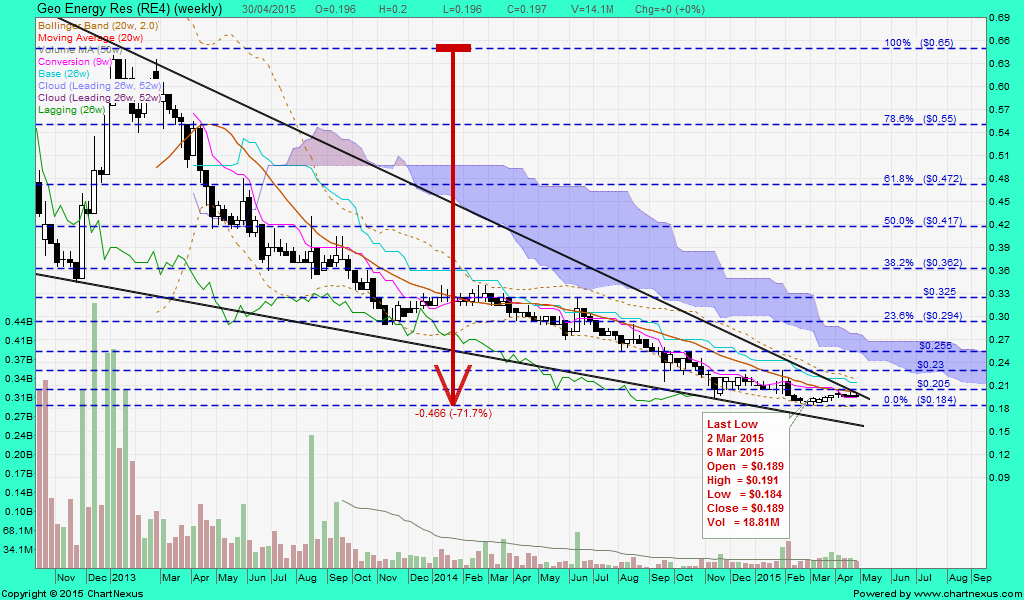
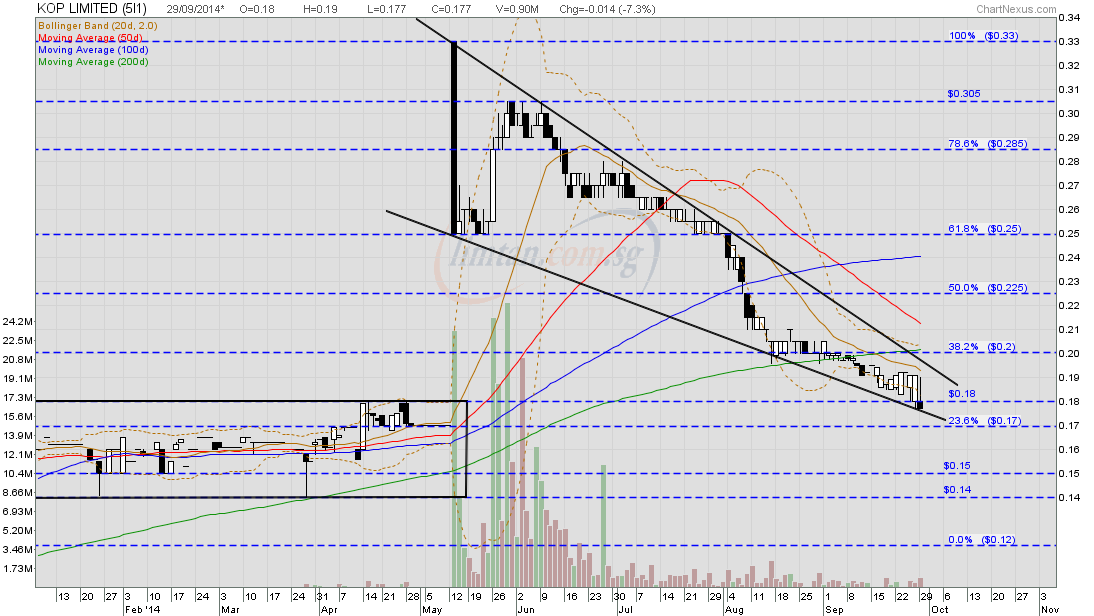
Stocks with falling wedge chart pattern are BAD = Buy And Die- GEO Energy
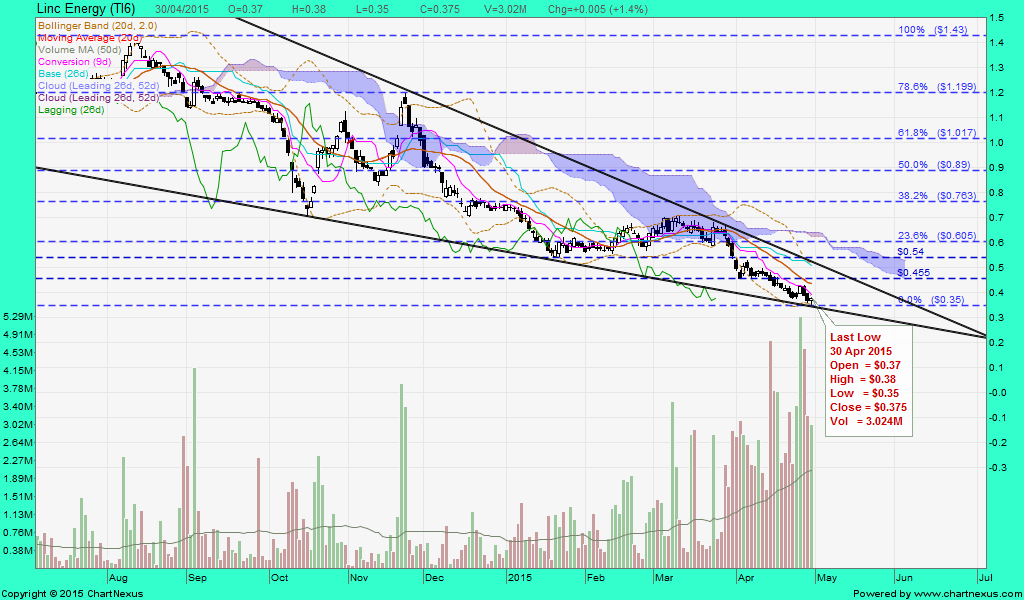
- Linc Energy
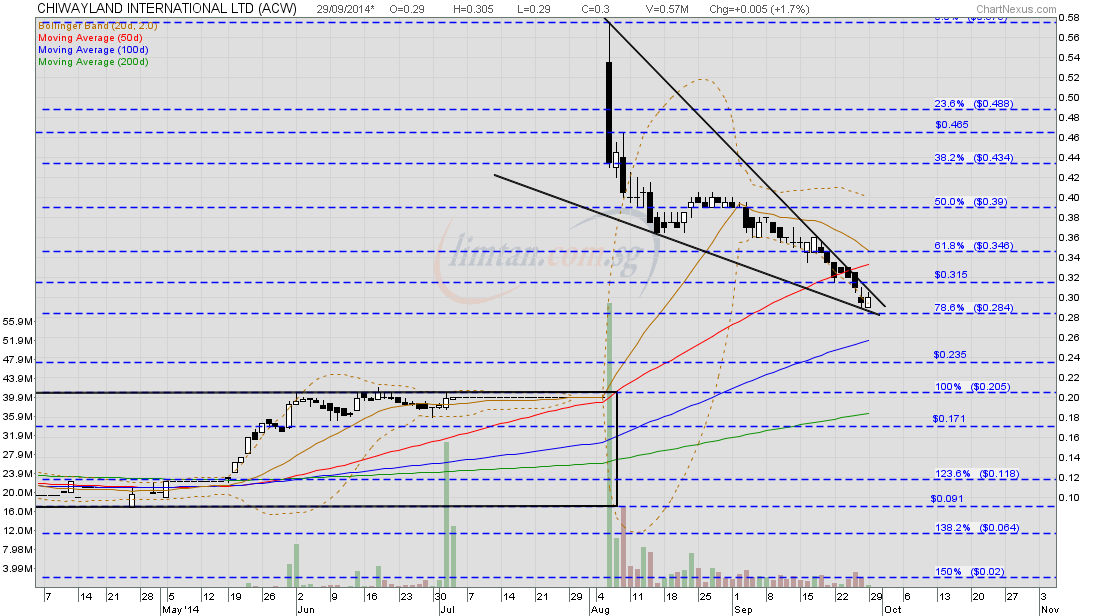
- CHIWAYLAND
- KOP
|
|
|
|
Post by zuolun on May 5, 2015 18:18:52 GMT 7
KepCorp and CIMB ~ Rising Wedge Chart Pattern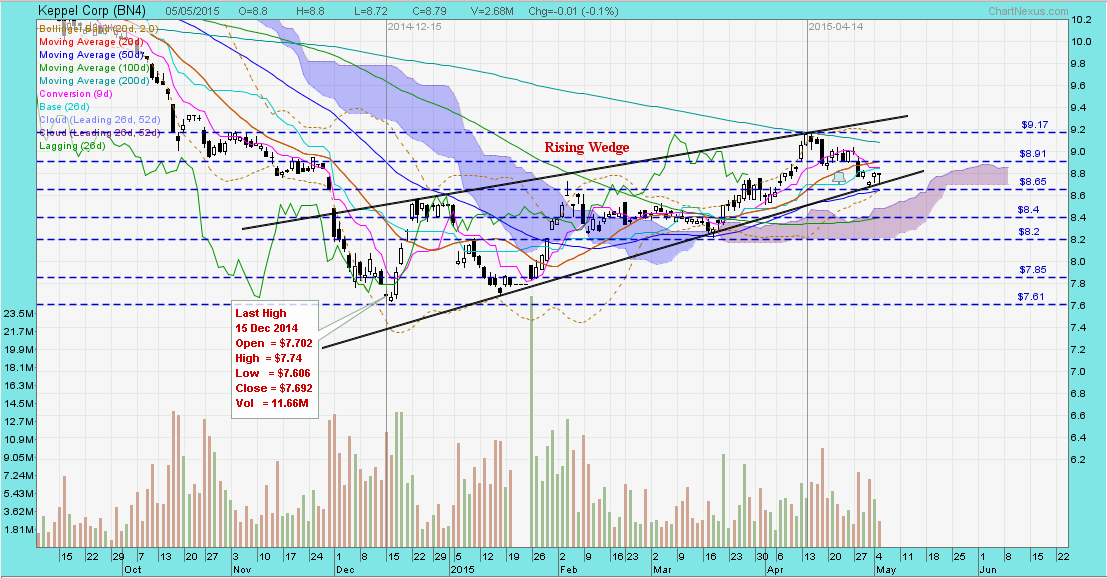 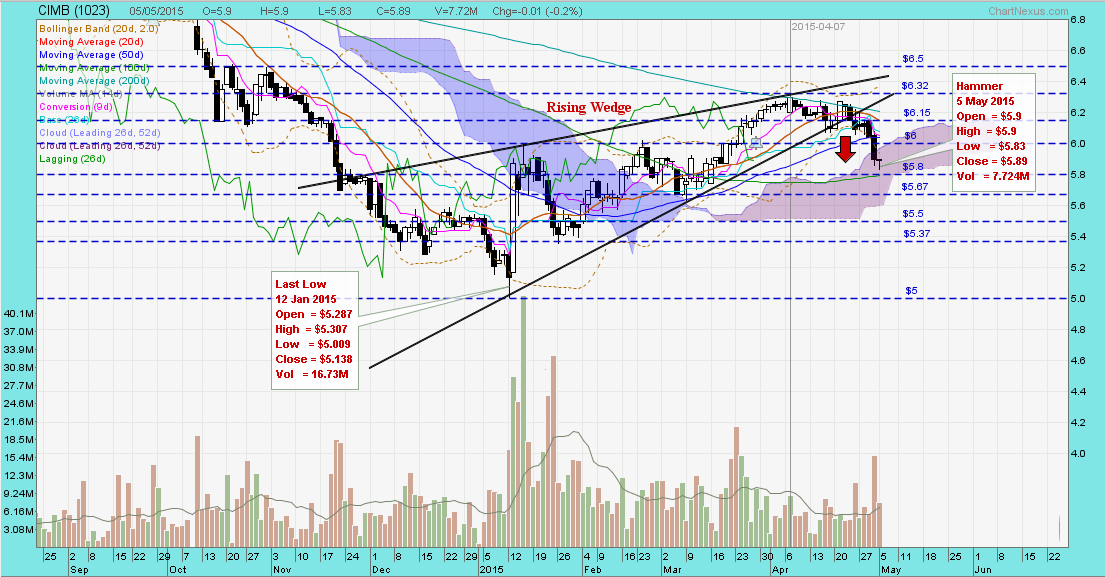
|
|
|
|
Post by zuolun on May 6, 2015 12:26:20 GMT 7
|
|
|
|
Post by zuolun on May 8, 2015 6:26:35 GMT 7
Linc Energy and POSH: Chart Pattern ~ Bearish bollinger bands breakout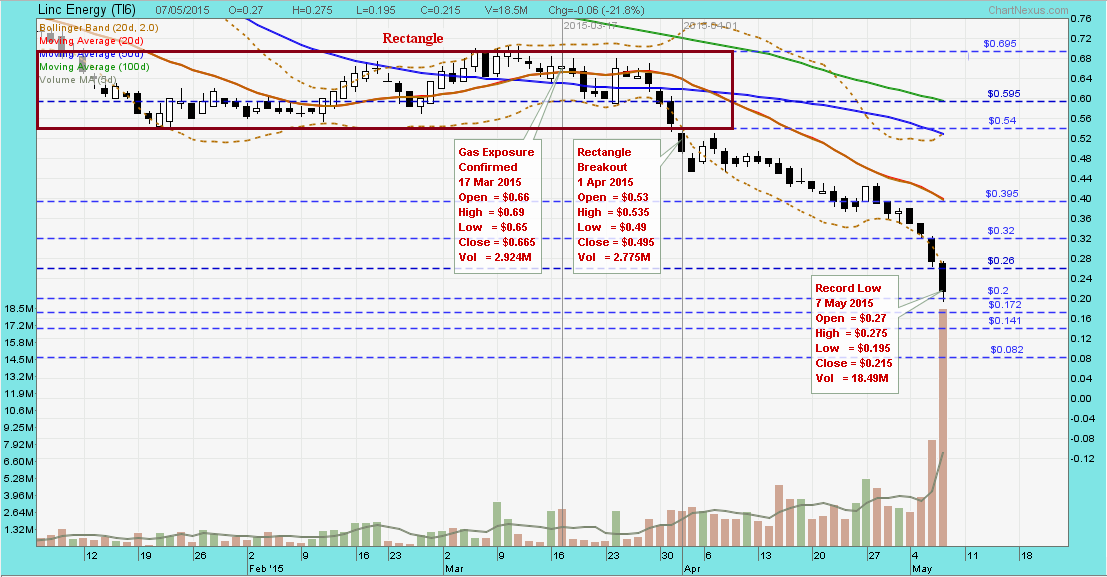 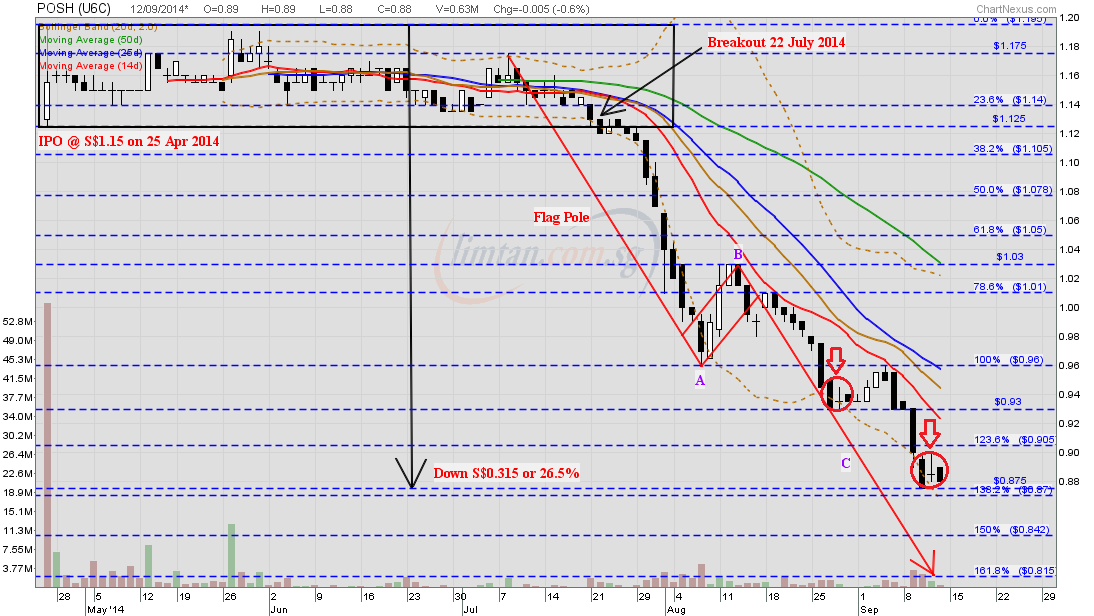
|
|
|
|
Post by zuolun on May 9, 2015 9:58:05 GMT 7
|
|
|
|
Post by zuolun on May 11, 2015 10:09:40 GMT 7
|
|
|
|
Post by zuolun on May 13, 2015 7:02:46 GMT 7
SembCorp and KepCorp: Chart Pattern ~ Bearish Gartley Pattern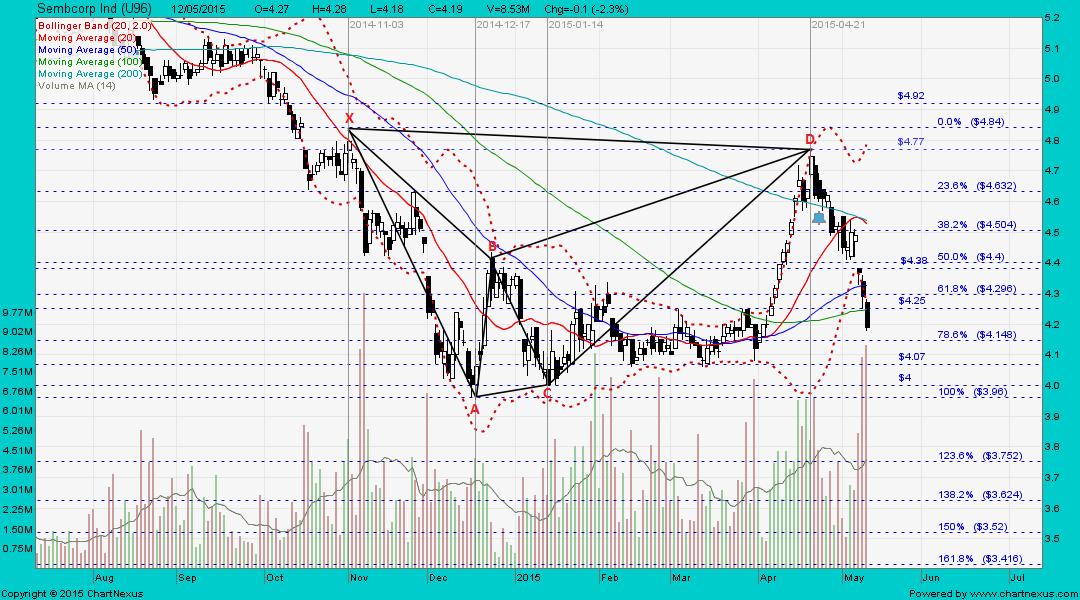 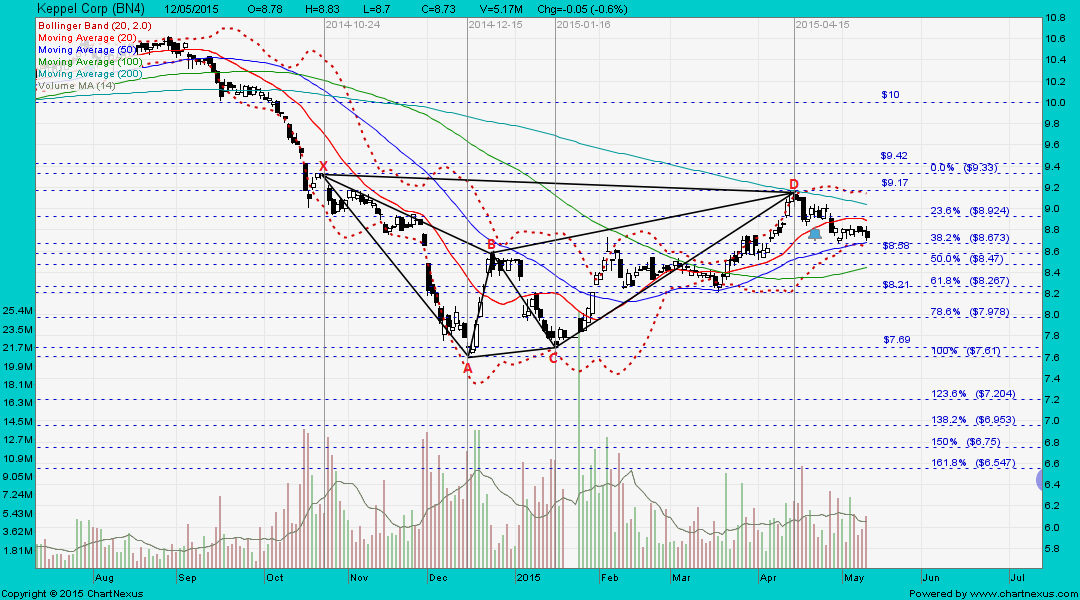
|
|
|
|
Post by zuolun on May 14, 2015 16:20:57 GMT 7
CitySpring and TOPGLOV: Uptrend with Bullish Bollinger Bands = FATA or 发达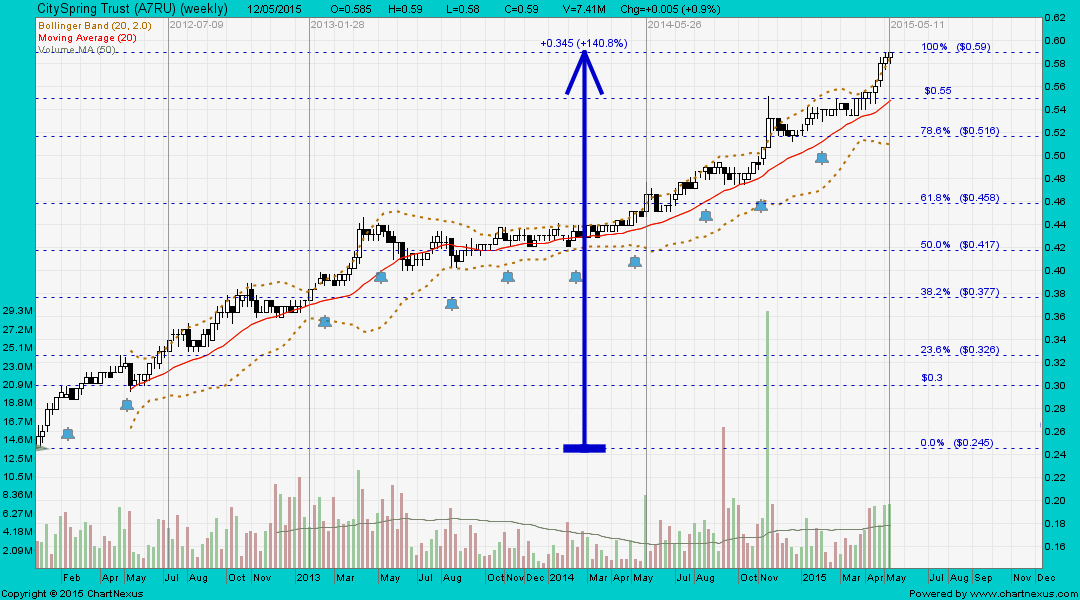 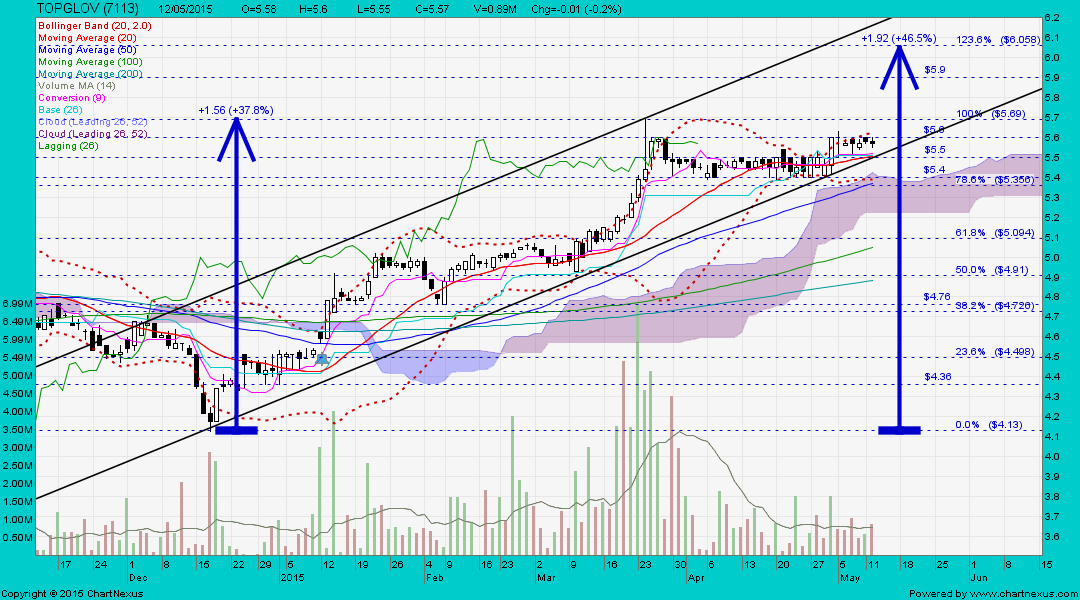 Noble, ValueMax, AAX, Mirach Ener, MTQ, QT Vascular and Linc Energy: Downtrend with Bearish Bollinger Bands = BAD or Buy And Die Noble, ValueMax, AAX, Mirach Ener, MTQ, QT Vascular and Linc Energy: Downtrend with Bearish Bollinger Bands = BAD or Buy And Die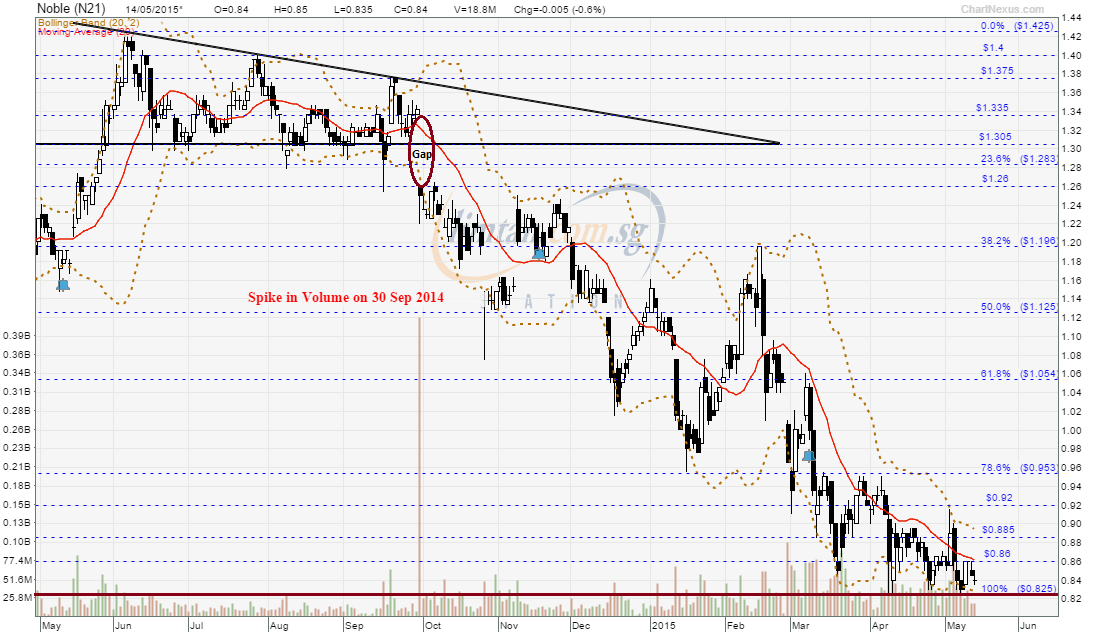 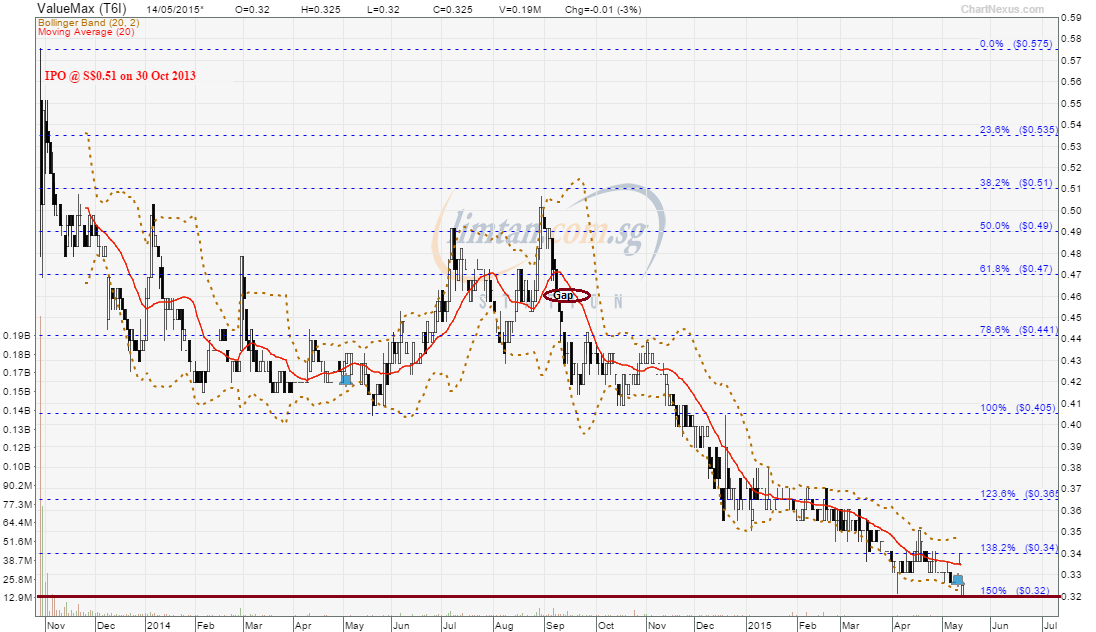 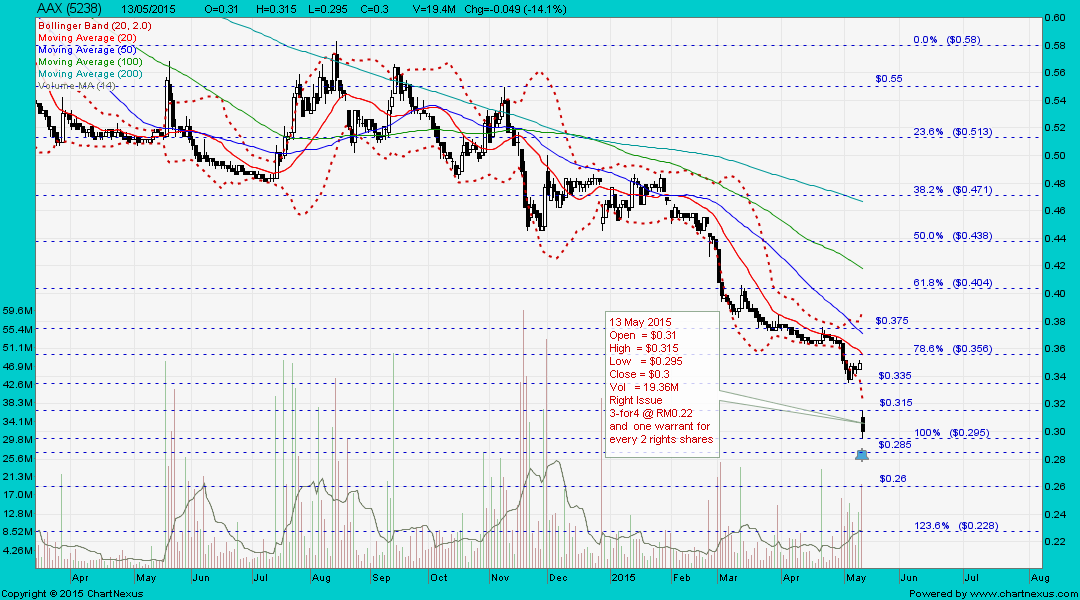 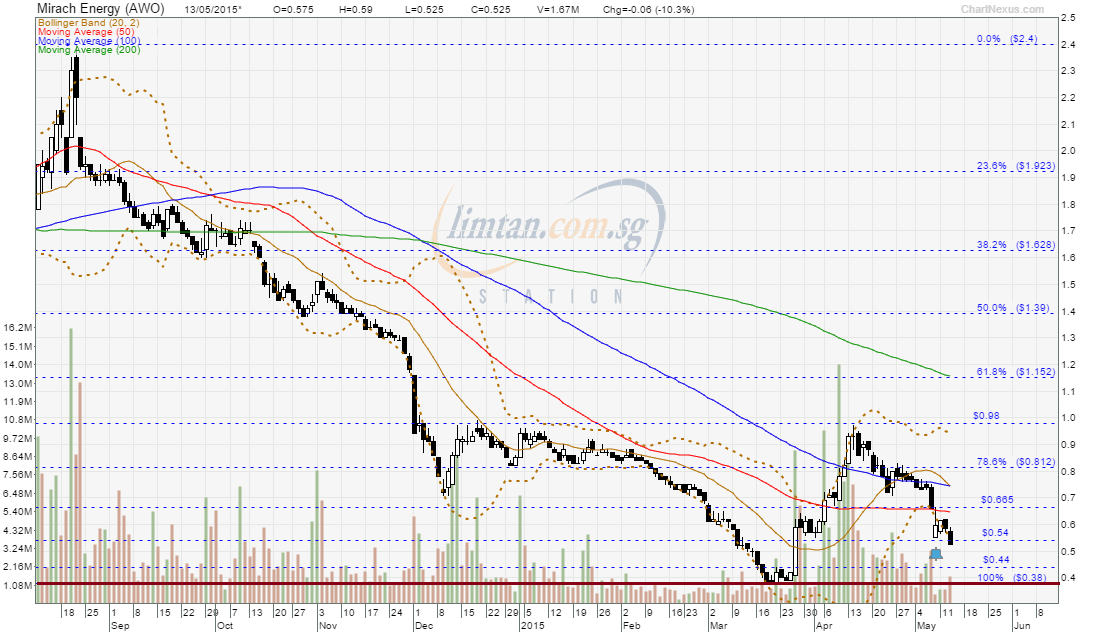 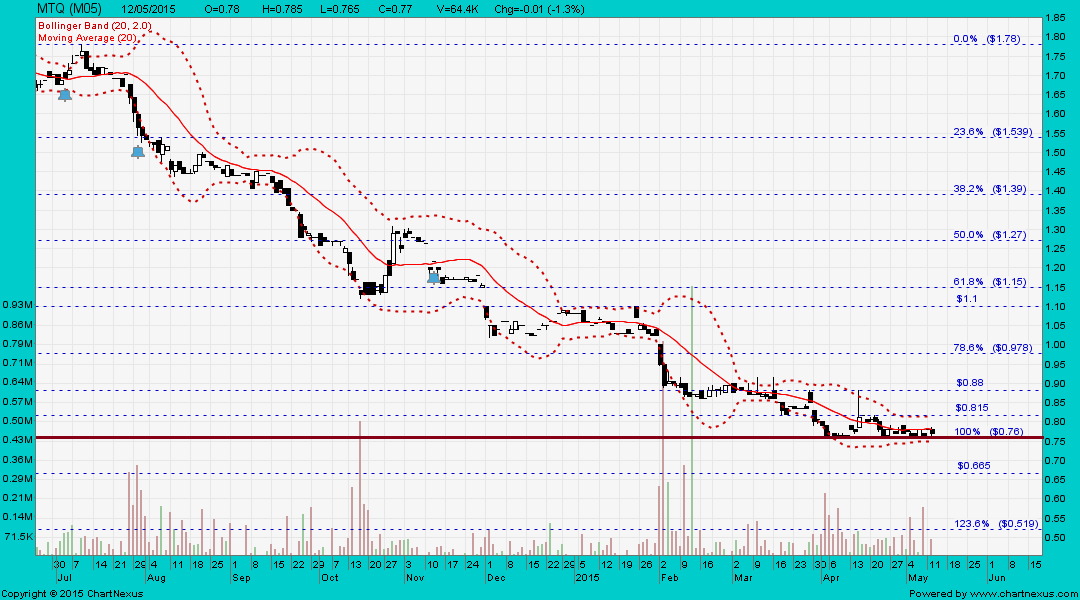 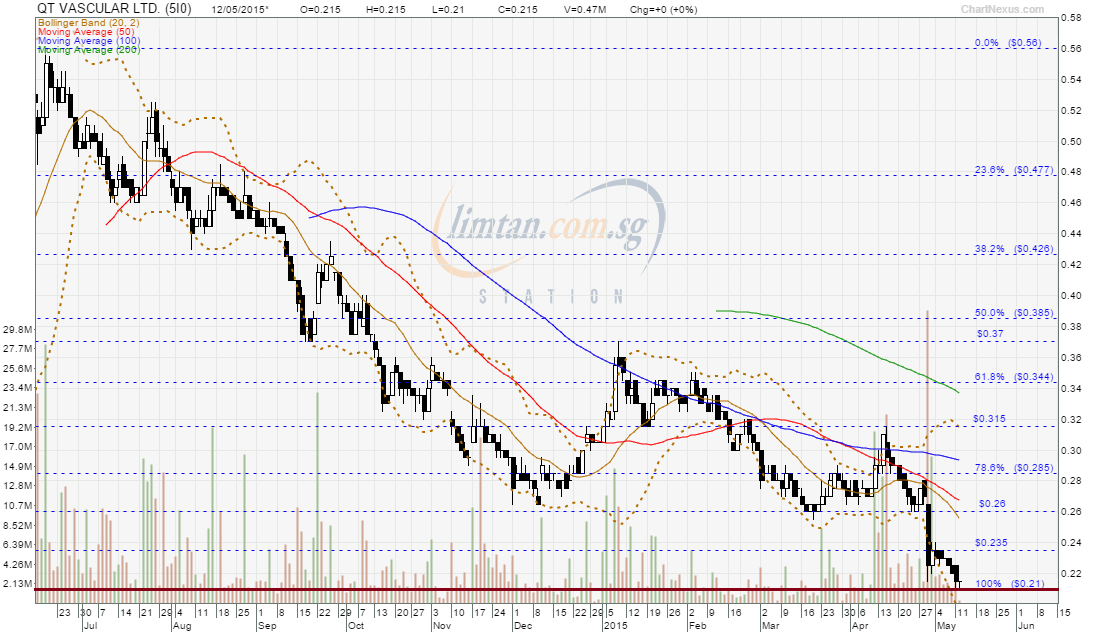 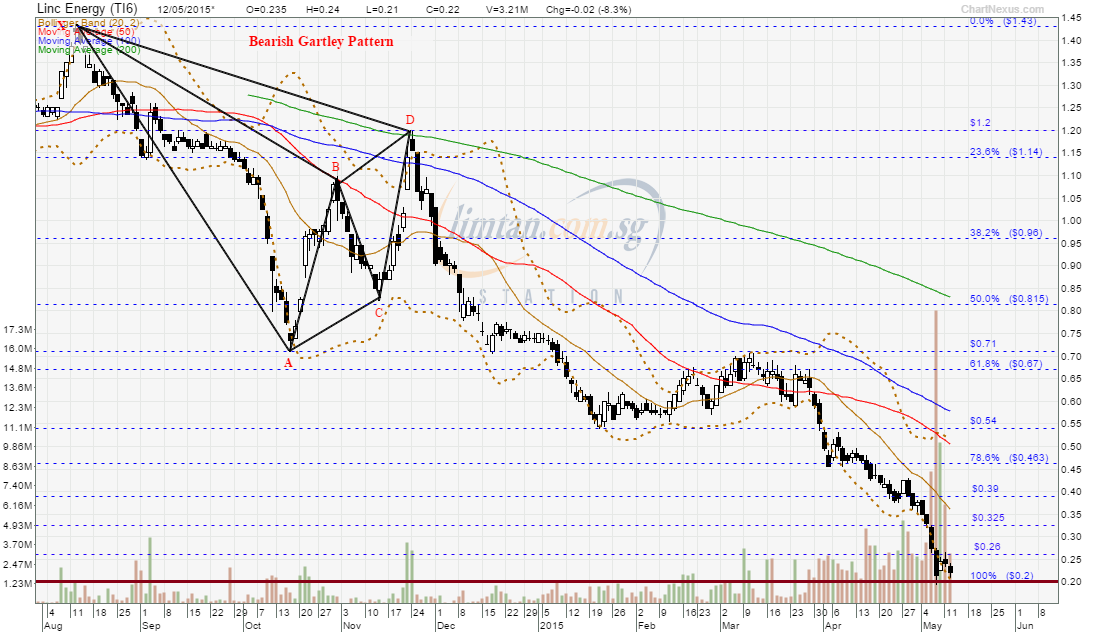
|
|
|
|
Post by zuolun on May 16, 2015 10:28:34 GMT 7
sptl123, NOL's share price didn't hit the est. TP at point D @ S$1.255 (see NOL's Gartley AB = CD chart dated 30 Apr 2015) but had peaked @ S$1.20 and had backed down 9.6% trading below the 20d SMA due to NOL's earnings reported as loss instead of profit. The 'buy on dip' should be put on HOLD because NOL is a longterm downtrend stock. Using the The 20d and 200d SMA strategies to'buy on dip' are best applicable to stocks with the primary trend up. Using Fibonacci retracements, compare Civmec and NOL's chart pattern to see where the probable price movement of the latter. Civmec and NOL ~ Bearish Gartley Breakout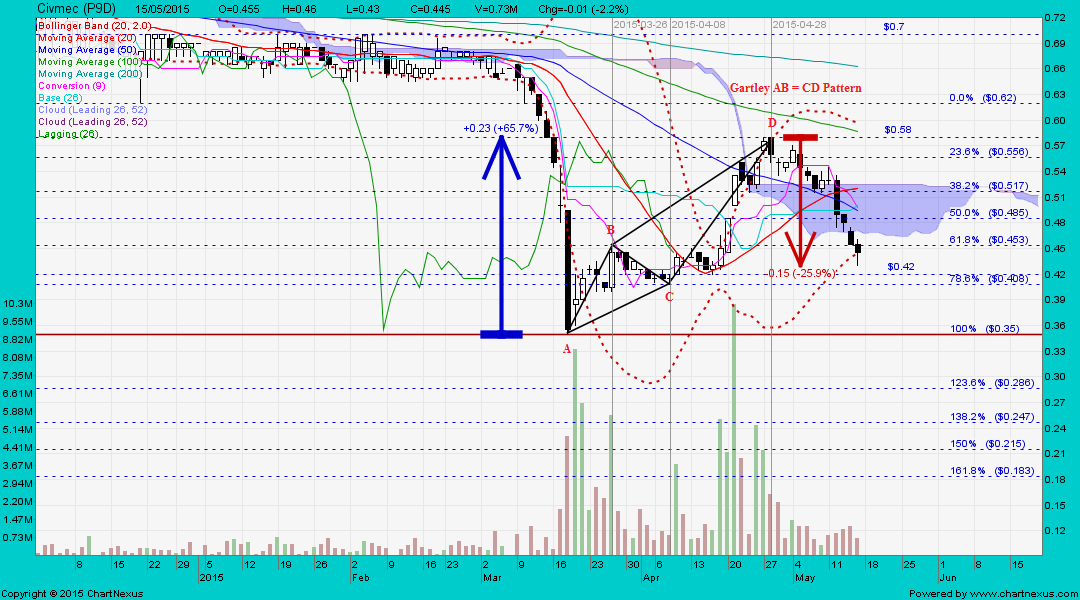 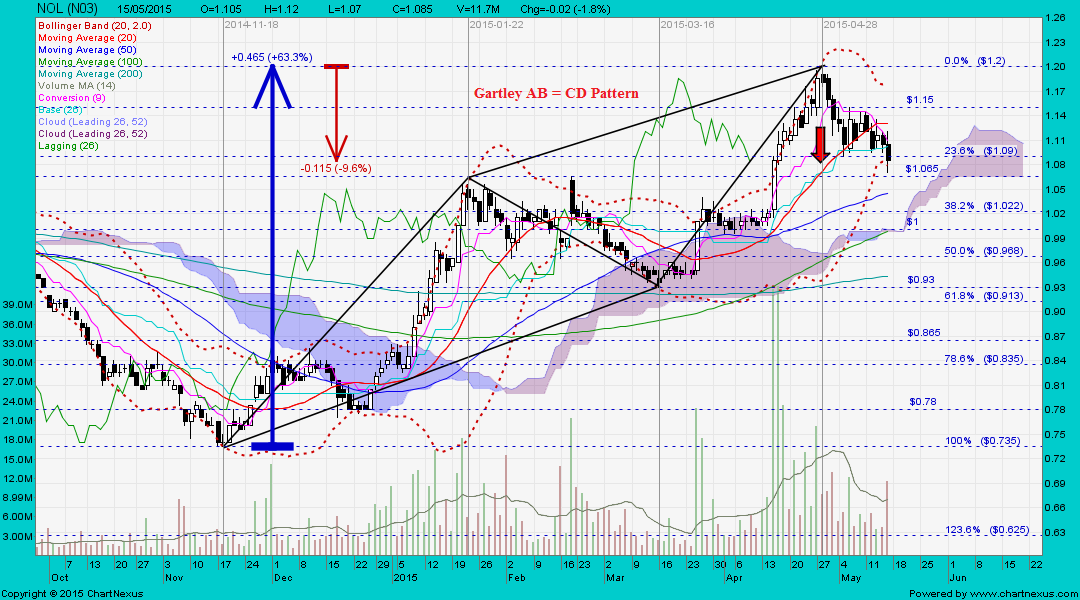 
|
|
|
|
Post by sptl123 on May 16, 2015 11:14:44 GMT 7
Thank you Bro Zuolun. Monday I run for my life liao.  Thank you for the detailed TA. Your passion for TA and selflessness to share is much appreciated and respected by many. I have been wondering : Zuolun= A person ? OR Zuolun= A team of Zuoluns.  Amazing, you are super fast ! Just today for the many posts you written, I probably take longer time to read them than the time you use to construct those posts . With my full respect. sptl123, NOL's share price didn't hit the est. TP at point D @ S$1.255 (see NOL's Gartley AB = CD chart dated 30 Apr 2015) but had peaked @ S$1.20 and had backed down 9.6% trading below the 20d SMA due to NOL's earnings reported as loss instead of profit. The 'buy on dip' should be put on HOLD because NOL is a longterm downtrend stock. Using the The 20d and 200d SMA strategies to'buy on dip' are best applicable to stocks with the primary trend up. Using Fibonacci retracements, compare Civmec and NOL's chart pattern to see where the probable price movement of the latter. Civmec and NOL ~ Bearish Gartley Breakout |
|


 Amazing, you are super fast !