|
|
Post by zuolun on Nov 21, 2015 13:35:24 GMT 7
SembMar, VARD and POSH: Chart Pattern ~ Trading in a downward sloping channel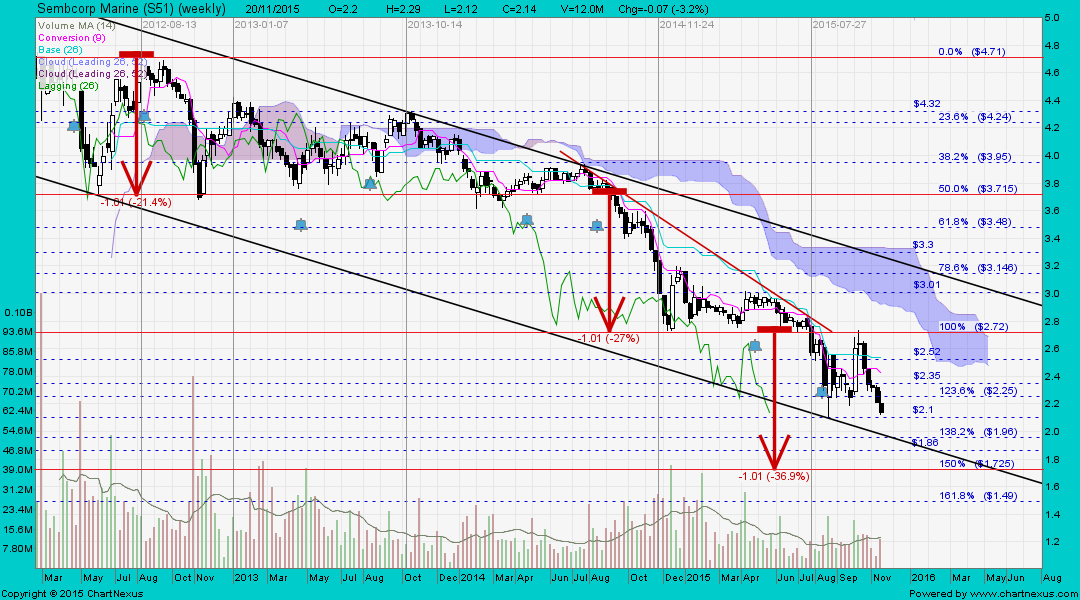  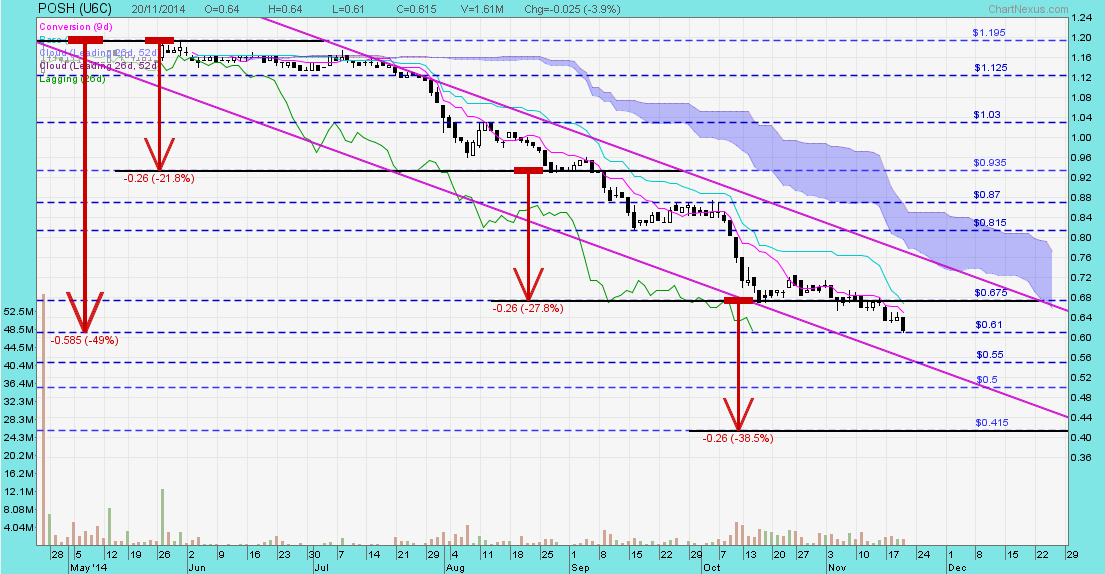
|
|
|
|
Post by zuolun on Dec 13, 2015 16:51:47 GMT 7
CSE Global and Swiber ~ Short term intermediate uptrend is broken, long term downtrend prevails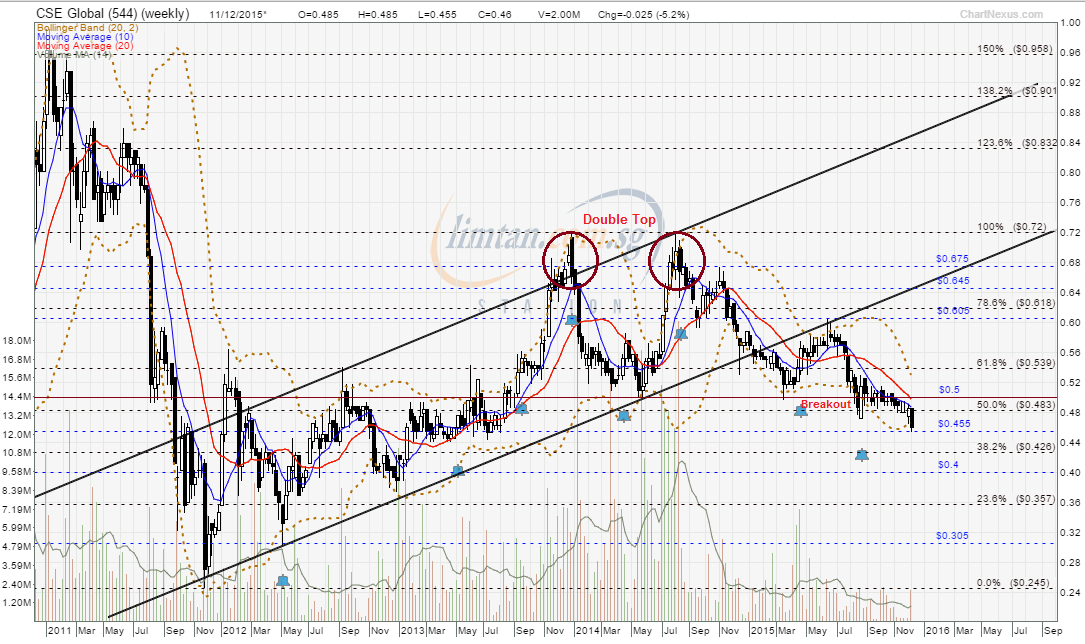 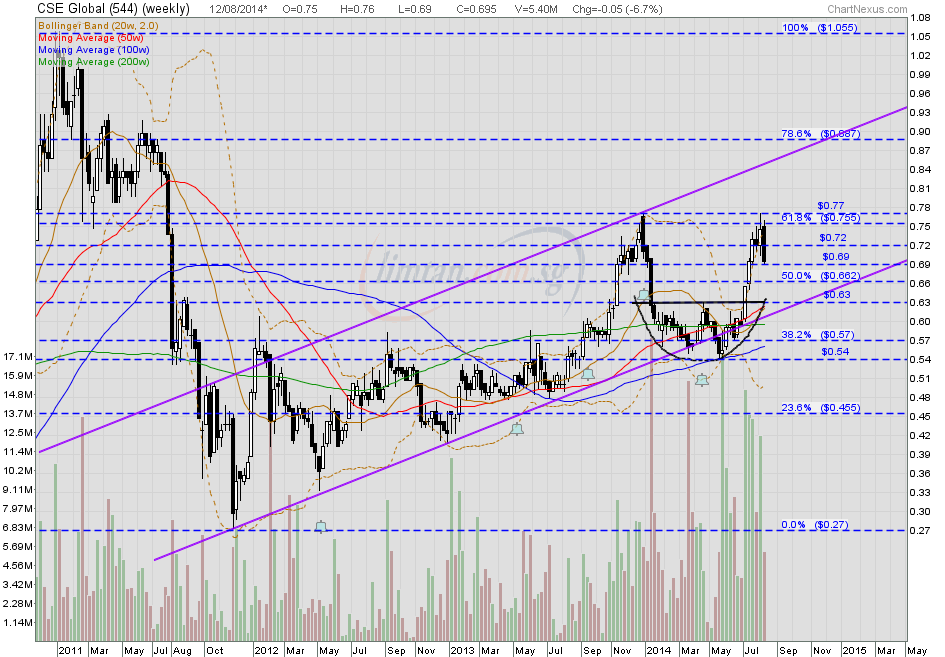 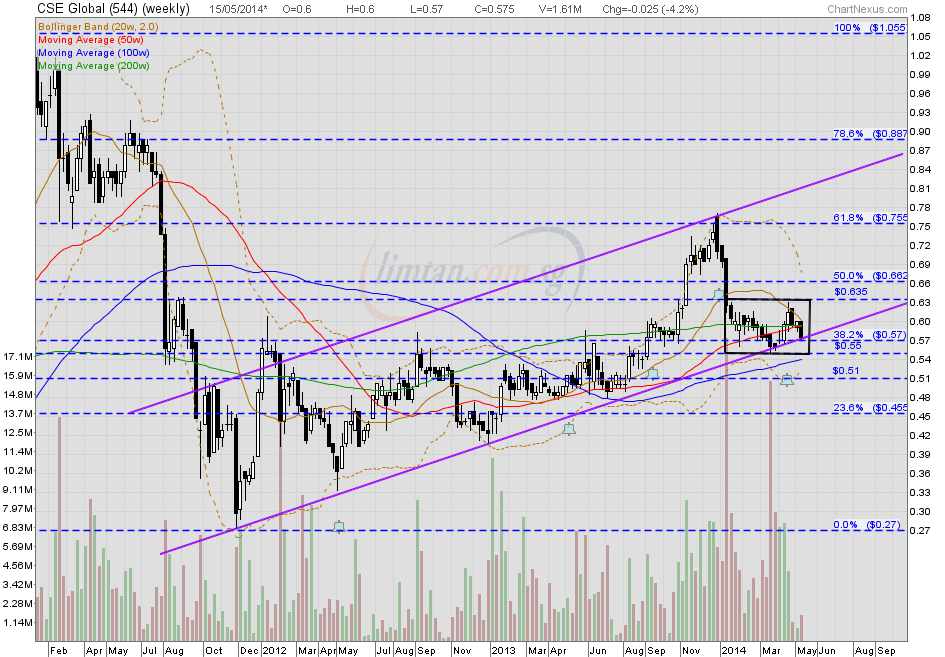 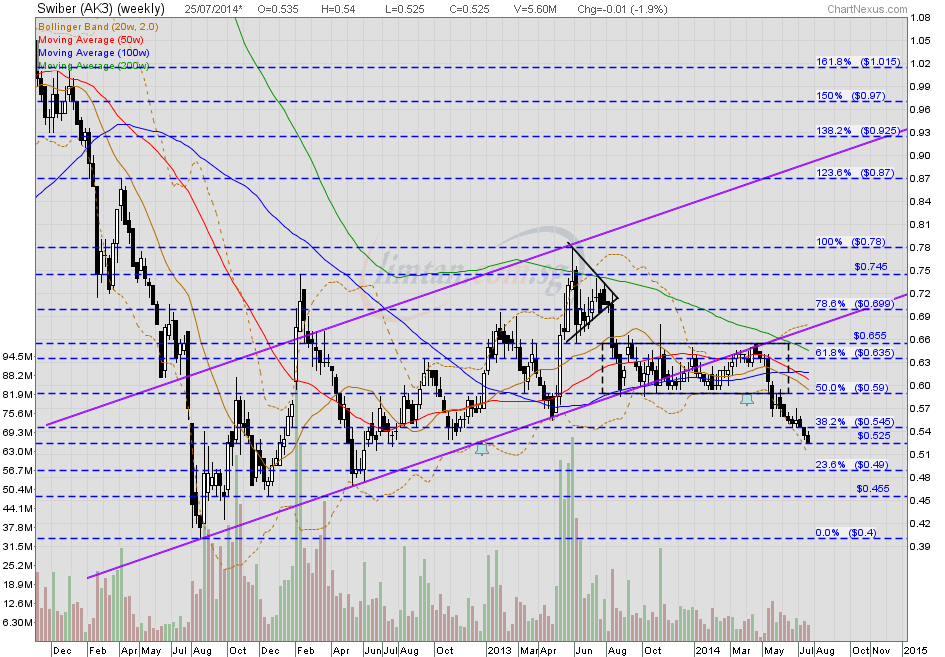
|
|
|
|
Post by zuolun on Dec 21, 2015 7:33:43 GMT 7
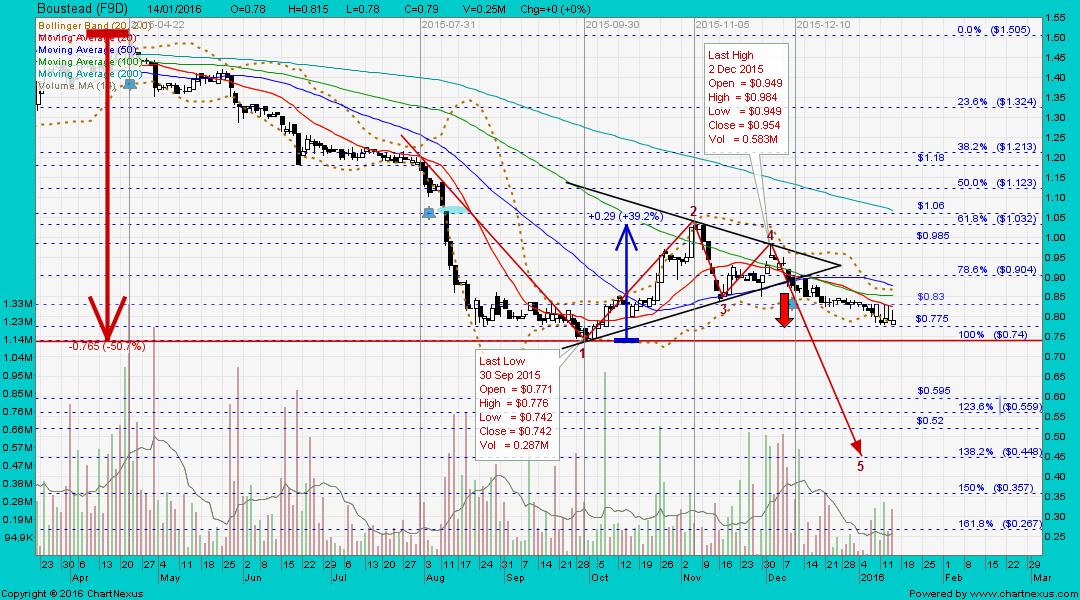
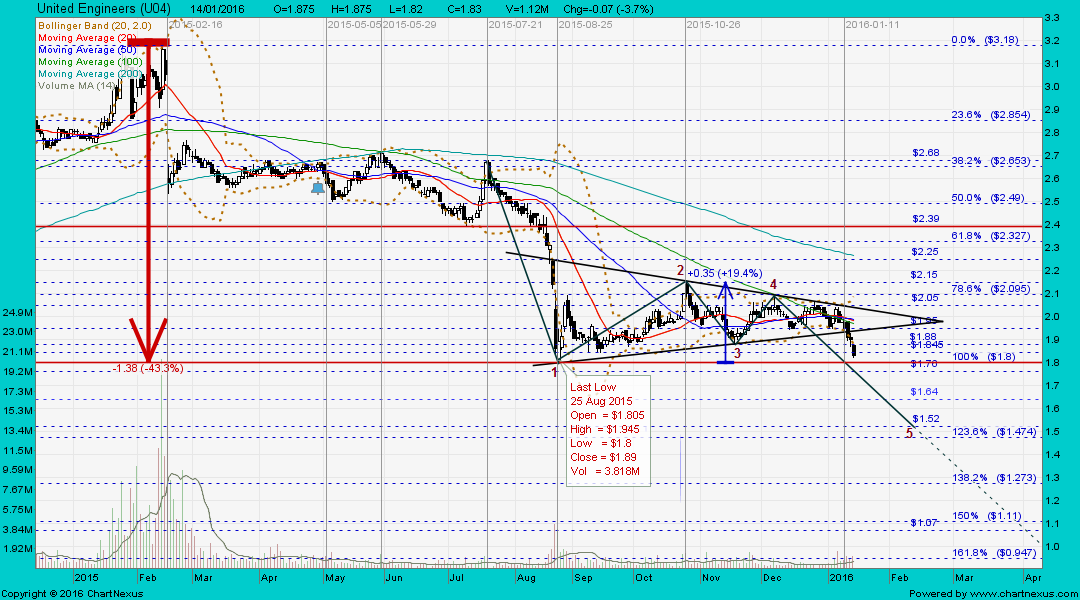
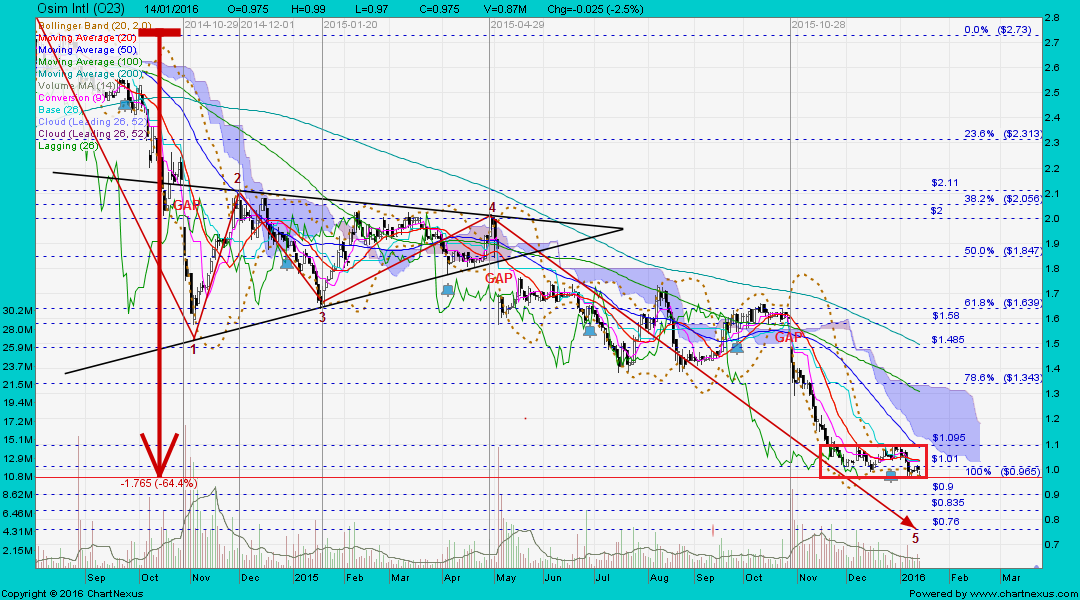
Boustead, UE and OSIM: Chart Pattern ~ Symmetrical Triangle, biased to the downside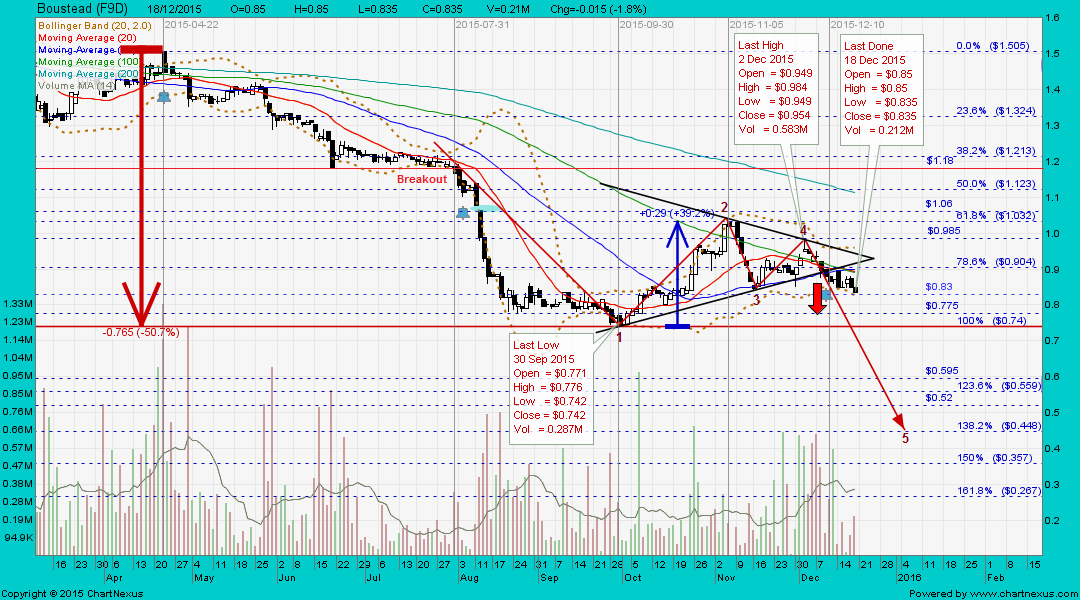 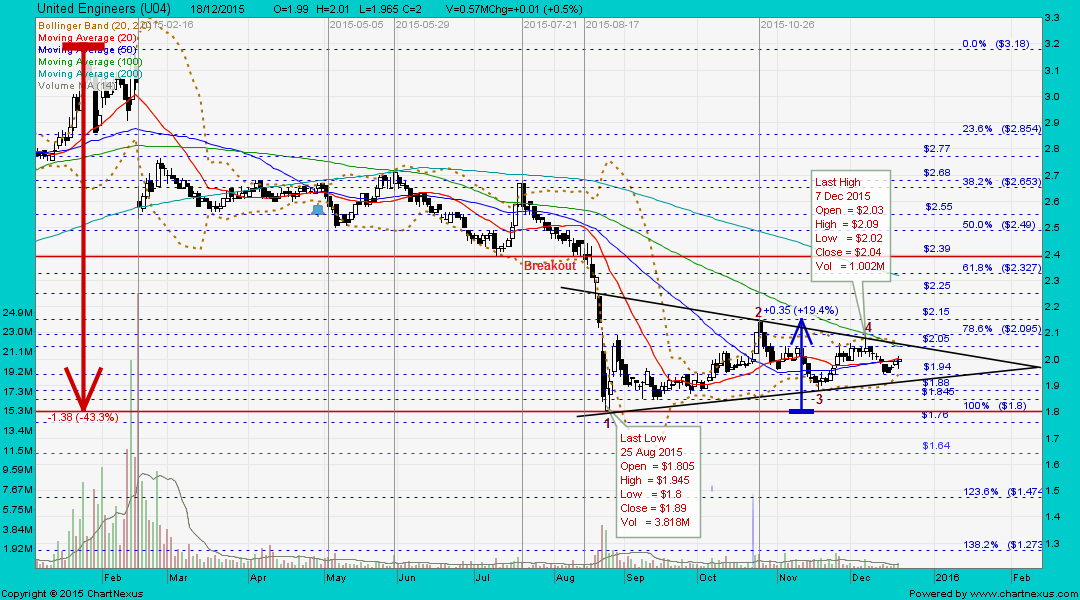 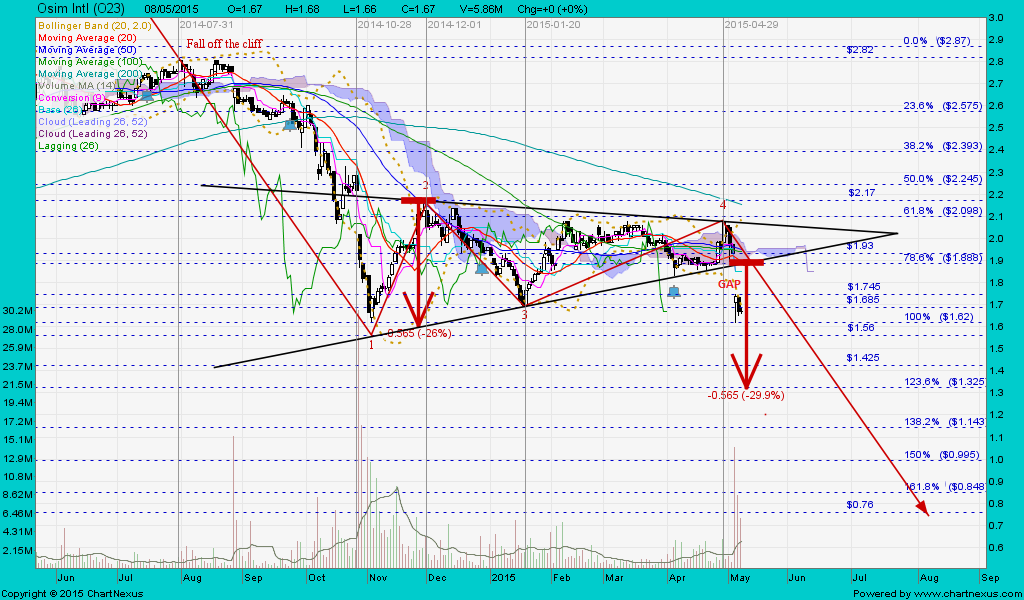
|
|
|
|
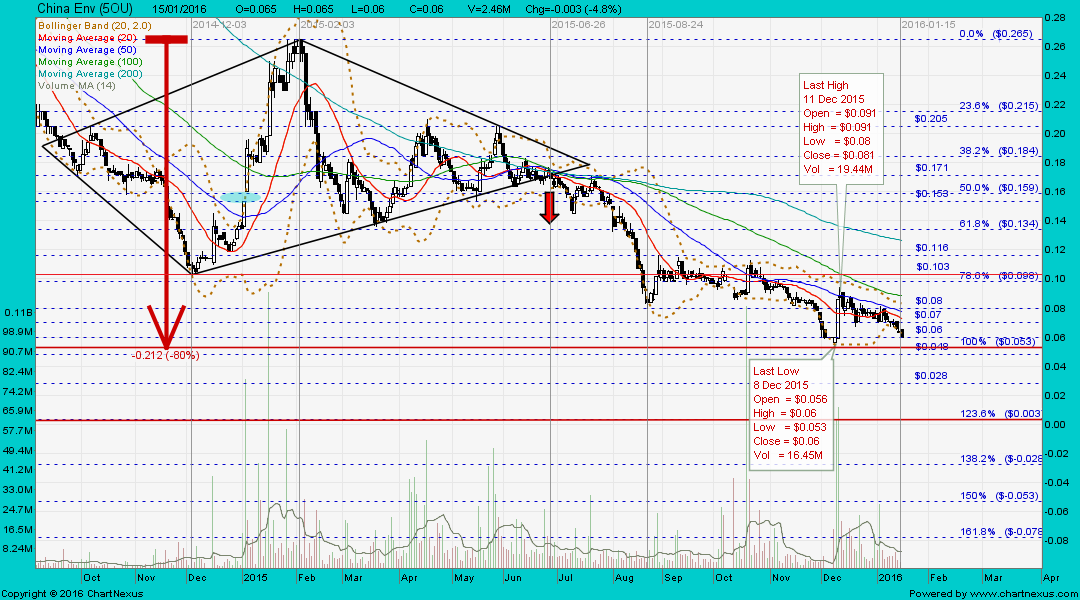
Post by zuolun on Dec 21, 2015 10:39:21 GMT 7
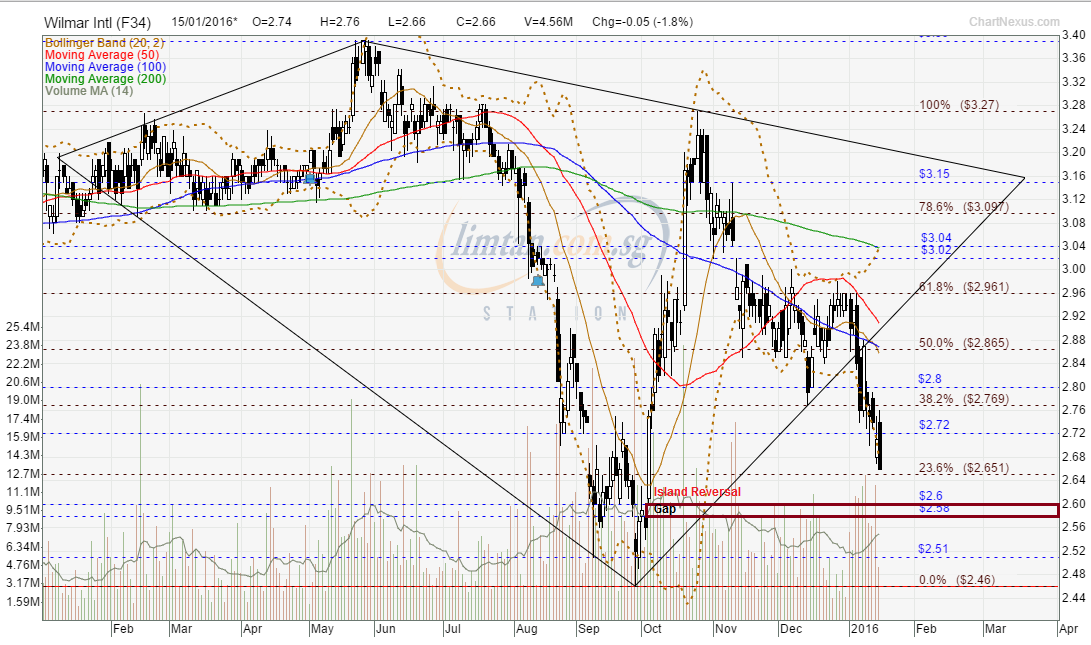
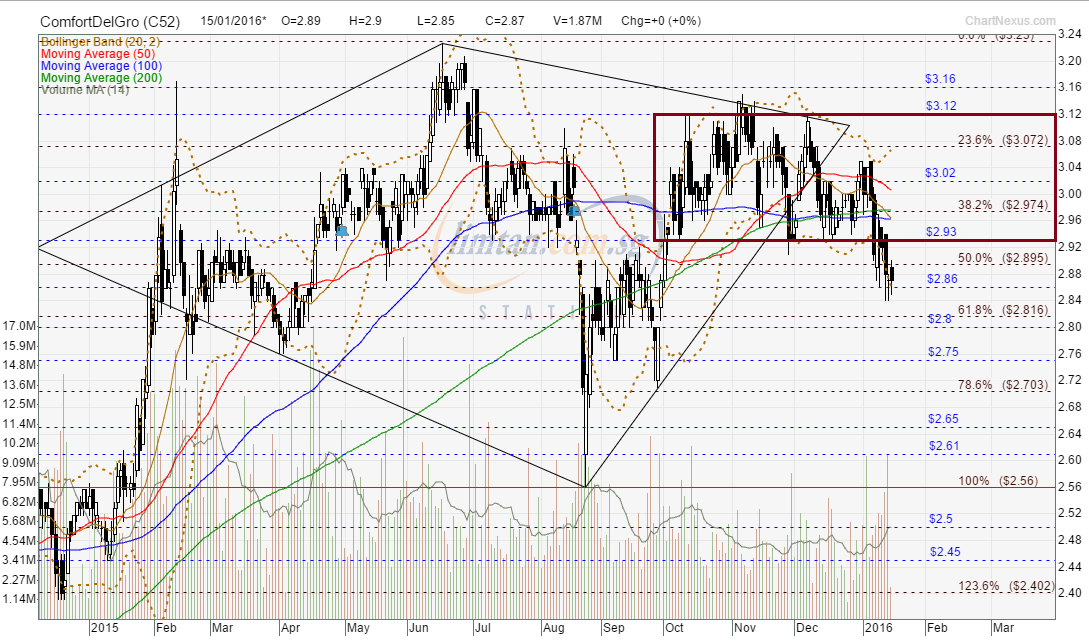
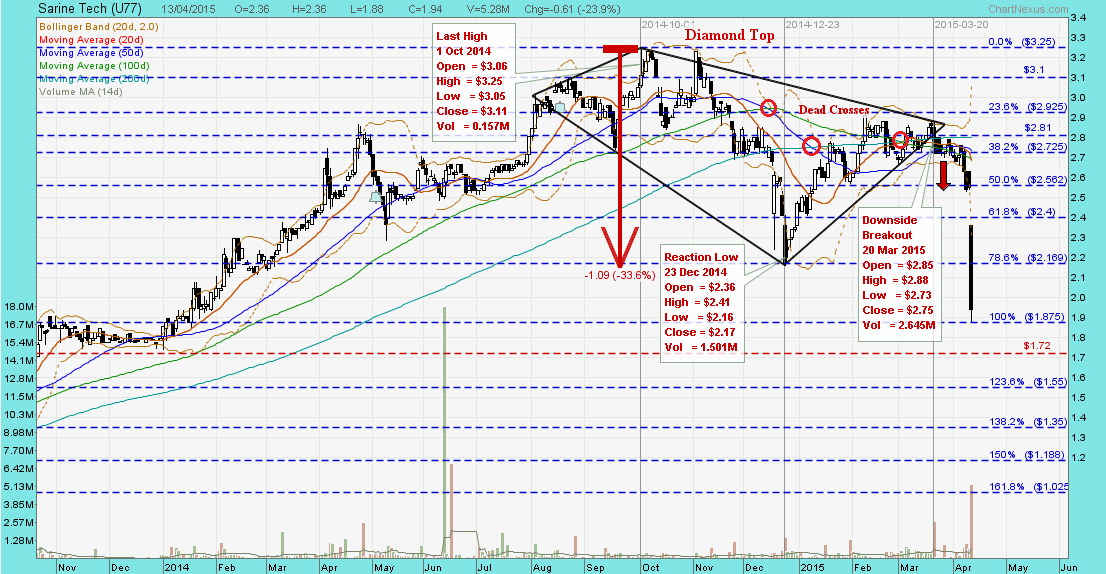
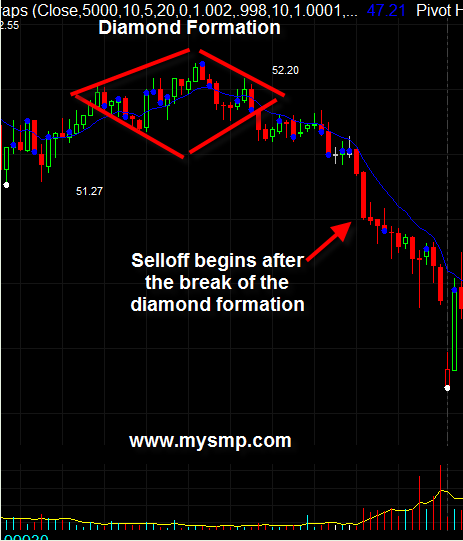
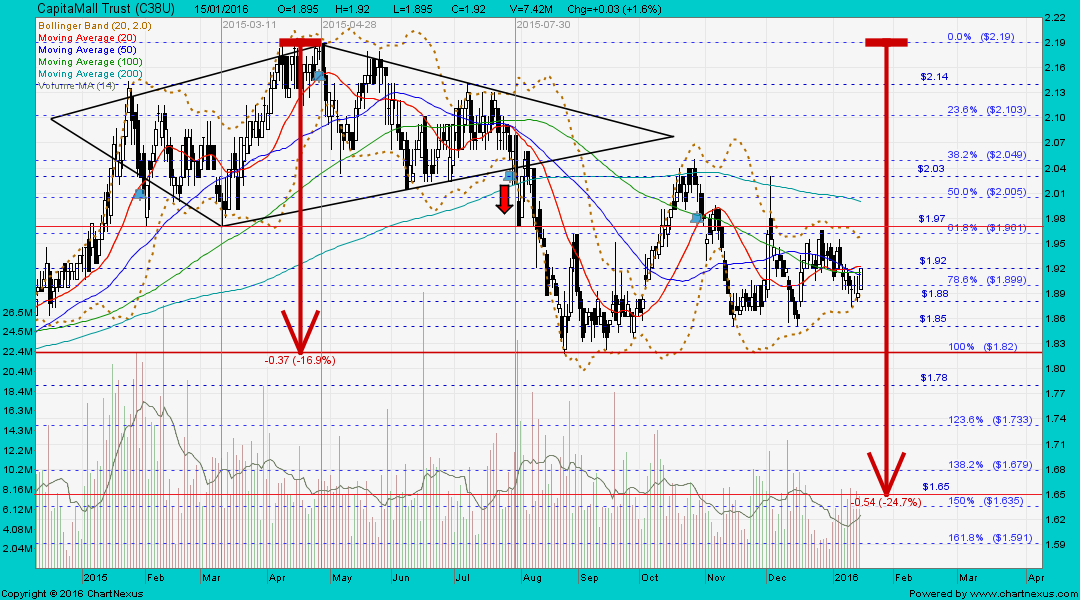
RMG and ComfortDelgro: Chart Pattern ~ Diamond Top, biased to the downside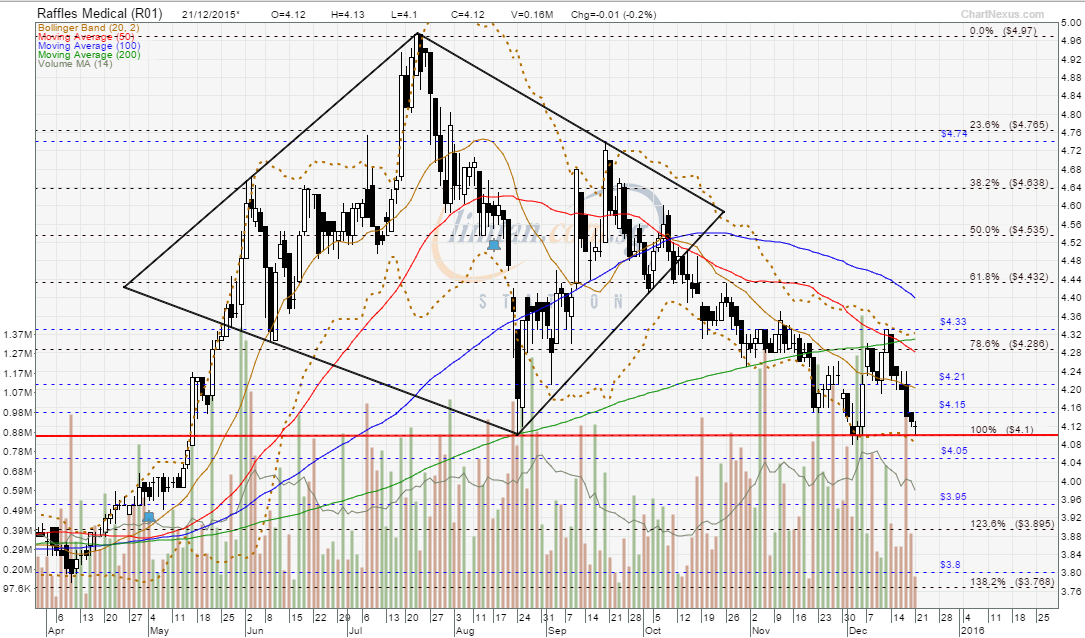 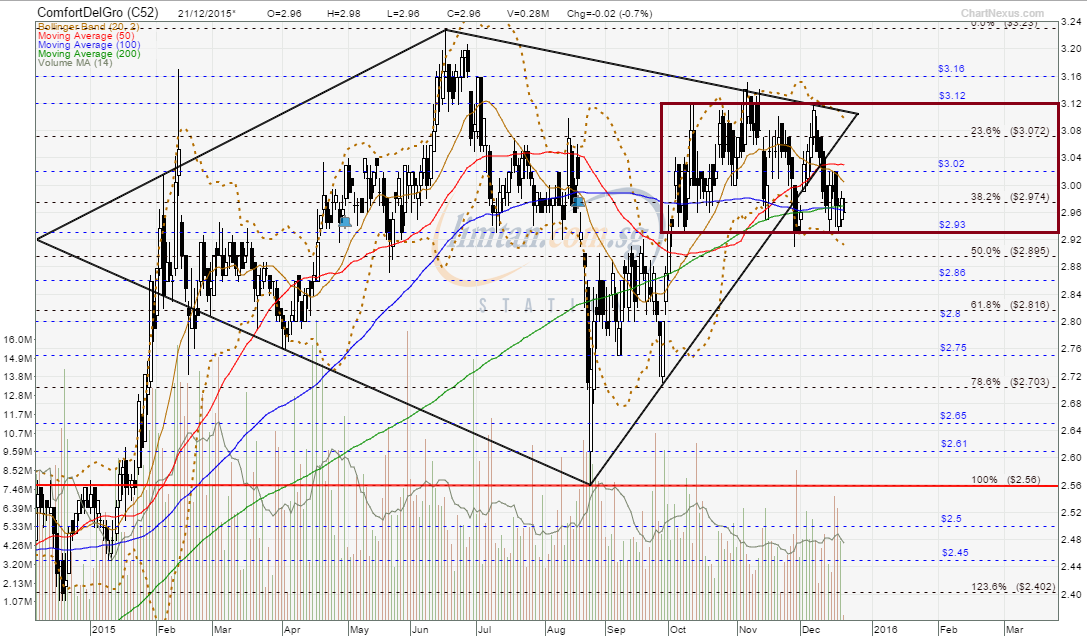
|
|
|
|
Post by zuolun on Jan 15, 2016 7:58:01 GMT 7
|
|
|
|
Post by zuolun on Jan 15, 2016 16:26:00 GMT 7
|
|
|
|
Post by zuolun on Jan 18, 2016 10:59:20 GMT 7
|
|
|
|
Post by zuolun on Jan 22, 2016 15:55:28 GMT 7
CM Pacific, CES, CCT and PREH: Chart Pattern ~ Trading in a downward sloping channel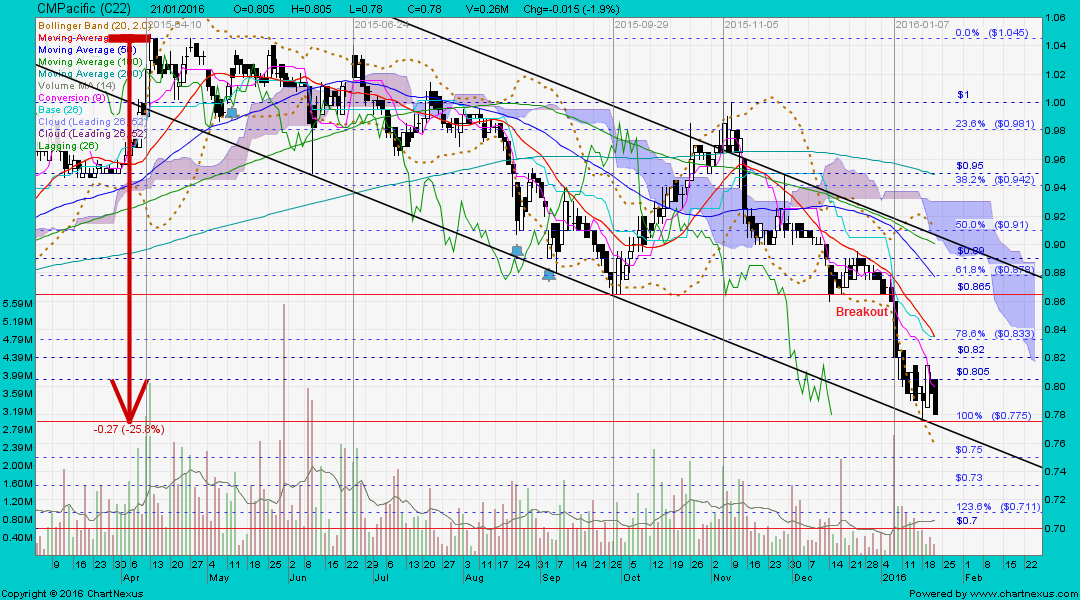 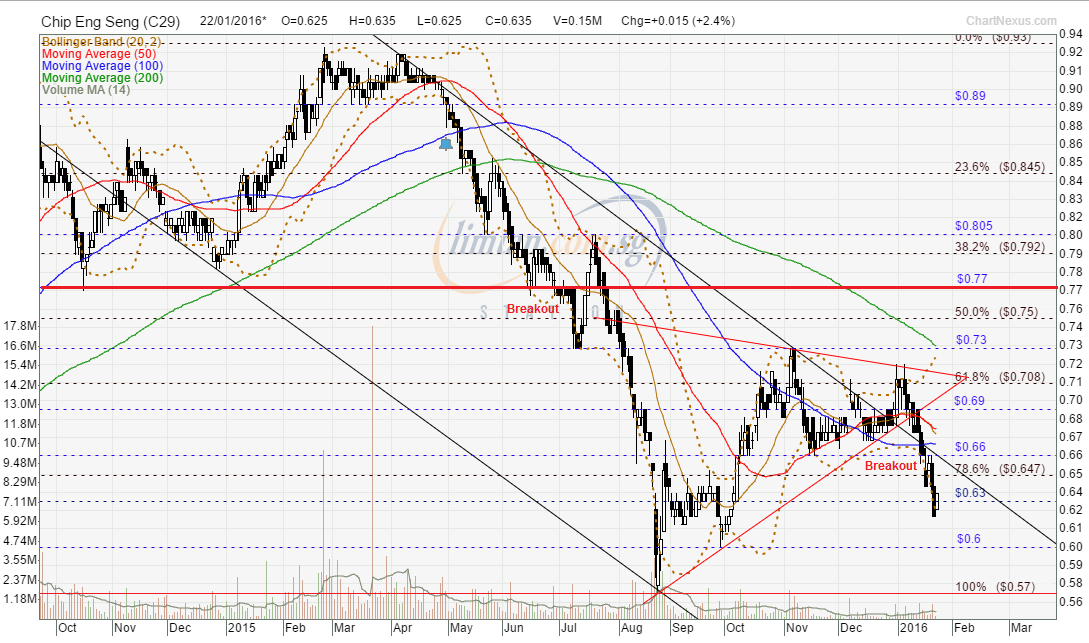 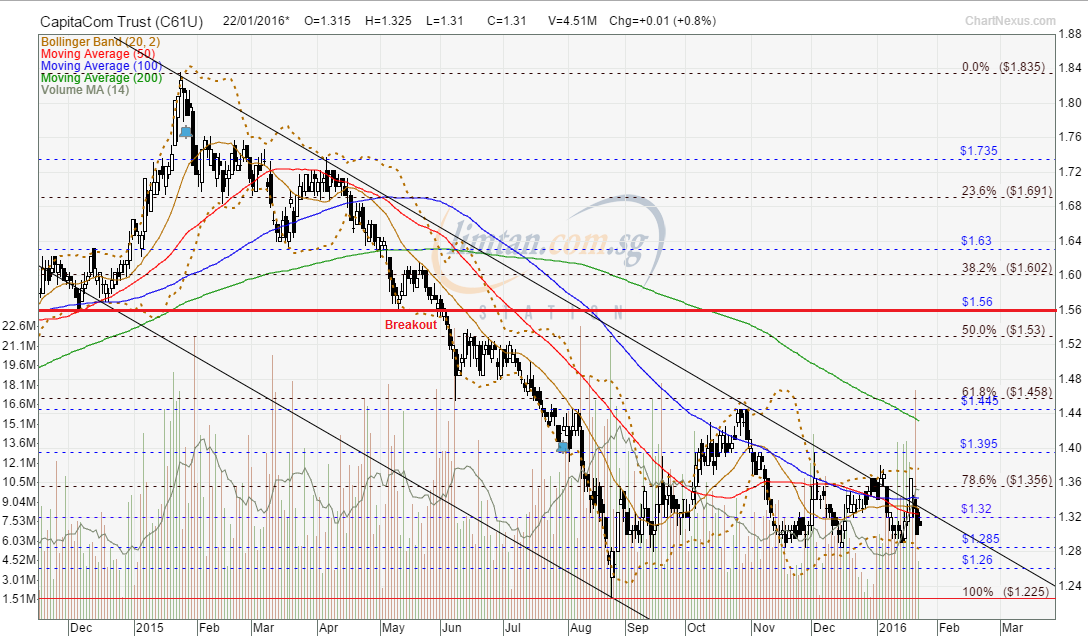 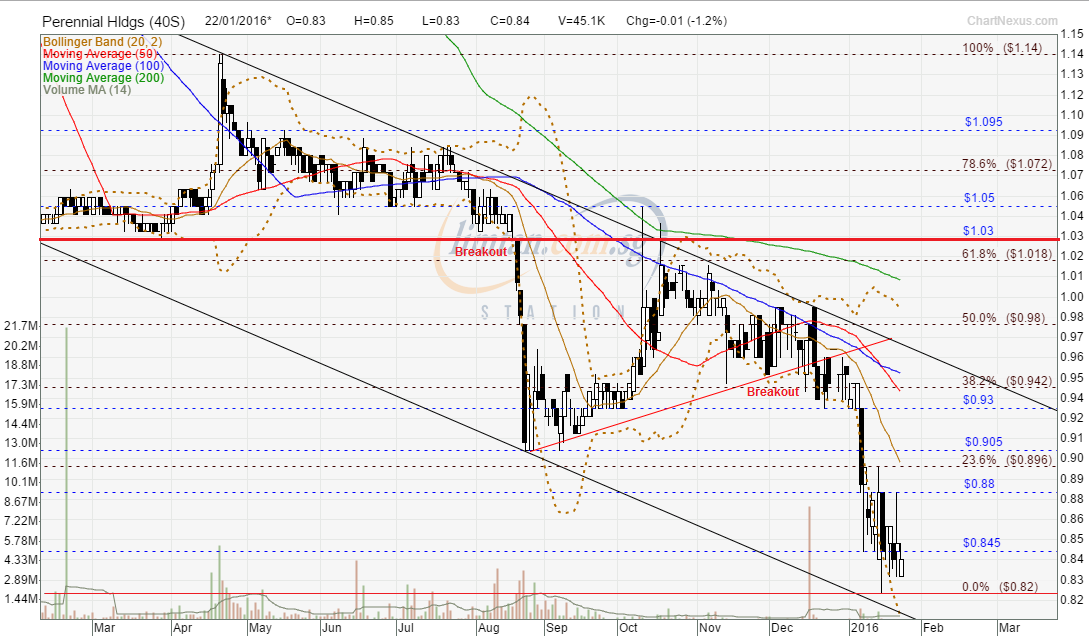
|
|
|
|
Post by zuolun on Feb 6, 2016 9:57:22 GMT 7
The confluence of all the 4 SMAs: Dead crosses ~ A "waterfall decline" chart pattern1. Neo2. SembMar3. UOB4. OCBC5. ARA6. Jardine C&C 7. AirAsia 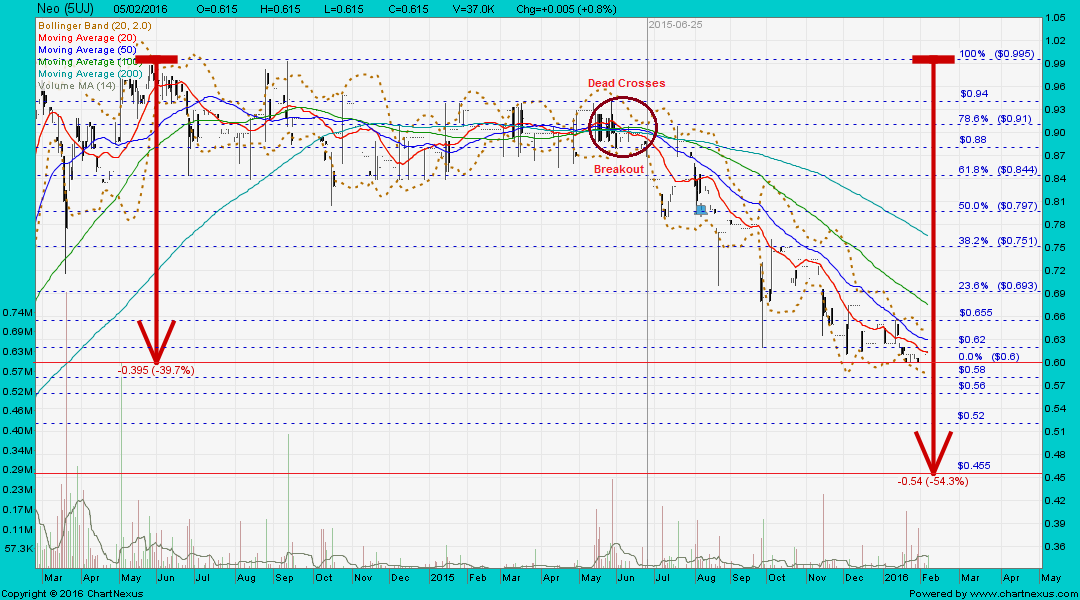 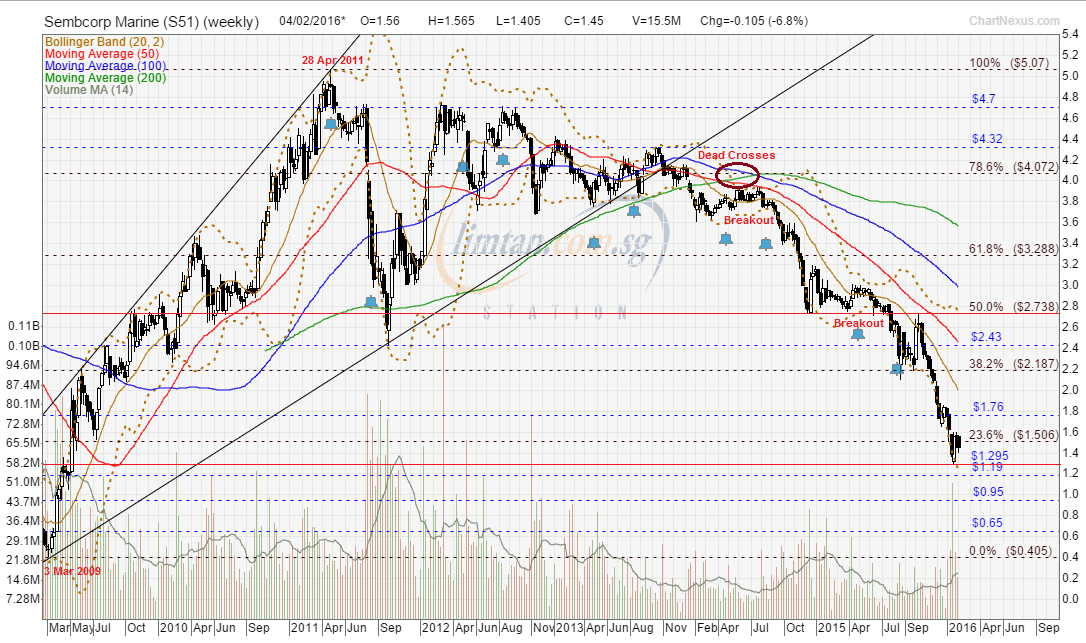 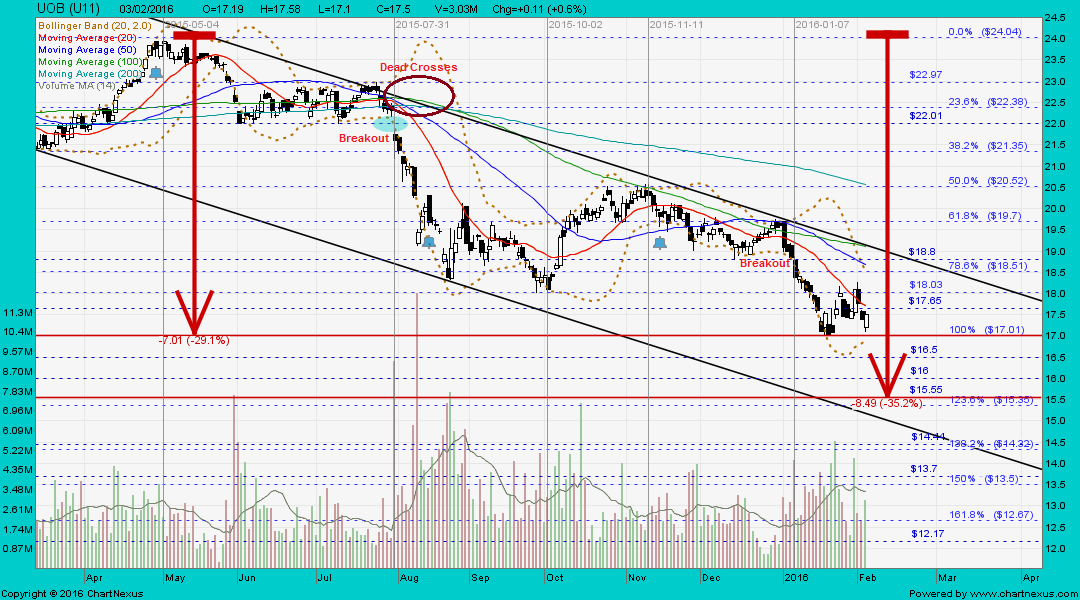 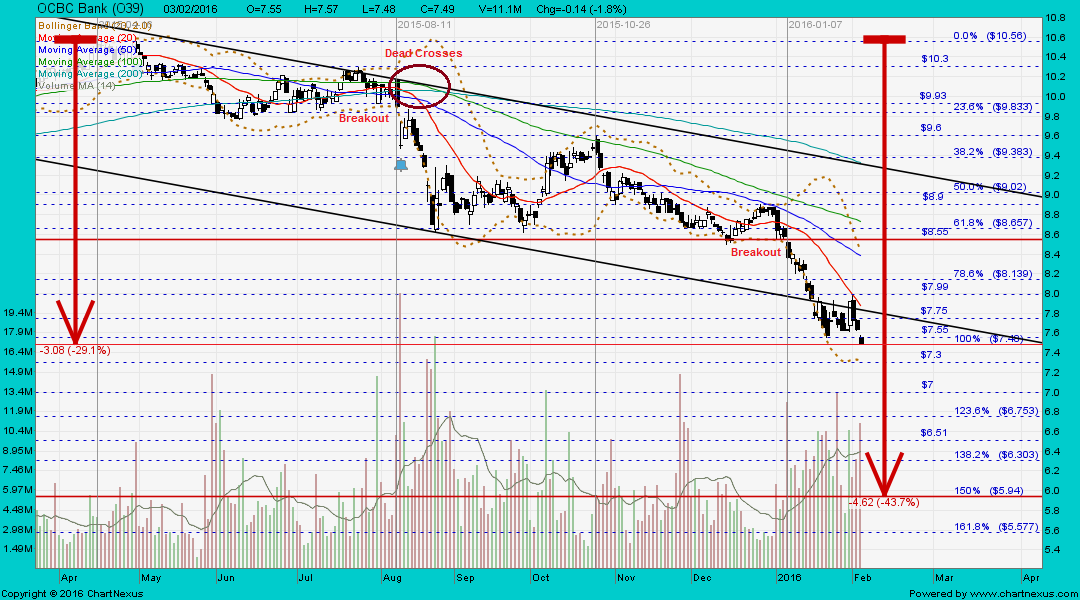 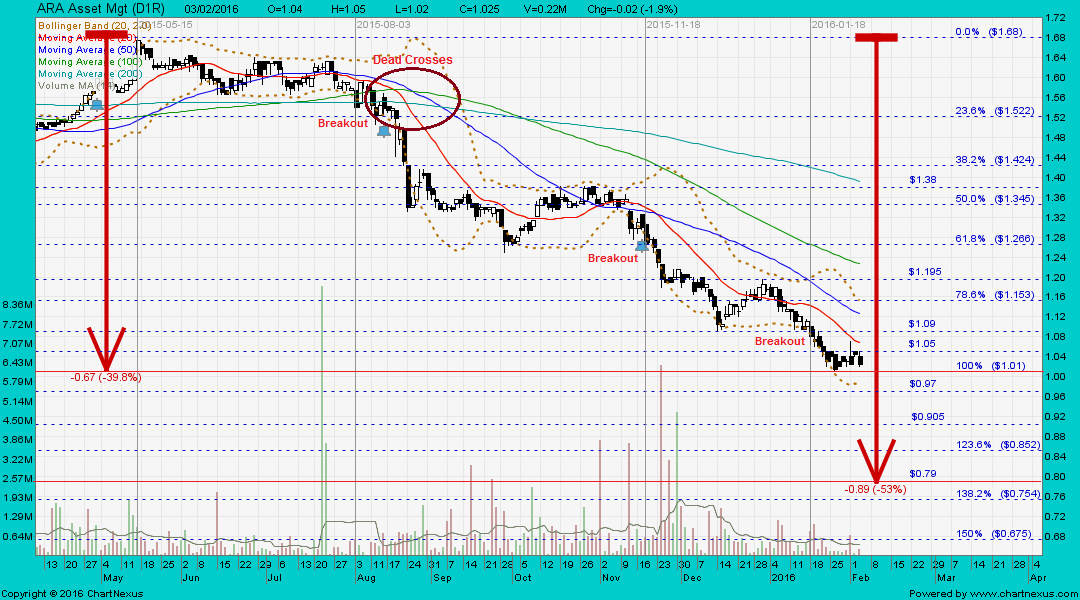 Jardine C&C as 6 Nov at 2013 Jardine C&C as 6 Nov at 2013 AirAsia as at 11 Dec 2012 AirAsia as at 11 Dec 2012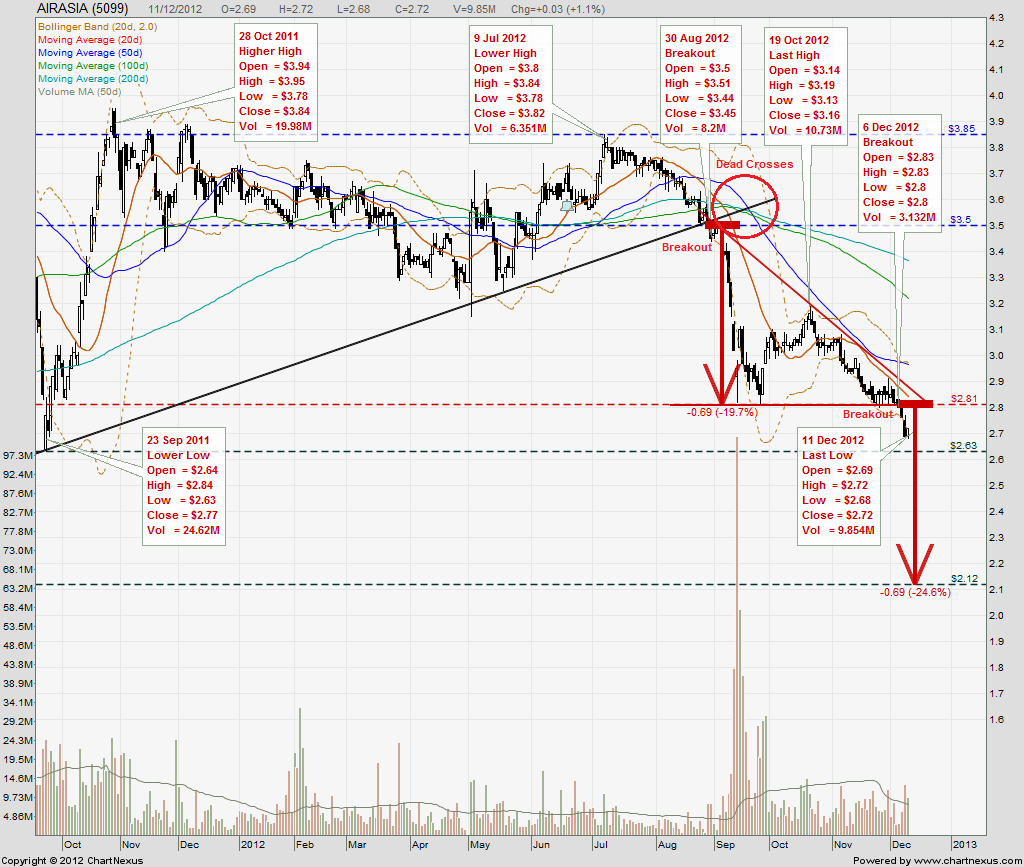 The significant difference bet. price crashing down on low vol. and price crashing down on high vol.
Sometimes, certain things could only be visible on the chart when the share price starts its unusual / volatile movement (up or down all in a row, with or without volume). Bollinger bands are very powerful technical indicator. When using it as a key indicator, volume is not necessarily required, instead, the breakout (upside or downside) at the upper or lower Bollinger band is more important. Likewise, in a downtrend, volume is not required for a downside breakout at support level. However, in an uptrend, volume is necessary for an upside breakout at resistance level. Note: A price drop (or rise) on high volume all in a row is a stronger signal indicating that something in the stock has fundamentally changed. AirAsia ~ Bearish Bollinger Band BreakoutAirAsia closed at new low with a black marubozu @ RM0.78 (-0.09, -10.3%) with extremely high volume done at 120,395,500 shares on 26 Aug 2015. Immediate support @ RM0.765, immediate resistance @ RM0.905. 
|
|
|
|
Post by zuolun on Feb 8, 2016 7:24:33 GMT 7
China Aviation and Golden Agri ~ Symmetrical triangle formation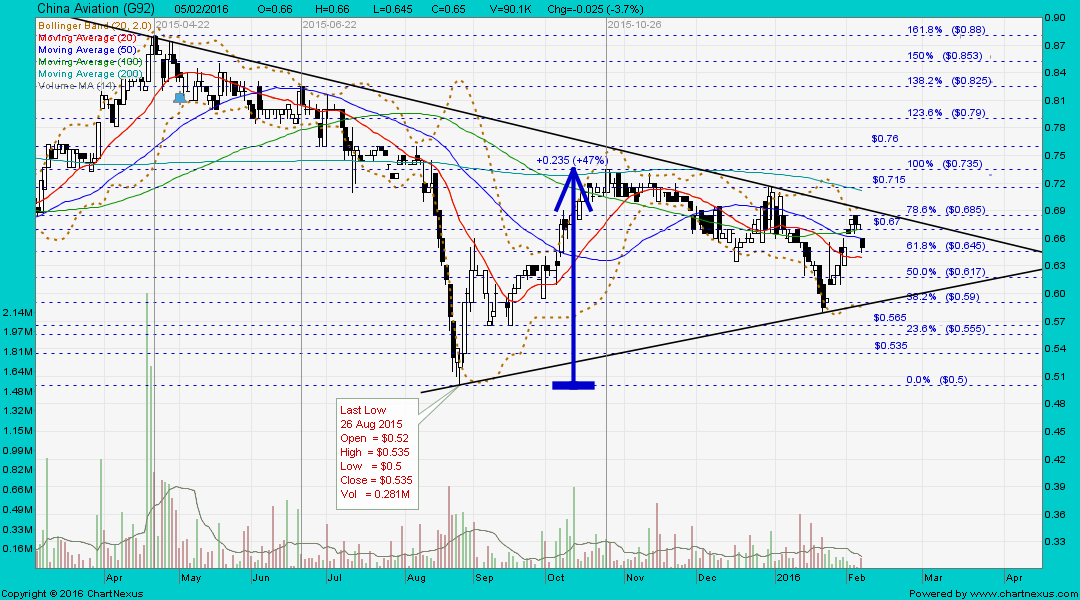 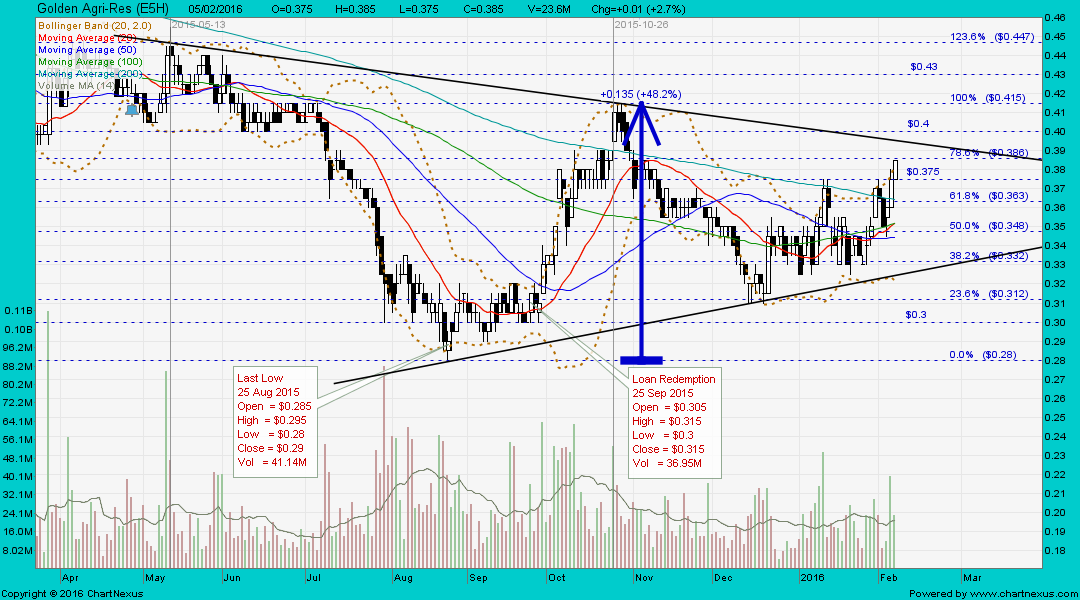
|
|
|
|
Post by zuolun on Feb 27, 2016 6:47:27 GMT 7
GoldenAgri and CAO ~ Symmetrical triangle formation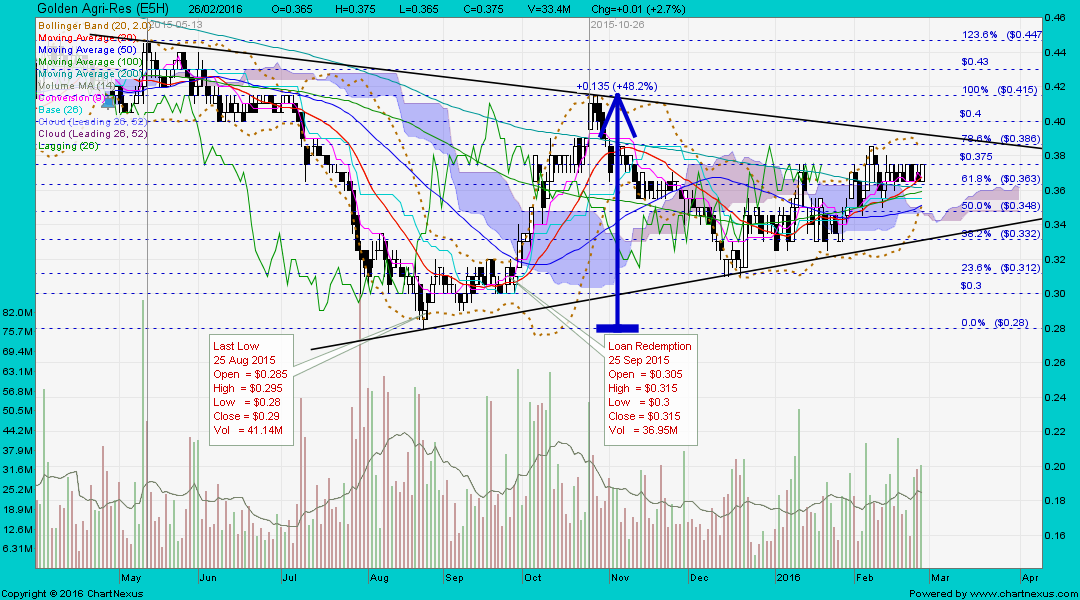 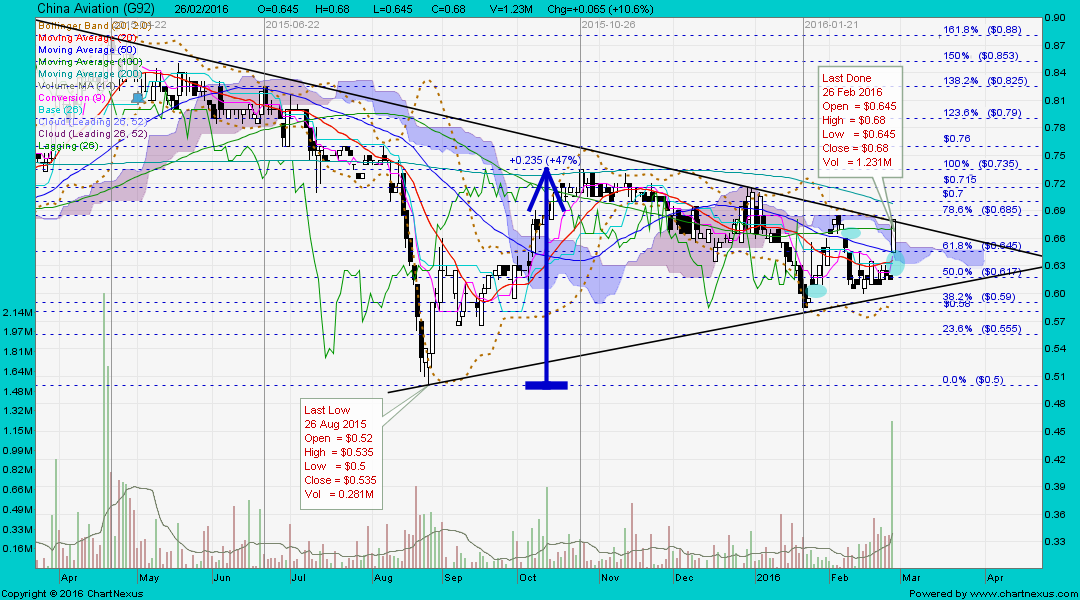
|
|