|
|
Post by roberto on Jun 26, 2015 14:13:11 GMT 7
Bro Zuolun, I could only see 4 sides but you could watch 8 directions.  You are my hero !  , Nothing special because many years ago, I had attended a classroom lesson on how to calculate the target projections based on the Elliott Wave theory - meaning should the scenario (Fibonacci retracements ratio) materialise on Silverlake; it is a science (mathematic solution), not an art of technical analysis. Ezra's target projection @ S$0.153 based on Fibonacci retracements ratio is also a science (mathematic solution), not an art of technical analysis. The law of supply and demand: An increase in supply = A decrease in price.About the statement "should the scenario (Fibonacci retracements ratio) materialise on Silverlake; it is a science (mathematic solution), not an art of technical analysis", am correct to infer that this is a 'if A then B' concept'? In this case what you mean is that if the Fib retracements/conditions are met, the target projections will follow? I have rudimentary knowledge about harmonic patterns and EW, but I find your comments interesting and wish to understand more. |
|
|
|
Post by zuolun on Jun 26, 2015 14:22:27 GMT 7
sptl123, Nothing special because many years ago, I had attended a classroom lesson on how to calculate the target projections based on the Elliott Wave theory - meaning should the scenario (Fibonacci retracements ratio) materialise on Silverlake; it is a science (mathematic solution), not an art of technical analysis. Ezra's target projection @ S$0.153 based on Fibonacci retracements ratio is also a science (mathematic solution), not an art of technical analysis. The law of supply and demand: An increase in supply = A decrease in price. About the statement "should the scenario (Fibonacci retracements ratio) materialise on Silverlake; it is a science (mathematic solution), not an art of technical analysis", am correct to infer that this is a 'if A then B' concept'? In this case what you mean is that if the Fib retracements/conditions are met, the target projections will follow? I have rudimentary knowledge about harmonic patterns and EW, but I find your comments interesting and wish to understand more. For educational purpose, the simplest and easiest way to learn harmonic patterns and EW fast is that, go buy the stock, Silverlake Axis b4 bonus issue, i.e. go against the major trend, try it out with just one lot will do. I used to do it quite often in the past with tight stop-loss in place just to test what I had learned in theory is also valid in practice. |
|
|
|
Post by roberto on Jun 28, 2015 9:57:38 GMT 7
About the statement "should the scenario (Fibonacci retracements ratio) materialise on Silverlake; it is a science (mathematic solution), not an art of technical analysis", am correct to infer that this is a 'if A then B' concept'? In this case what you mean is that if the Fib retracements/conditions are met, the target projections will follow? I have rudimentary knowledge about harmonic patterns and EW, but I find your comments interesting and wish to understand more. For educational purpose, the simplest and easiest way to learn harmonic patterns and EW fast is that, go buy the stock, Silverlake Axis b4 bonus issue, i.e. go against the major trend, try it out with just one lot will do. I used to do it quite often in the past with tight stop-loss in place just to test what I had learned in theory is also valid in practice. It's said experience is the best teacher, and I agree because I learnt not to go against the trend that way too. But that's not my interest here, it's the "if A then B" idea which I find hard to digest. |
|
|
|
Post by zuolun on Jun 28, 2015 21:46:44 GMT 7
For educational purpose, the simplest and easiest way to learn harmonic patterns and EW fast is that, go buy the stock, Silverlake Axis b4 bonus issue, i.e. go against the major trend, try it out with just one lot will do. I used to do it quite often in the past with tight stop-loss in place just to test what I had learned in theory is also valid in practice. It's said experience is the best teacher, and I agree because I learnt not to go against the trend that way too. But that's not my interest here, it's the "if A then B" idea which I find hard to digest. Technical Analysis is the forecasting of future financial price movements based on an examination of past price movements. Like weather forecasting, technical analysis does not result in absolute predictions about the future. Instead, technical analysis can help investors anticipate what is “likely” to happen to prices over time. Technical analysis uses a wide variety of charts that show price over time. |
|
|
|
Post by sptl123 on Jun 28, 2015 23:28:02 GMT 7
It's said experience is the best teacher, and I agree because I learnt not to go against the trend that way too. But that's not my interest here, it's the "if A then B" idea which I find hard to digest. Technical Analysis is the forecasting of future financial price movements based on an examination of past price movements. Like weather forecasting, technical analysis does not result in absolute predictions about the future. Instead, technical analysis can help investors anticipate what is “likely” to happen to prices over time. Technical analysis uses a wide variety of charts that show price over time. Bro Zuolun,
My version of what is Technical Analysis (TA) ?
TA is: The more I know, the more I don't know.....  I said this because every time from your answers to my questions, only then I realized there are so many things I still do not know or still could not visualized.
I am so amazed by the tools and scope of TA; so little I know..... However, I am convinced TA works; " 已有的事,后必再有。已行的事,后必再行。日光之下并无新事。"Let me use a small part of TA on two post event of Starhub to show that TA is working and working well. I would have hoot big big on these two event if I were to joint PertamaForum and knew Bro Zuolun few months earlier.   Thank you bro Zuolun for the guidance and contribution in PertamaForum.   |
|
|
|
Post by roberto on Jul 26, 2015 22:37:53 GMT 7
The set up below just screamed out at me so here it is. I don't know what animal it's called but I'm pretty sure it's a valid harmonic pattern. "High probability reversal zone", as some like to call it, lines up really nicely with Fibs and area of resistance.  |
|
|
|
Post by sptl123 on Jul 27, 2015 23:15:05 GMT 7
The set up below just screamed out at me so here it is. I don't know what animal it's called but I'm pretty sure it's a valid harmonic pattern. "High probability reversal zone", as some like to call it, lines up really nicely with Fibs and area of resistance. Roberto, Yes a Bearish Gartley Pattern view from XABCD. AB=CD Pattern too. It is an idea candidate to be shorted.  |
|
|
|
Post by zuolun on Jul 30, 2015 9:41:26 GMT 7
sptl123, Everyone can draw charts but not everyone can read charts, correctly. 半桶水 + 半桶水 ≠ 一桶水 The set up below just screamed out at me so here it is. I don't know what animal it's called but I'm pretty sure it's a valid harmonic pattern. "High probability reversal zone", as some like to call it, lines up really nicely with Fibs and area of resistance. Roberto, Yes a Bearish Gartley Pattern view from XABCD. AB=CD Pattern too. It is an idea candidate to be shorted.
|
|
|
|
Post by zuolun on Aug 1, 2015 14:40:13 GMT 7
 Silverlake - No order book stated: is it facing a revenue hole? Silverlake - No order book stated: is it facing a revenue hole? ~ 16 July 2015 Alternative (+ve) view:Silverlake Axis ~ Symmetrical Triangle formationSilverlake closed with a spinning top @ S$0.97 (-0.03, -3%) with 2.44m shares done on 31 July 2015. Immediate support @ S$0.94, immediate resistance @ S$0.995.  Silverlake peaked @ S$1.46 (point x or point 5) on 6 Apr 2015 and had completed the impulsive 5-Wave up; it's now riding on the corrective A-B-C Wave down. Its share price collapsed S$0.53 or 36.3% to S$0.93 (point a or point A) on 8 Jun 2015. It then rebounded to S$1.25 (point b, the 38.2% Fibonacci retracements) on 22 Jun 2015. Yesterday, 25 Jun 2015, Silverlake closed with a spinning top @ S$1.14 (-0.03, -2.6%). The Gartley pattern is a subset of the Elliott Wave pattern, based on the corrective A-B-C Wave; the potential AB=CD pattern is likely to 1st hit S$0.995 (point c, the 88.6% Fibonacci retracement level) and then rebound to point d or point B (the target projections or resistance levels can be anywhere @ S$1.335, S$1.37 and S$1.41), b4 it continues its downside movement to form a lower low @ S$0.805 or point C, the 123.6% Fibonacci retracement level (depending on point d or point B, the target projections or support levels can be anywhere between S$$0.905 to S$0.805). Should this scenario (Fibonacci retracements ratio) materialise, Silverlake would have completed the Bearish Gartley Bat pattern @ S$0.805 or point C.  For short-trades, take note Silverlake: 1-for-5 bonus issue – Notice of books closure date For short-trades, take note Silverlake: 1-for-5 bonus issue – Notice of books closure date ~ 24 Jun 2015  Silverlake Axis ~ Bearish Gartley Bat Formation Silverlake Axis ~ Bearish Gartley Bat FormationSilverlake closed with a spinning top @ S$1.14 (-0.03, -2.6%) with 2.7m shares done on 25 Jun 2015. Immediate support @ S$1.09, immediate resistance @ S$1.195.  |
|
|
|
Post by sptl123 on Aug 1, 2015 17:49:49 GMT 7
Bro Zuolun, After the emerging and completion of a Gartley Pattern, how to project the technical target price? I read that, for bullish projection, the three TP is +100% +, 127% XA and +161.8% of XA Extension. For Bearish projection, the three TP is 100%, -127% and -161.8 of XA retracement. Are they correct? For illustration purpose, I use the prevailing Silver Lake Axis Chart for TP projection.  |
|
|
|
Post by zuolun on Aug 2, 2015 0:06:34 GMT 7
sptl123Harmonic / Gartley pattern is part of the Elliott Wave pattern and it's best used on forex trading which does not have trading volume, bonus issue and dividend adjustment. I apply it on equity trading as long as the structure of the chart pattern appears and the price moves according to the key Fibonacci retracement ratios. For Silverlake Axis, the left side of the gartley (xa and ab) was well-formed prior to the bonus issue. However, the right side of the gartley (bc and cd) was not well-formed after the bonus issue, i.e. once the critical resistance has failed to hit the key ratio at S$1.17 or point d, the bearish gartley bat pattern is negated.   Bro Zuolun, After the emerging and completion of a Gartley Pattern, how to project the technical target price? I read that, for bullish projection, the three TP is +100% +, 127% XA and +161.8% of XA Extension. For Bearish projection, the three TP is 100%, -127% and -161.8 of XA retracement. Are they correct? For illustration purpose, I use the prevailing Silver Lake Axis Chart for TP projection.
|
|
|
|
Post by zuolun on Aug 5, 2015 16:03:31 GMT 7
sptl123, A symmetrical triangle is a 50/50 bet, i.e. it can either breakup or breakdown. For Silverlake Axis, it has been trading below the 200d SMA. Should the share price convincingly break the crucial support @ S$0.855 and collapse much further down to retest the last low @ S$0.775, it means the stock has peaked @ S$1.215. (See similar chart pattern in SuperGroup dated 11 Nov 2013.) Why the 200d SMA is important:
The Simple Moving Average (SMA) is the average price of an asset over a certain period of time. It is calculated by adding up the closing prices over a certain number of time periods, and then dividing by that number of time periods. SMA’s are used to measure momentum. The most watched SMA is the 200 day, it is widely recognized as the dividing line between bull and bear territory. Silverlake Axis ~ Symmetrical Triangle formationSilverlake closed with a hammer @ S$0.95 (-0.025, -2.6%) with 2.19m shares done on 5 Aug 2015. Immediate support @ S$0.88, immediate resistance @ S$0.995.  
|
|
|
|
Post by zuolun on Aug 14, 2015 7:38:42 GMT 7
 Silverlake Axis ~ Bearish symmetrical triangle breakout, interim TP S$0.775 Silverlake Axis ~ Bearish symmetrical triangle breakout, interim TP S$0.775Silverlake closed with an inverted hammer unchanged @ S$0.875 with 4.18m shares done on 13 Aug 2015. Immediate support @ S$0.855, immediate resistance @ S$0.905. 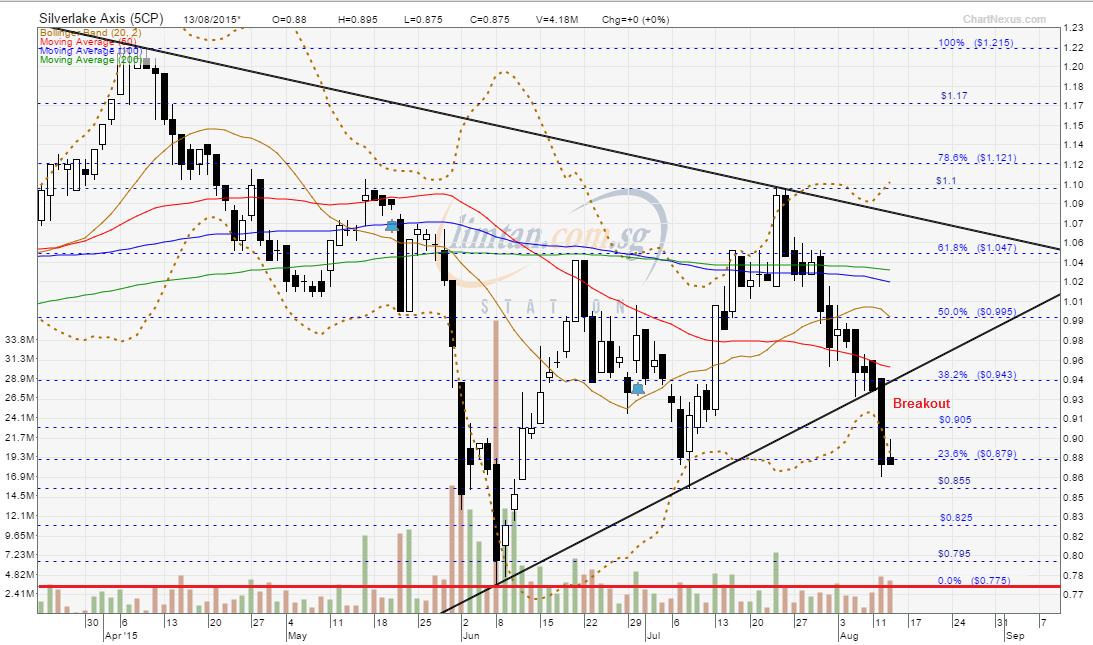 |
|
|
|
Post by roberto on Aug 24, 2015 11:41:30 GMT 7
"... Many people have this misconception that once the financial statements are audited and if the auditor's opinion are unqualified, then everything we read in the financial reports must be holy true. That is not the case apparently. It is the management responsibility to ensure that the financial statements are true to the best of their knowledge and it usually depends very much on their integrity to disclose more or less information to the public which was not so apparent. A good example would be off balance sheet disclosure items. ..." Thanks odie for the link in another thread: My Thoughts On The Silverlake CaseI know many who were tempted to enter when price went under $1; I'm sure some did; I almost did. Scary times for SLA. |
|
|
|
Post by roberto on Aug 25, 2015 23:12:18 GMT 7
|
|


 You are my hero !

 I said this because every time from your answers to my questions, only then I realized there are so many things I still do not know or still could not visualized.


