|
|
Post by zuolun on Apr 14, 2015 5:56:16 GMT 7
Why has Sarine Tech fallen by 24% today? ~ 13 Apr 2015 Sarin Tech ~ Bearish Diamond Top Breakout, interim TP S$1.72Sarin Tech closed with a long black marubozu @ S$1.94 (-0.61, -23.9%) with 5.28m shares done on 13 Apr 2015. 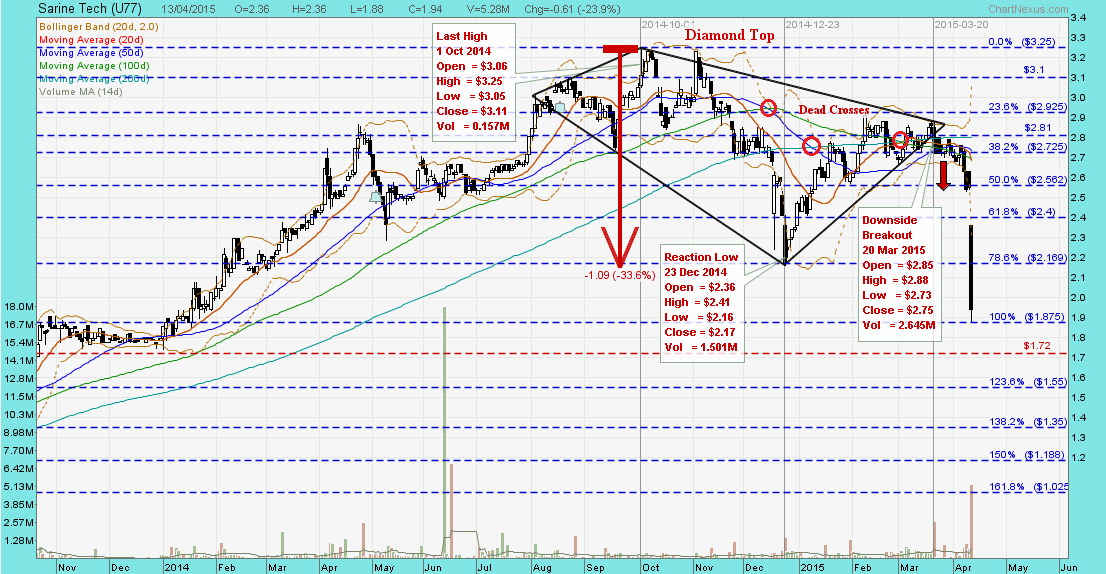 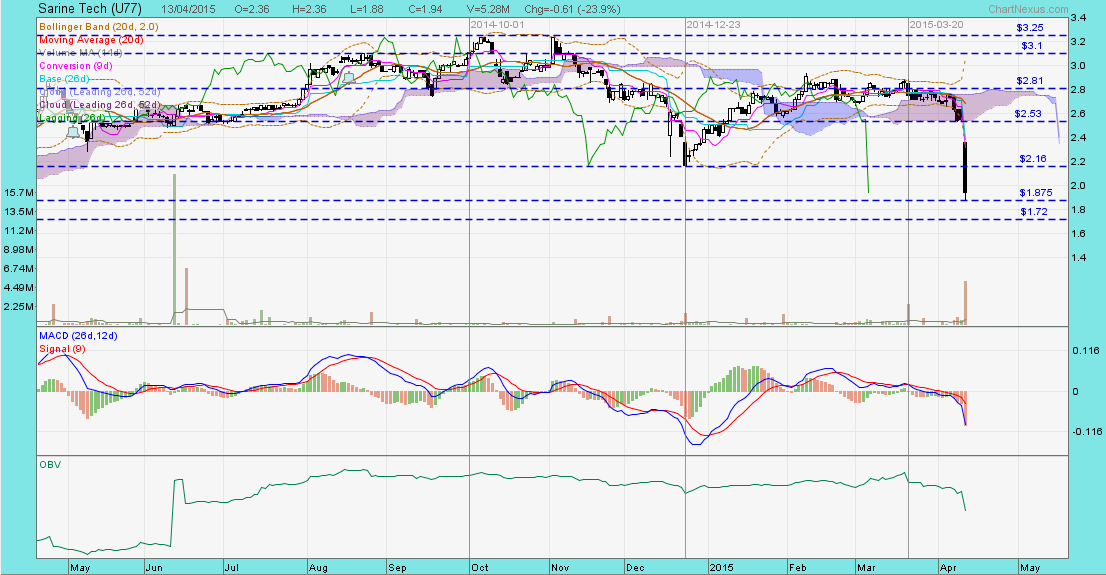 Diamond Chart Formation Diamond Chart FormationA diamond chart formation is a rare chart pattern that looks similar to a head and shoulders pattern with a V-shaped neckline. Diamond chart reversals rarely happen at market bottoms, it most often occurs at major tops and with high-volume. Since diamonds are a variation of head and shoulders tops, you have to resist the desire to classify every head and shoulders top as a diamond formation. The reason you will want to avoid this is because the diamond will signal a break in trend much earlier than a head and shoulders pattern, which could result in a premature short position. To calculate the breakout potential for a diamond formation, you will want to take the distance between the highest and lowest point in the diamond formation and add it to the breakout point. However, in most occurrences a breakout from the diamond chart formation will carry stocks much further. 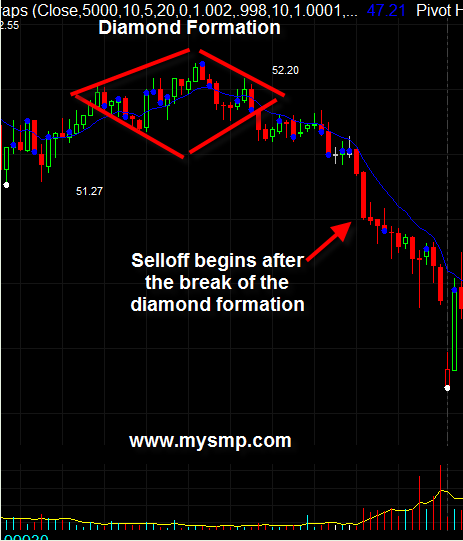 Sarin Tech ~ Diamond Top Breakout, interim TP S$1.72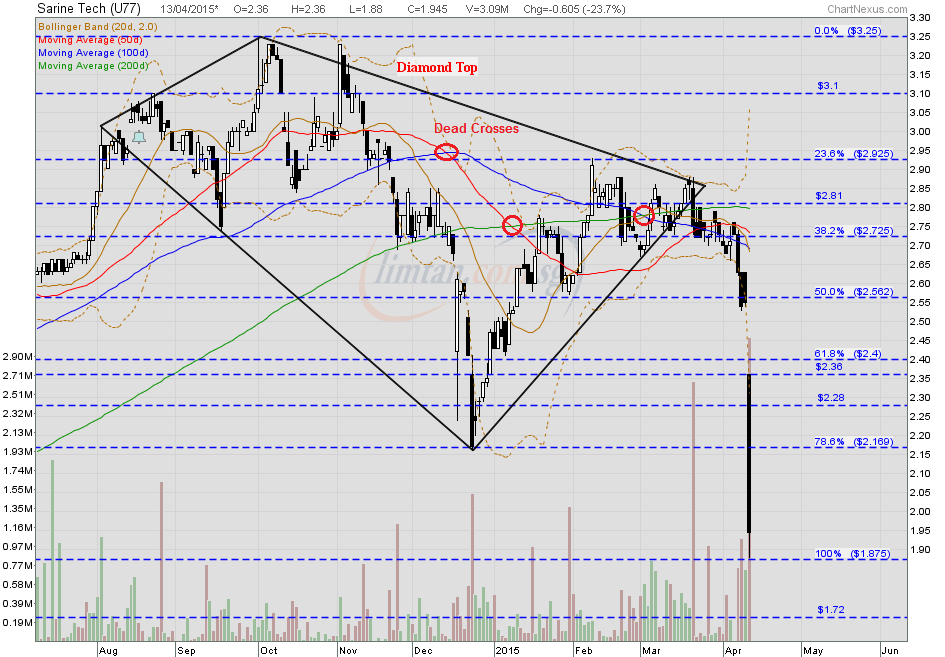
|
|
|
|
Post by zuolun on Jun 6, 2015 4:30:12 GMT 7
Sarin Tech: Maybank Kim Eng kept at ‘buy' TP S$3.07 ~ 5 Jun 2015 Sarin Tech ~ Bollinger Bands SqueezeSarin Tech closed with a long white marubozu @ S$2.16 (+0.165, +8.3%) with volume done at 430,000 shares on 5 Jun 2015. Immediate support @ S$2.08, immediate resistance @ S$2.22. 
|
|
|
|
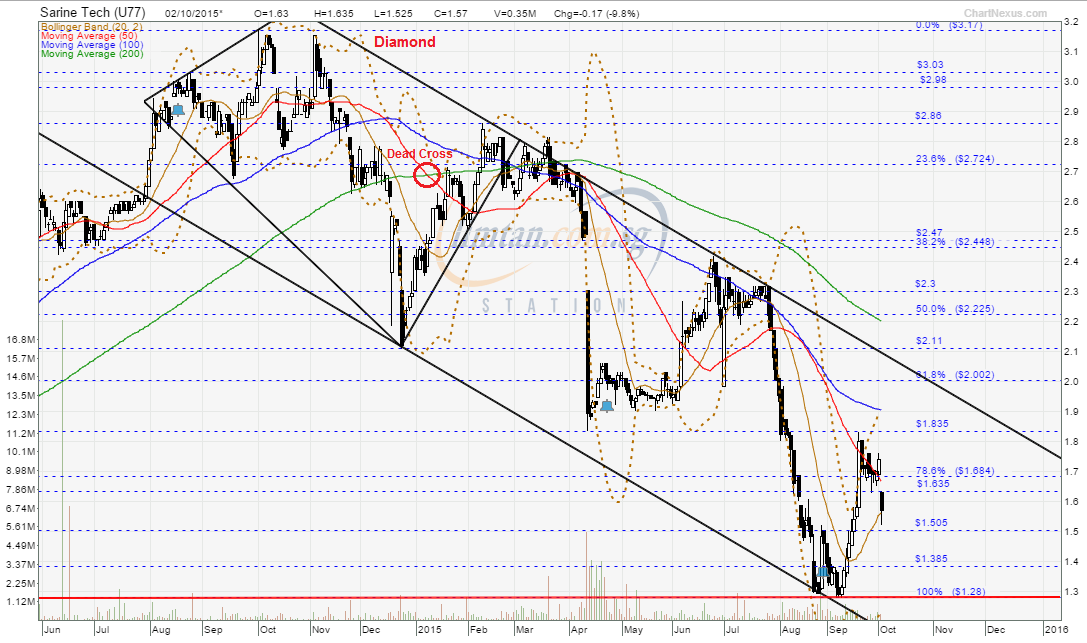
Post by zuolun on Oct 2, 2015 10:27:25 GMT 7
|
|
|
|
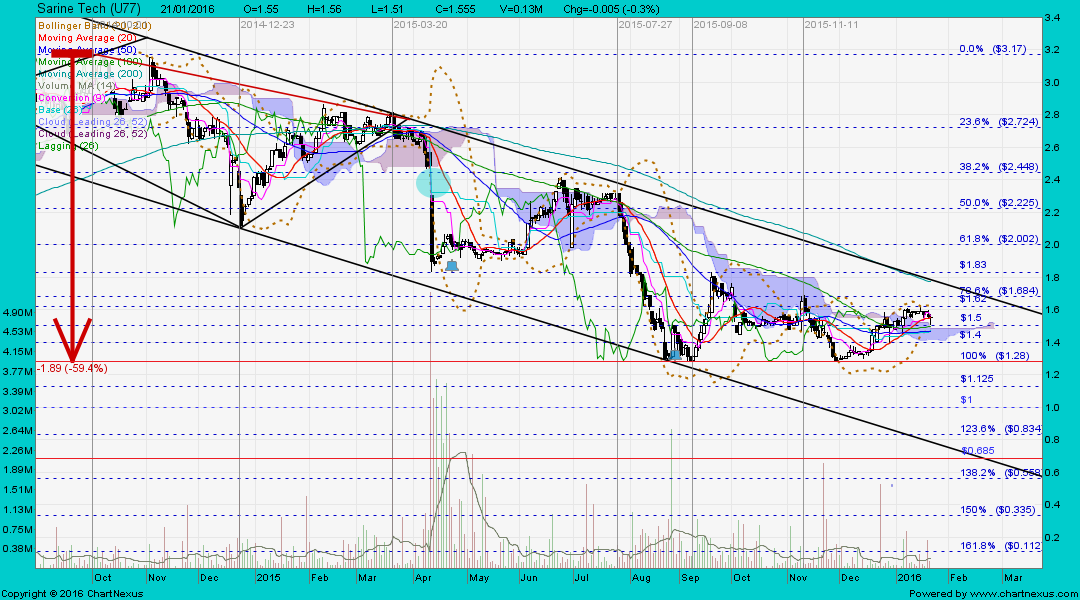
Post by zuolun on Jan 22, 2016 7:15:11 GMT 7
|
|