|
|
Post by zuolun on May 12, 2014 19:12:19 GMT 7
zuolun bro, agreed. i also watched the video and think it is tough for him to make money.  odie, I've watched the video more than 5X. The example 1 on Wilmar was a real trade done by my friend. He used to teach and guide me on TA in the past but we have differing views on Wilmar. To date, he is still bullish and has sizeable “long positions” in Wilmar. "Pricing Power More Important Than Good Management" - Warren Buffett oldman, Buying a property with bank loan and buying shares with CFD is actually borrowing money at high leverage to generate greater returns. Both assets carry the same risk but the former could have a much higher risk due to liquidity problem. Example 1 My friend purchased 500 lots of Wilmar shares @ 3.30 per share = S$165,000 cash (max. financing for Wilmar @ 90%). He sold the 500 lots of Wilmar shares @ 3.50 per share for a quick profit @ 0.20 per share = S$100,000 (excluding commission and other charges). Example 2 My friend purchased a 1,000 sq ft condo @ S$1,650 per sq ft = S$165,000 or 10% downpayment in cash (10% upon TOP, bal. by 30 years bank financing). He flipped it for a quick profit of 10% b4 TOP = S$165,000 (excluding commission and other charges). |
|
|
|
Post by zuolun on May 18, 2014 8:49:54 GMT 7
odie, I believe you're aware that I've never been bullish on Wilmar after it broke the support at S$6.00. My bearish view was originated from the video clip (Chinese version) dated 25 Sep 2011, coupled with my chart dated 5 Apr 2012. The current sideway movement may last for a long period, maybe ten (10) years or longer but long-term major downtrend won't change overnite. odie, Wilmar's weekly chart indicates that prices have been trading in a descending triangle for 2 years (7 May 2012 to 16 May 2014). Should the crucial support @ S$3.00 breakdown convincingly, the trading range bet. S$3 to S$3.56 may not last for ten (10) years or longer.  Wilmar — Crucial Support @ S$3.00 Wilmar — Crucial Support @ S$3.00 Wilmar (weekly) — Descending Triangle formation Wilmar (weekly) — Descending Triangle formation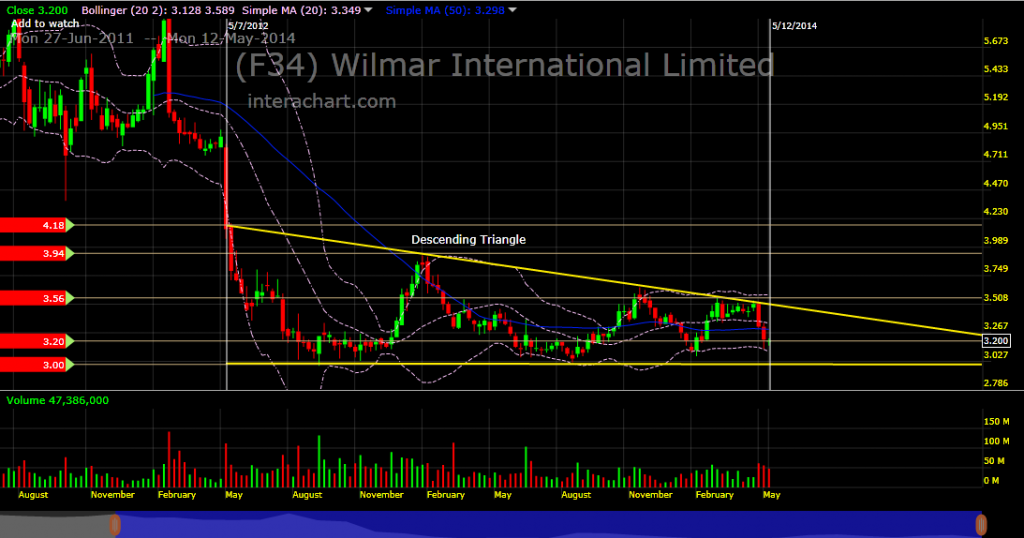 Wilmar — 14 July 2006 to 16 May 2014 Wilmar — 14 July 2006 to 16 May 2014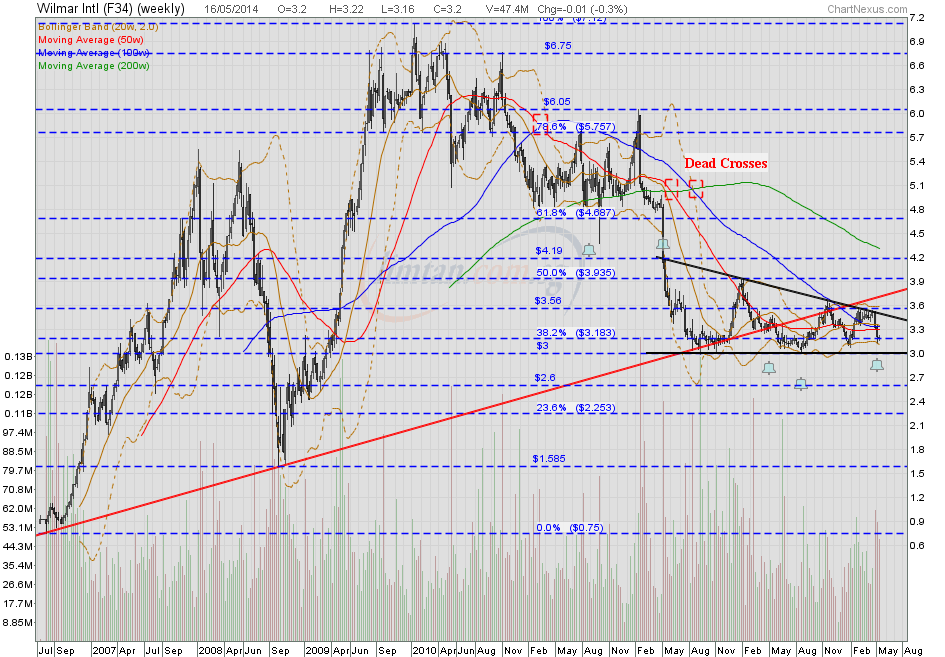 |
|
|
|
Post by zuolun on May 19, 2014 12:09:35 GMT 7
|
|
|
|
Post by zuolun on May 27, 2014 13:26:59 GMT 7
|
|
|
|
Post by simplemind on May 27, 2014 14:06:27 GMT 7
That means Wilmer will not drop much from here right?
|
|
|
|
Post by zuolun on May 27, 2014 14:13:14 GMT 7
That means Wilmer will not drop much from here right? Good question! It means Wilmer will not rise much from here, too. If many BBs kena stuck at much higher prices earlier, new ones have to keep on support-buy and/or trade Wilmar shares up down up down to maintain the equilibrium when some stale bulls run road at break-even price. BBs + retail investors bear the opportunity costs should Wilmar's profitability remain stagnant for many more years.  |
|
|
|
Post by simplemind on May 27, 2014 14:17:18 GMT 7
Heehee,
good to hear that
|
|
|
|
Post by zuolun on May 27, 2014 15:29:16 GMT 7
10 Quick Things I Learned from Wilmar’s AGM 2014 — 16 May 2014 Soybean glut to hit China crush margins — 8 May 2014 Agriculture hits traders Wilmar and NobleBy Jeremy Grant in Singapore and Javier Blas in London 10 May 2014 Wilmar and Noble Group, the Singapore-listed commodities trading houses seen as barometers for the Asian region, reported a sharp fall in first-quarter earnings as both suffered a drop in margins in agriculture. The lower-than-expected results surprised the market, which had been encouraged from upbeat comments earlier in the week by larger commodities trading houses such as Swiss-based Glencore and Tokyo-based Mitsubishi. Wilmar shares plunged more than 9 per cent to their lowest level since early 2009. Wilmar, the world’s largest processor of palm oil, reported a 34 per cent drop in net income in the first quarter compared with the same period last year as its core oilseeds processing unit swung into a loss on overcapacity in China. Wilmar said the decline in net profit to $256m was “largely due to lower oilseeds and grains margins”. Wilmar, like its rivals, has been struggling with shrinking processing margins in China, which has for years driven strong demand for the processing of soyabeans. The weakness in agriculture comes as the industry embarks on an unusually large merger and acquisition spree, with Glencore buying Canadian grain trader Viterra for C$6.1bn and Marubeni of Japan close to acquiring US-grain trader Gavilon for $5bn. Yusuf Alireza, Noble’s new chief executive, told investors on his maiden conference call that consolidation was “clearly going on” in the agriculture industry and said Noble was looking for opportunities. “We plan on playing a role in that consolidation process,” the former Goldman Sachs banker said. Foreign agribusiness companies such as US-based Archer Daniels Midland, Noble and Wilmar, which have expanded capacity in China, have suffered recently as domestic Chinese processors – such as China Agri-Industries Holdings, part of state-owned commodity trader Cofco – ramped up capacity as well. The drop in processing margins has been exacerbated due to a lower crop of oilseeds, including soyabean, increasing the cost of the commodity. Kuok Khoon Hong, Wilmar chairman and chief executive, acknowledged the industry faces a difficult year, saying that “oilseeds crushing margin in China is expected to remain challenging due to excess capacity”.Noble Group, which reported results after the close of the market, also disappointed investors as it missed analysts’ forecasts. It said its net income dropped 46 per cent in the first quarter compared with the same period of 2011. Noble blamed a lower contribution from its agricultural unit due to “weak crush margins”. The unit reported operating income of $47.3m between January and March, down 63 per cent from the same quarter of last year. Richard Elman, Noble chairman, told investors in a letter that he was expecting “a much stronger agricultural performance” in the second half of the year. Noble was also hit by one-off losses on its “supply chain assets” and lower extraordinary earnings than in the first quarter of last year.
|
|
|
|
Post by zuolun on May 28, 2014 12:37:01 GMT 7
odie, Wilmar's weekly chart indicates that prices have been trading in a descending triangle for 2 years (7 May 2012 to 16 May 2014). Should the crucial support @ S$3.00 breakdown convincingly, the trading range bet. S$3 to S$3.56 may not last for ten (10) years or longer. Good question! It means Wilmer will not rise much from here, too. If many BBs kena stuck at much higher prices earlier, new ones have to keep on support-buy and/or trade Wilmar shares up down up down to maintain the equilibrium when some stale bulls run road at break-even price. BBs + retail investors bear the opportunity costs should Wilmar's profitability remain stagnant for many more years. Simplemind, I never like Wilmar as Cha Cha dancing is not my cup of tea. Wilmar — Cha Cha Cha from 7 May 2012 to 27 May 2014 |
|
|
|
Post by zuolun on Jul 1, 2014 17:29:34 GMT 7
Good question! It means Wilmer will not rise much from here, too. If many BBs kena stuck at much higher prices earlier, new ones have to keep on support-buy and/or trade Wilmar shares up down up down to maintain the equilibrium when some stale bulls run road at break-even price. BBs + retail investors bear the opportunity costs should Wilmar's profitability remain stagnant for many more years. Wilmar closed at day's low with a long black marubozu @ S$3.17 (-0.02, -0.6%) with volume done at 4.39m shares on 1 July 2014. Immediate support @ S$3.14, immediate resistance @ S$3.23. 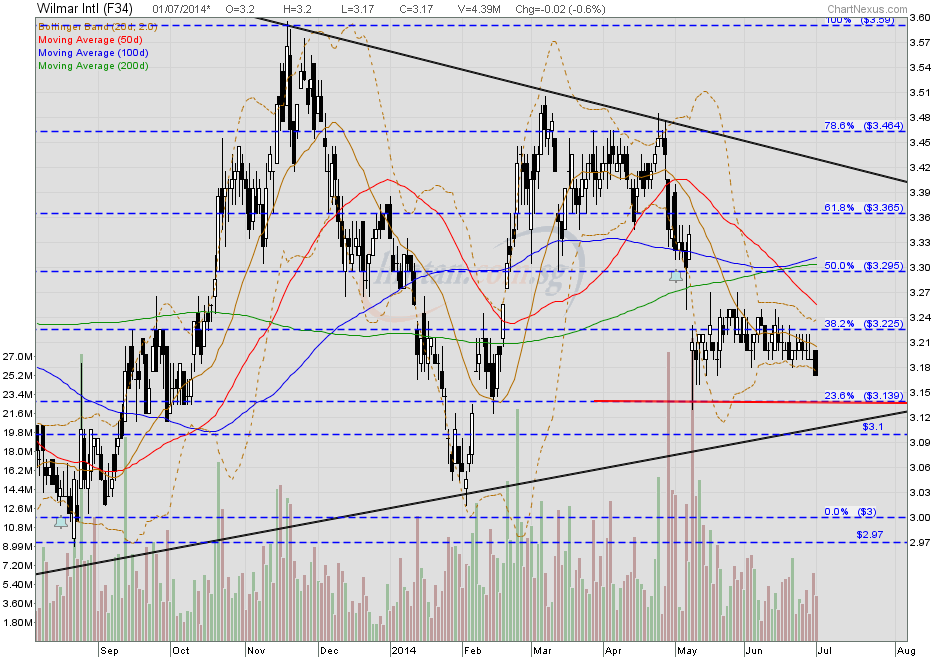  |
|
|
|
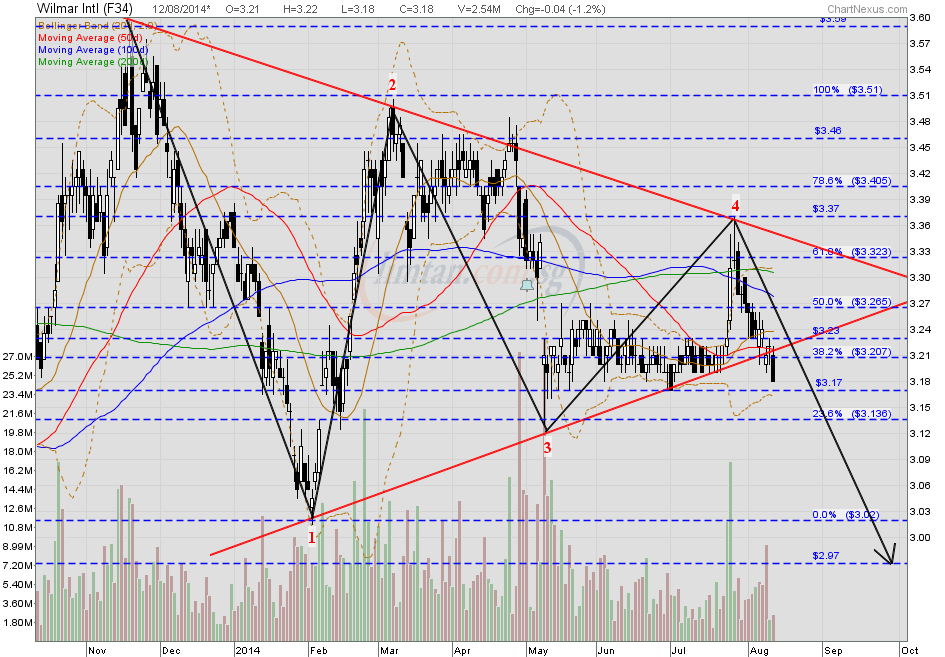
Post by zuolun on Aug 12, 2014 14:05:23 GMT 7
|
|
|
|
Post by zuolun on Sept 26, 2014 13:09:50 GMT 7
Wilmar — Bearish Symmetrical Triangle Breakout, interim TP S$2.97, next TP S$2.60Wilmar had a spinning top @ S$3.11 (-0.02, -0.6%) with 1m shares done on 26 Sep 2014 at 2.10pm. Immediate support @ S$3.06, immediate resistance @ S$3.15. 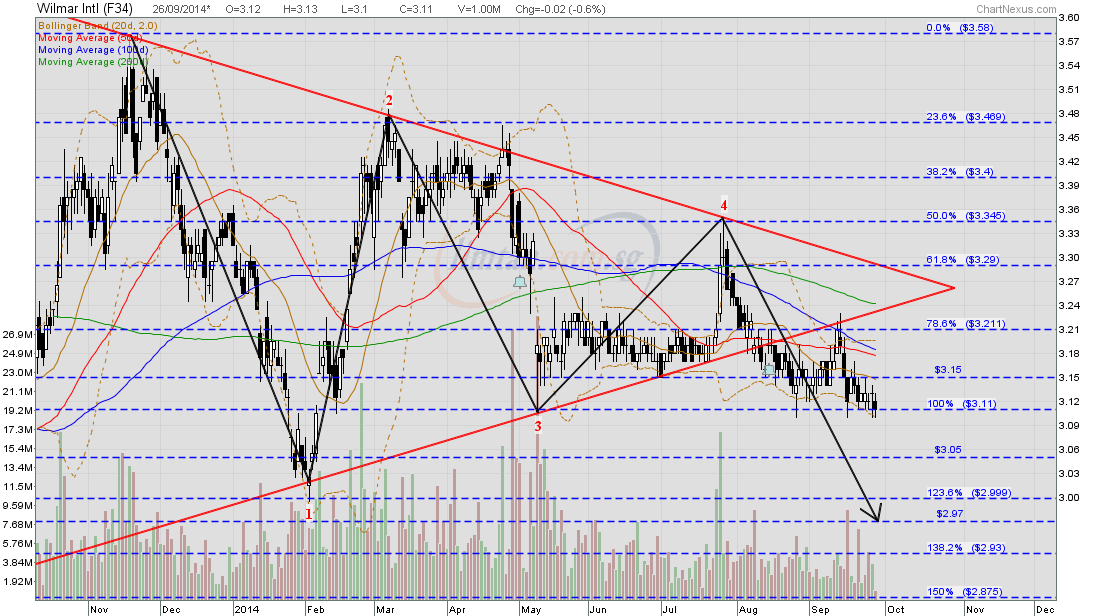
|
|
|
|
Post by zuolun on Sept 26, 2014 21:59:40 GMT 7
升势莫估顶,跌势莫估底。 In an uptrend support holds, in a downtrend support breaks; critical support @ S$3.00 once broken, Wilmar is an outright SELL.Australian competition commission clears Wilmar's S$1.5b bid for Goodman Fielder — 25 Sep 2014   Wilmar — Bearish Symmetrical Triangle Breakout, interim TP S$2.97, next TP S$2.60 Wilmar — Bearish Symmetrical Triangle Breakout, interim TP S$2.97, next TP S$2.60Wilmar closed with a spinning top @ S$3.11 (-0.02, -0.6%) with 2.38m shares done on 26 Sep 2014. Immediate support @ S$3.06, immediate resistance @ S$3.15. 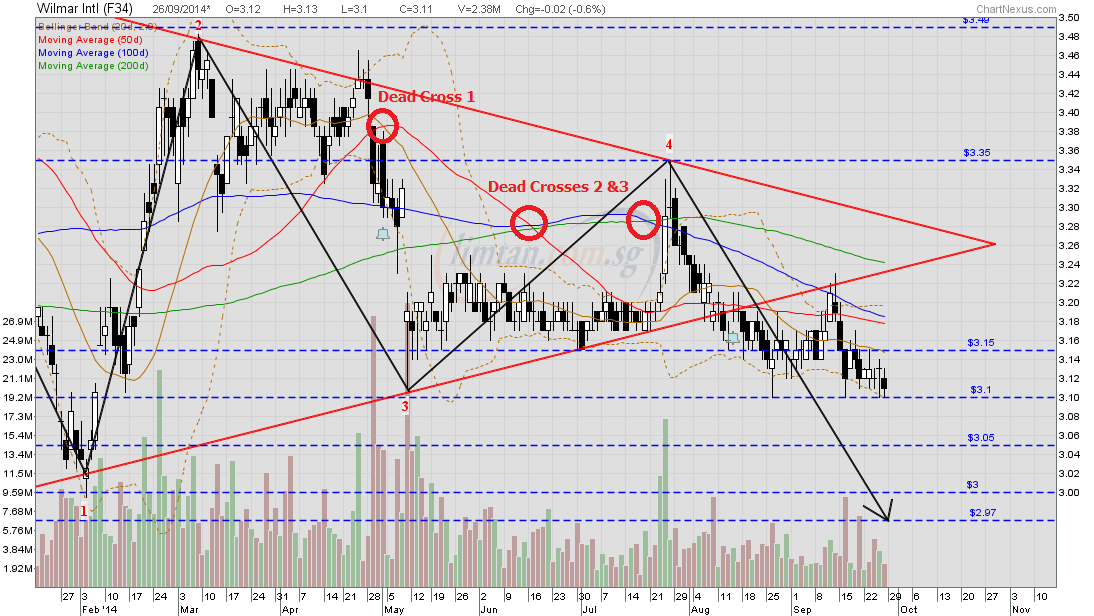 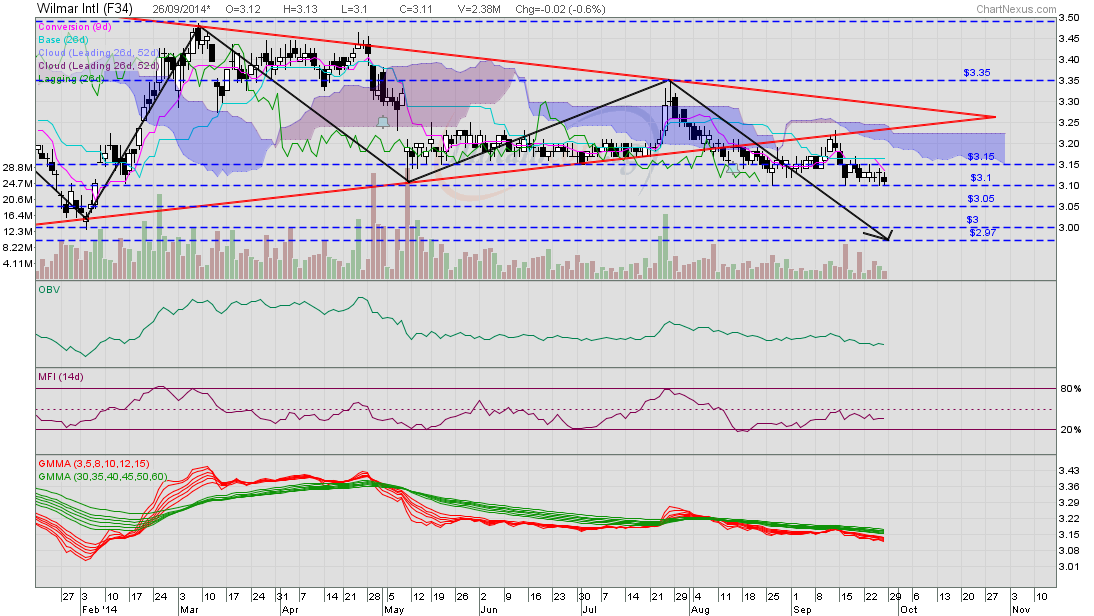
|
|
|
|
Post by zuolun on May 8, 2015 14:43:20 GMT 7
Wilmar Q1 profit jumps 49.1% to US$241.2m on boost from oilseeds and grains ~ 7 May 2015 Wilmar: 1Q15 results mostly in line By Carey Wong 8 May 2015 Wilmar International Limited (WIL) reported a mostly in-line set of 1Q15 results, with revenue down 8.3% YoY at US$9411.3m, mostly reflecting the still-soft commodity prices. Still, topline met about 21% of our full-year forecast. And thanks to a strong 142.4% jump in contribution from associates, reported net profit surged 49.1% to US$241.2m. Core net profit grew at a slightly slower pace of 22.7% to US$263.3m, meeting 21.4% of our FY15 estimate. Going forward, management remains modestly upbeat about its prospects. It expects crush margins to remain positive going into mid-2015; consumer products to continue to grow globally with reasonable margins; but notes that the operating conditions for Tropical Oils will remain challenging. It adds that it is "cautiously optimistic" that 2Q performance will be "satisfactory". We will have more after the analyst briefing later. For now, we keep our BUY rating and S$3.50 fair value (based on 13x FY15F EPS).
|
|
|
|
Post by zuolun on Jul 12, 2015 9:22:57 GMT 7
Thinking of you bro Zuolun. Hope you are well and fine. "技术分析:一代过去,一代又来。地却永远长存。日头出来,日头落下,急归所出之地。风往南刮,又向北转,不住地旋转,而且返回转行原道。江河都往海里流,海却不满。江河从何处流,仍归何处……。已有的事,后必再有。已行的事,后必再行。日光之下并无新事。"I randomly pull out a historical chart of Wilmar International to revisit some of the TA skills you have taught us. ~~False bullish TK-Cross at A because Chikou-Span at x still in bearish-region(below price below kumo. ~~Bearish TK-Cross at B confirmed by Chikou-Span at y which is in bearish-region- below price below kumo. Price drop up to 4.5% after this bearish cross signal. ~~ Buy signals generated by Stochastic and MACD indicator near S , it endorsed by +ve divergence signal of CCI and RSI, further powered by a bullish TK cross at C, price shoot up 8% from S$ 3.00 to 3.25. Importantly, I also learned that DO NOT ACT IMMEDIATELY just based on one signal, wait for one to three candle sticks for trend confirmation and using other indicators to double confirm the direction of price actions. The price actions are predictable by TA. They are a pot of gold! IT IS A MATTER OF TIME THAT WE WILL GET A BIG FISH by using what we learned from you . Thank you Bro Zuolun. PS: BTW I think I am a little better with Gartley Pattern now after so many many late nights.  , Wilmar's daily chart does not show any prominent chart pattern. If you want to do long-trades, look at the weekly chart using S/R, there is good profit scalping bet. $3.05 to $3.27. Based on Wilmar's EW pattern as at 27 Dec 2013, the stock is in a confirmed downtrend and it has been stuck in a rectangle; trading sideway — meaning an invisible hand has been holding up the share price (bet. high of $3.73 to low of $2.81 from 14 May 2012 to 10 July 2015), for the past 3 years. Wilmar's weekly chart as at 10 July 2015 Wilmar — The Elliott Wave Chart Pattern as at 27 Dec 2013 Wilmar — The Elliott Wave Chart Pattern as at 27 Dec 2013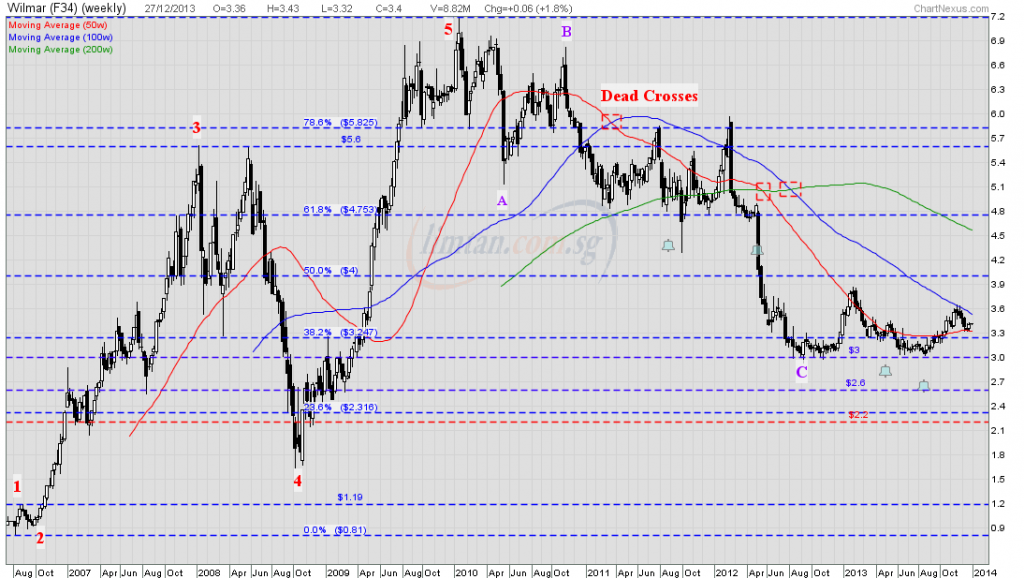 |
|