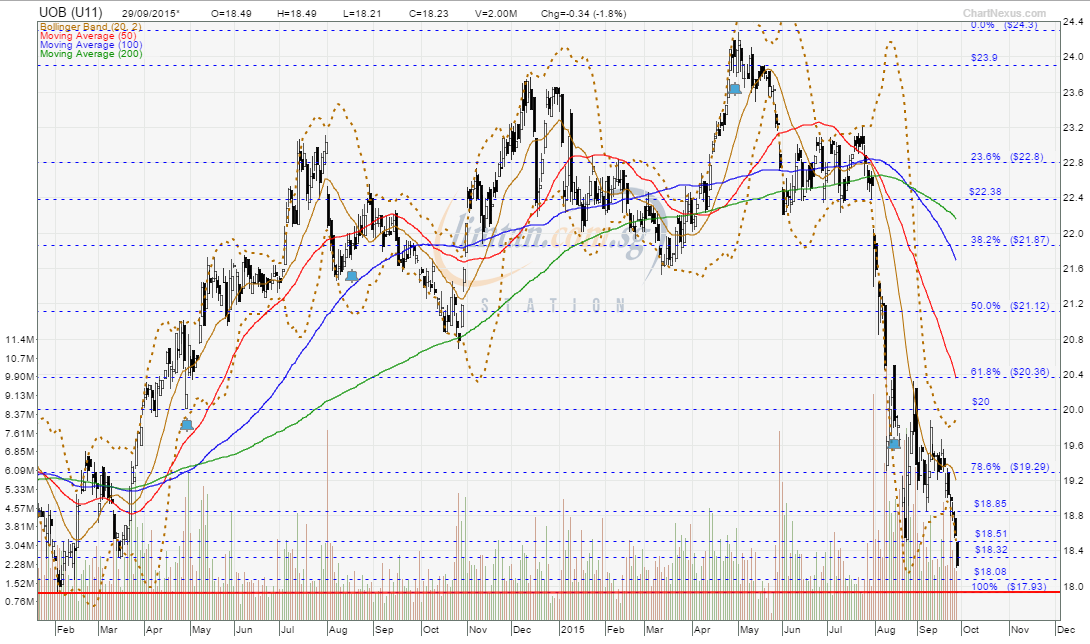
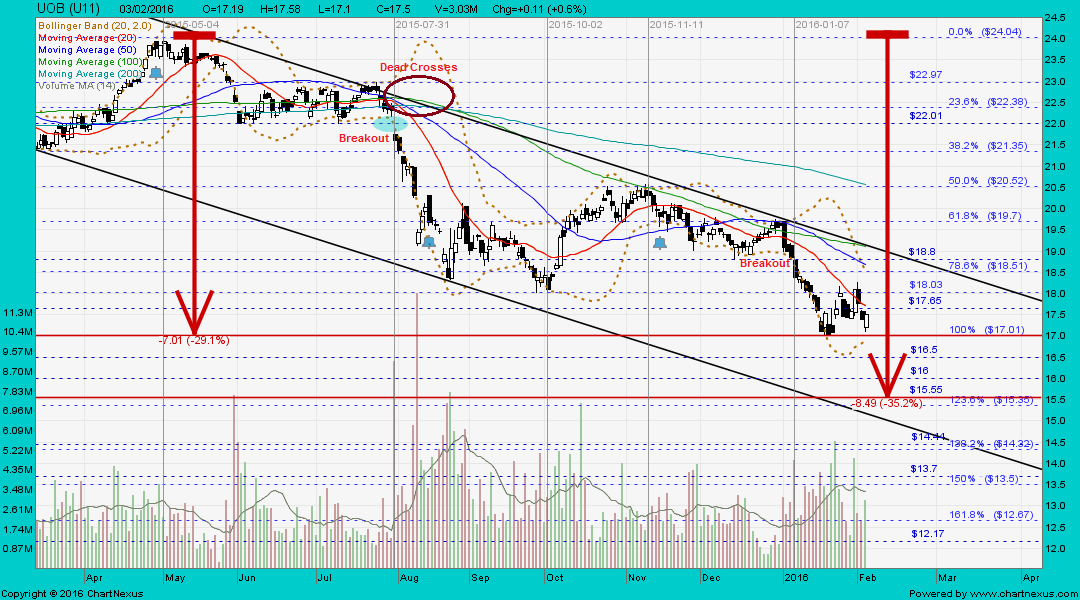
Is UOB possibly a bargain now? ~ 29 Feb 2016
UOB gets nod to sue over inflated home loans for Sentosa Cove condo ~ 29 Feb 2016
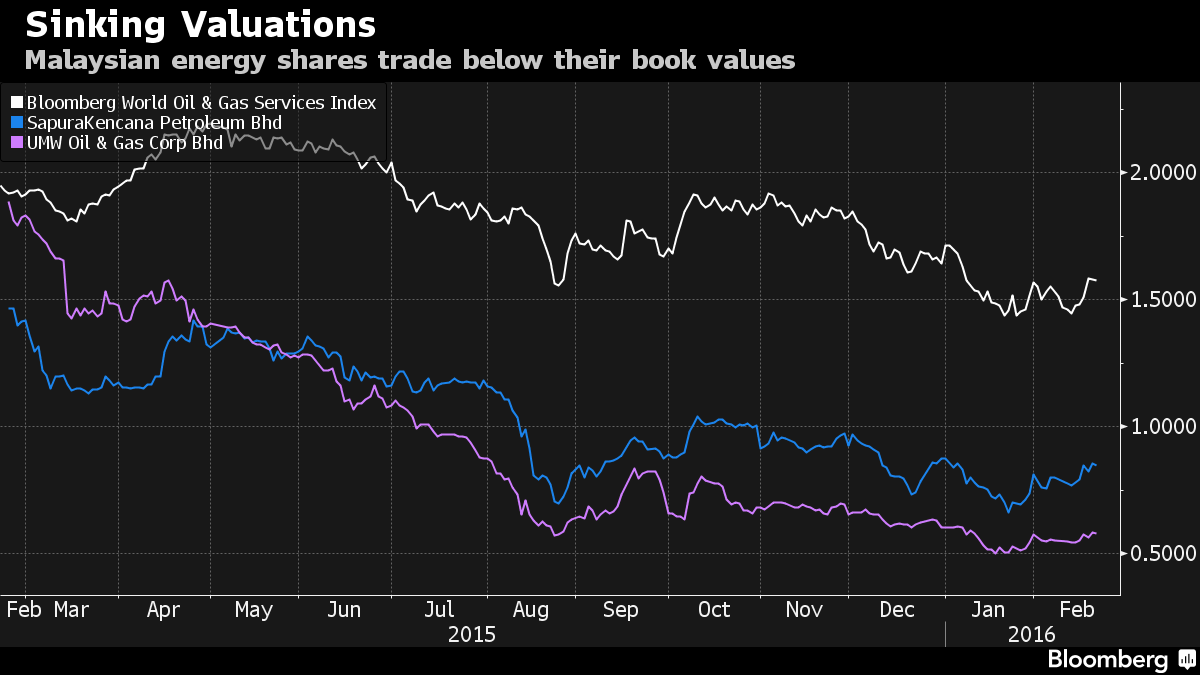
Short Singapore banks ~ 2 Mar 2016
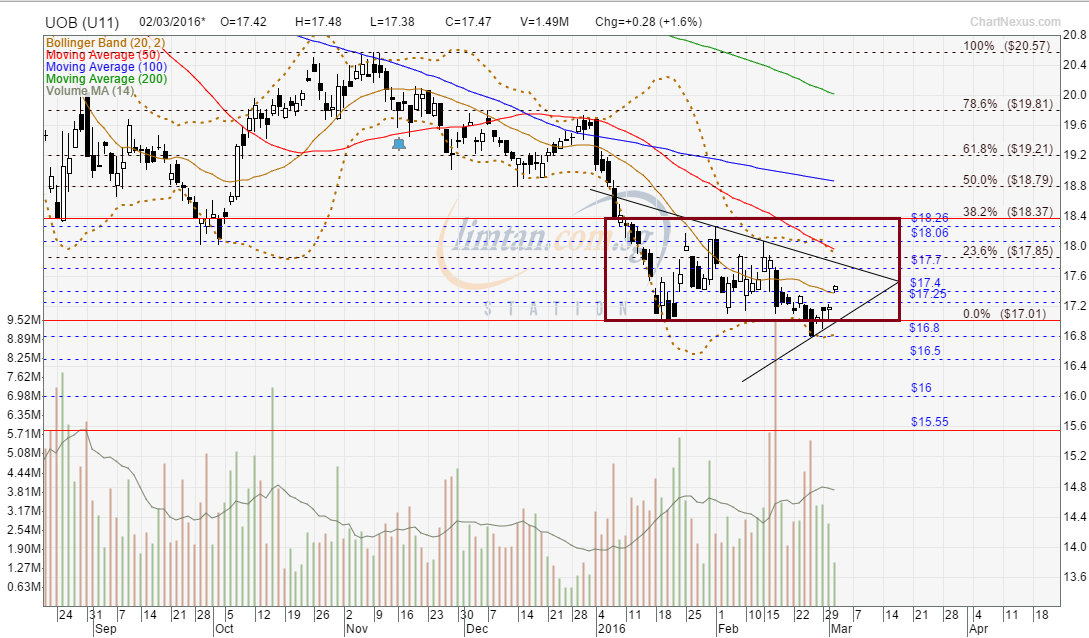
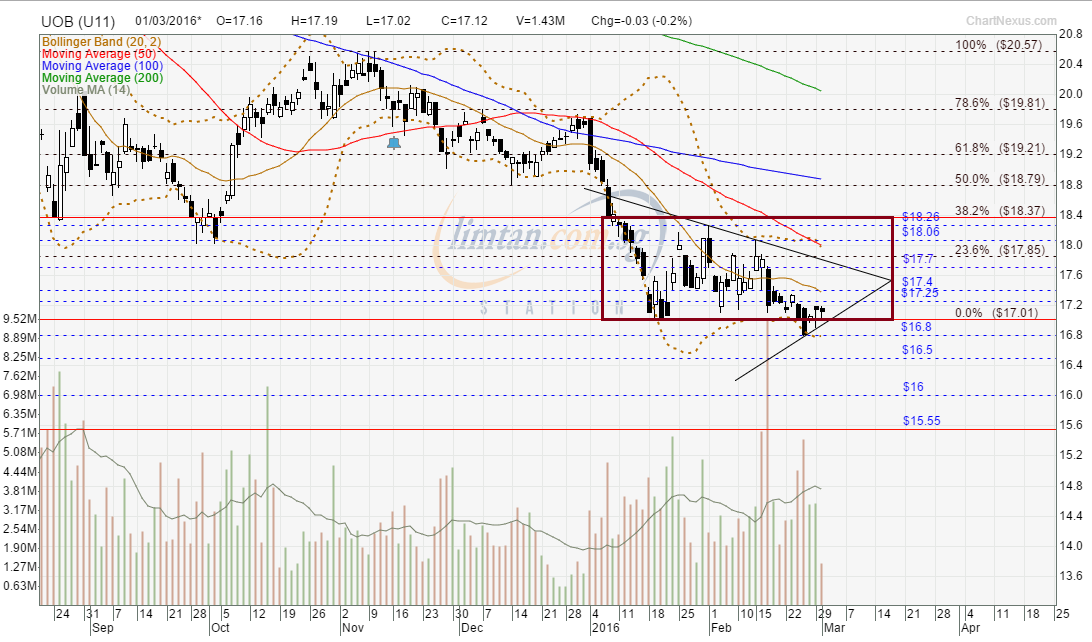
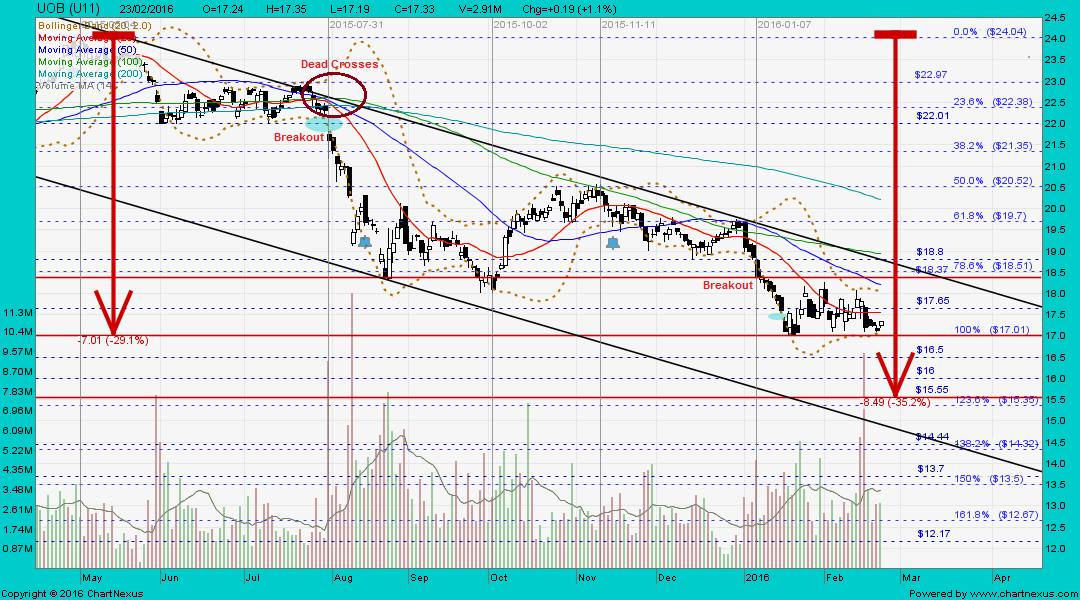
UOB ~
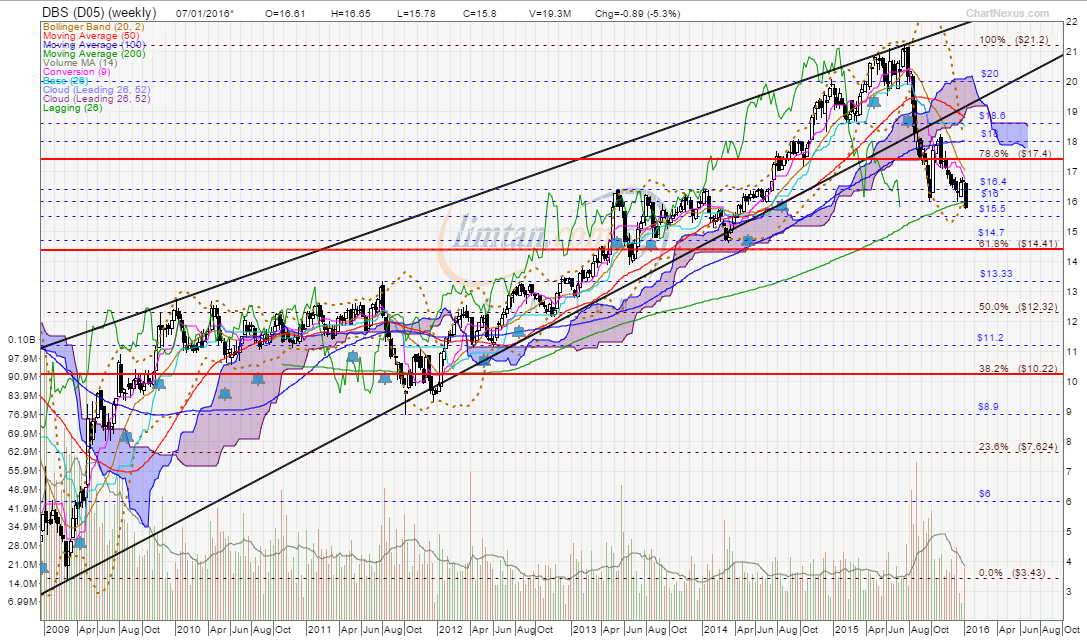
Major bearish trend reversal with 5-wave down, interim TP S$15.55, next TP S$12.17UOB gapped up with a white marubozu and traded @ S$17.47
(+0.28, +1.6%) with 1.49m shares done on 2 Mar 2016 at 1025 hrs.
Immediate support @ S$17.25, immediate resistance @ S$17.70.
 When stocks are more affordable, but not cheaper
By Cai HaoXiang
19 Jan 2015
IF you are a stock picker, and don't have much money to spare, the cut in standard board lot sizes from 1,000 to 100 shares will help.
But don't get too excited. It has become more affordable to begin a position in UOB, sure. You just need to fork out a couple of thousand dollars instead of rustling up twenty grand. But is UOB cheaper than say, six years ago on March 9, 2009, when one lot cost an investor S$8,200?
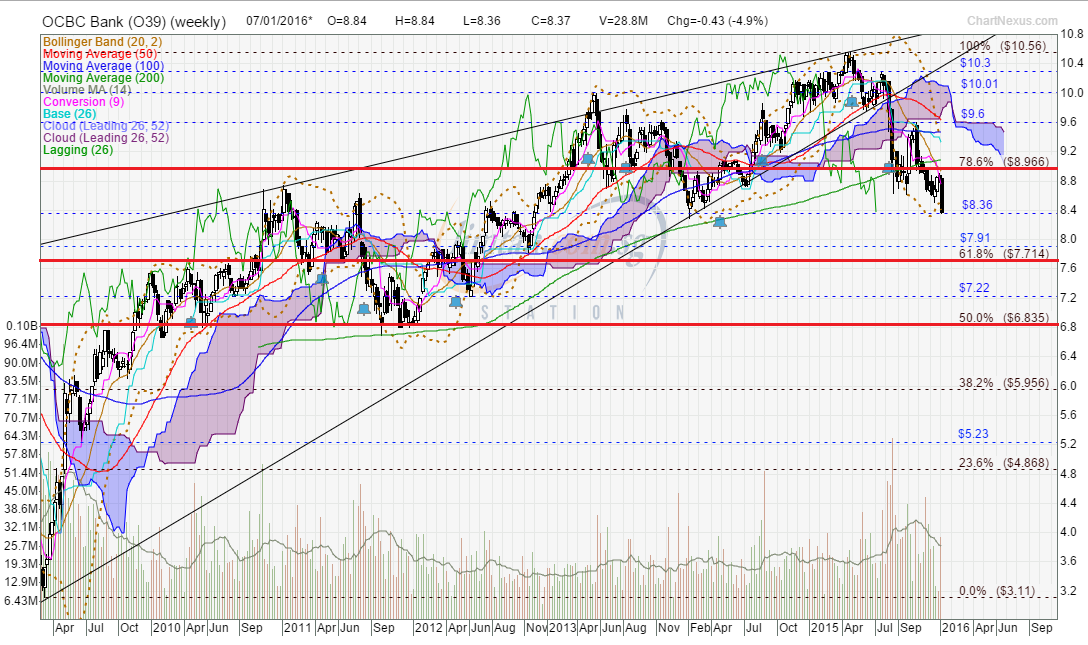
UOB's weekly chart as at 7 Jan 2016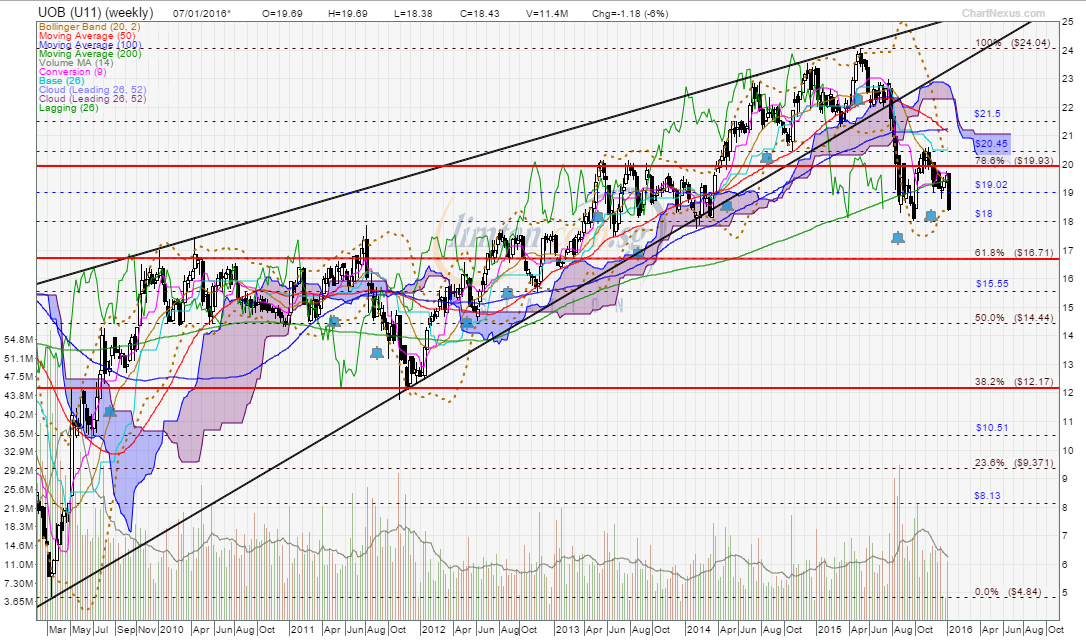
Understanding the difference between what is cheap and what is affordable is one of the first key lessons of investing in stocks.
A stock's true value is not determined by its absolute share price. This is because absolute share prices can change easily by changing the number of shares issued.
If I have a business that the market has determined to be worth S$1 million, but I only have 10 shares issued, each share is worth S$100,000. If I have a million shares issued, each share is worth just S$1. If I run my business well and it is now worth S$2 million, then no matter how many shares you have, you will see a similar doubling of your money.
Twenty years ago, Berkshire Hathaway, the investment vehicle of famed investor Warren Buffett, cost over US$20,000 a share. Was it expensive? In hindsight, it was really cheap. Today, each share costs over US$200,000.
In investing, what matters is not the absolute share price, but what you are getting for every share.
UOB on March 9, 2009, was trading at 6.6 times its 2008 earnings of S$1.25 a share, and 0.92 times its 2008 net asset value (NAV) of S$8.90.
Translated into plain English, this meant that if earnings stay the same and the company distributed all its earnings in cash, shareholders will get back their money's worth in 6.6 years. Assuming accounting numbers are accurate, if UOB were dissolved and all its assets sold off right on the spot, you would be getting S$8.90 for every S$8.20 you paid.
Doesn't sound like a bad deal, except that the world was worried that earnings would drop, and that the bank's assets were worth less than what they were recorded for.
Multiple expansionUOB on Jan 15, 2015, was trading at about 12 times its earnings for the last 12 months, and 30 per cent above its last reported NAV.
In essence, you are paying a bigger premium for the bank's earnings (you'll only "get back" your money's worth in 12 years instead of 6.6), and you are also paying more than what the company is worth on its books.
Obviously, in this situation, you are far more optimistic about what the company is worth. The technical term to explain this sentiment shift is "multiple expansion".
It's like saying that a cup of coffee is still going to keep me awake for the next three hours, not more, not less, but I'm willing to pay double for it.
Regardless of what UOB's underlying earnings or NAV is, the market is willing to pay a higher multiple of its earnings or NAV now, simply because the world is a less scary place than it used to be.
Multiple expansion, together with an increase in the underlying earnings or NAV of a company, explains why stock prices go up.
However, if stock prices go up because of multiple expansion and not because of an increase in earnings, it means the stock is now more expensive relative to what you are getting.
This is what analysts mean when they say a stock has become more expensive. It has nothing to do with share prices, which can be changed by issuing more shares, doing share splits, or consolidating the number of shares the company has.
Here's another poser: Just because UOB seems more expensive now, should you stay away from it?
The classic dilemma facing investors looking at a company that has undergone multiple expansion is: will the company's growth and good earnings continue into the future? Will things flatten out or go downhill?
UOB's five-year NAV growth rate works out to more than 8 per cent a year. Earnings have meanwhile been growing at roughly 11 per cent a year.
Assuming this stellar growth record continues for the next five years, UOB might have a net asset value of S$24.26 by end-2019. Earnings per share could be in the realm of S$3.50.
If that's the case, today's share price seems like a bargain - that is, cheap. You are essentially paying at below book value and less than seven times earnings for what the bank might generate five years from now.
However, if you think UOB's earnings will stall, then you wouldn't want to pay so much.
One way to get a grip on market sentiment is to use historical data. Look back 10 years and you find that UOB traded at 1.4 times book on average and around 12 times earnings on average.
It seems like the market is currently paying just around the average that it was willing to pay in the past.
There were times when it was willing to pay much more, and times, like March 2009, when it was willing to pay much less. If UOB were suddenly trading at three times book value or 30 times earnings, you might wonder whether the situation can be sustained.
Mean reversionThe belief that stocks or market sentiment revert to historical averages is what is known as "mean reversion". People who believe in this buy a stock when it is trading significantly below its historical average valuation, and sell when it is trading significantly above.
However, if things have fundamentally changed with a company, mean reversion does not work.
Other than relying on quantitative measures such as historical multiples, the market also prices stocks by assessing their business circumstances.
Banks make money from lending money to consumers as well as businesses and charging them interest. They fund their loans by taking in deposits and paying out lower deposit rates than the interest rates they charge for borrowing. Banks also have a sizeable non-interest income segment, getting money from charging credit card fees, trading and investment, and fund management.
There are reasons to stay cautious on UOB's growth, for example. It is not usual for a bank as conservatively run as UOB to keep growing at double-digit rates as it has done in the aftermath of the global financial crisis.
On the consumer side of the equation, new housing and car loans given out are falling dramatically, due to regulatory curbs on borrowing and a slowdown in the property market.
Other factors affect future income. Interest rates could go up and increase the spread banks earn from taking in deposits and lending to customers. Or interest rates could go up more slowly than people expect, causing the promised growth in income to materialise later.
Growth is coming from loans made in China, with UOB saying it is planning to keep up double-digit revenue growth there in the next five years. Yet, among the three banks here, UOB has the smallest exposure there, so China has yet to become a significant contributor to earnings.
What makes a stock cheap or expensive also goes beyond earnings and net asset valuation multiples.
One indicator is the strength of a company's cash flow. Another is the dividend it pays out relative to how much it is making. Yet another indicator concerns how much debt it is taking on.
To sum up, an investor has to weigh numerous factors when buying a stock. The terms cheap or expensive should only be applied relative to fundamental numbers such as valuation multiples, cash flows or dividends, never absolute prices.