|
|
Post by sptl123 on Mar 26, 2015 12:59:28 GMT 7
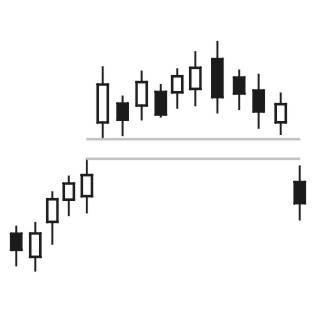 An island top chart pattern usually forms a rounding top b4 the price moves down fast and furious, and it takes time and patience to wait for the right price level to short for a bigger profit margin. However, if you've fast nimble fingers and keen to play among the daytraders scalping for afew bids of profit intraday (long and short), you must use the hourly/minute chart for quick-in-quick-out trades as the price is currently ranging bet. US$7.60 to US$7.22 (play the 38c trading range within a rectangle). To short-sell HKLand aggressively, it's advisable to piggyback on the Algo trading program, i.e. wait for a long black marubozu / the Algo traders to trigger @ US$7.22, for a decisive short-sell confirmation. (See Algo traders @ S$3.70 in Super Group.) Based on HK Land's ichimoku chart, once the critical support @ US$7.22 is broken convincingly with extremely high volume (2X of 4.2m shares), HKLand is likely to poke thru TP US$6.85 and hit US$6.69 to close the big gap created on 7 Jan 2015 and go much further down.
HK Land ~ Island Top formation, biased to the downside, interim TP @ US$6.85HK Land traded @ US$7.27 (-0.11, -1.5%) with 1.07m shares done on 26 Mar 2015 at 1.10pm. Critical support @ US$7.22, immediate resistance @ US$7.60. 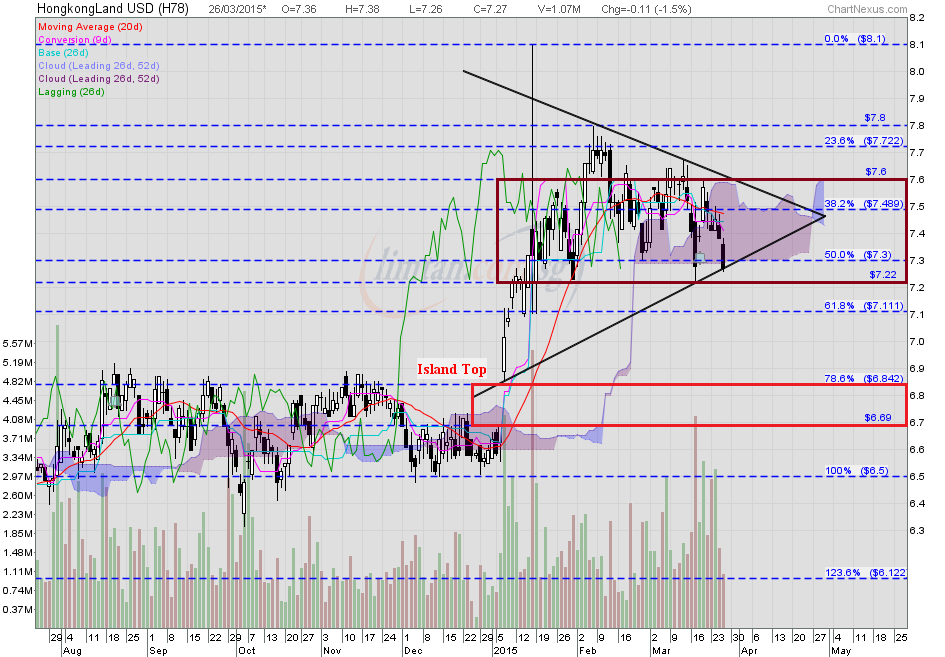
I wonder that is because I have no luck? no gut? or no skill?  |
|
|
|
Post by zuolun on Mar 26, 2015 13:32:49 GMT 7
Very sayang ! I closed the short position 17 bids too little and too early.
I wonder that is because I have no luck? no gut? or no skill? , HK Land is a good trading stock (it has been ranging up and down within a certain trading range; plenty of meat for long & short daytraders) but the algo traders will sure come back again with a vengeance to kill both the long and short daytraders.  Unlike the stock, POSH, a confirmed target for shorts...todate.  |
|
|
|
Post by zuolun on Apr 1, 2015 13:29:42 GMT 7
Very sayang ! I closed the short position 17 bids too little and too early.
I wonder that is because I have no luck? no gut? or no skill? , HK Land is a good trading stock (it has been ranging up and down within a certain trading range; plenty of meat for long & short daytraders) but the algo traders will sure come back again with a vengeance to kill both the long and short daytraders. Unlike the stock, POSH, a confirmed target for shorts...todate. , Heng argh!! You run road on your HK Land short position earlier...else now kena short squeeze, die pain pain liao... Risk on Hong Kong property developer revaluation gains from 2009 to 2013 ~ 30 Jan 2015 HK Land ~ Island Top formation, biased to the downside, interim TP @ US$6.85HK Land traded with a shooting star @ US$7.62 (+0.07, +0.9%) with 770,000 shares done on 1 Apr 2015 at 2.20pm. Critical support @ US$7.22, immediate resistance @ US$7.60. 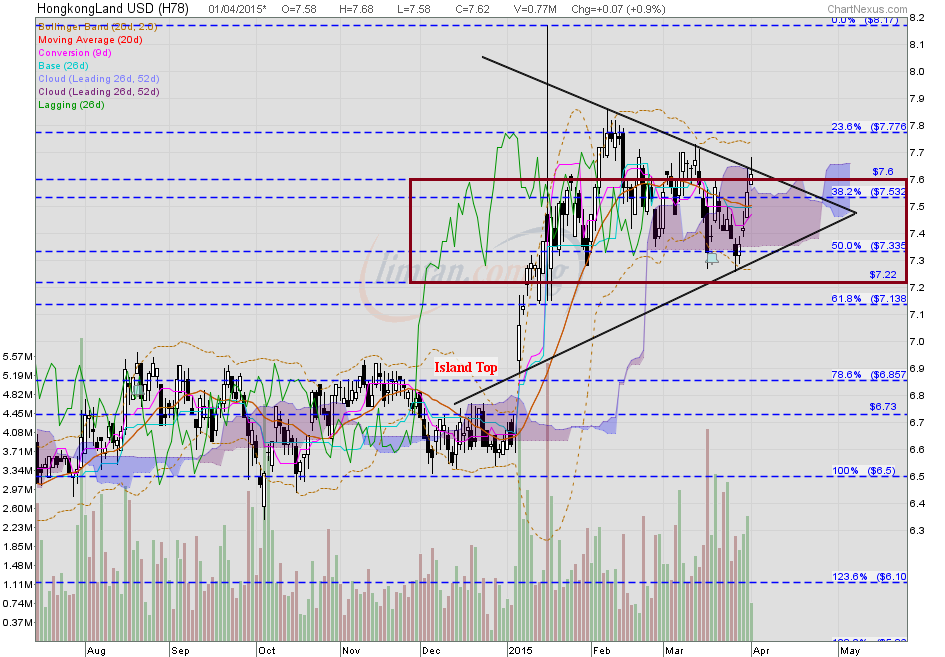 |
|
|
|
Post by sptl123 on Apr 1, 2015 14:10:06 GMT 7
sptl123, Heng argh!! You run road on your HK Land short position earlier...else now kena short squeeze, die pain pain liao... Risk on Hong Kong property developer revaluation gains from 2009 to 2013 ~ 30 Jan 2015 HK Land ~ Island Top formation, biased to the downside, interim TP @ US$6.85HK Land traded with a shooting star @ US$7.62 (+0.07, +0.9%) with 770,000 shares done on 1 Apr 2015 at 2.20pm. Critical support @ US$7.22, immediate resistance @ US$7.60. Yes Sir ! me very the heng  . I have taken new short positions today  . Thank you Bro Zuolun. |
|
|
|
Post by sptl123 on Apr 1, 2015 23:27:52 GMT 7
Bro Zuolun, Is HKLand forming an Adam & Eve Double Bottom? I watch FinVidsDotCom, it seems that the chart do not quite meet the criteria of a double bottom but I need to be vigilant as I have short position .  |
|
|
|
Post by zuolun on Apr 2, 2015 9:18:14 GMT 7
Bro Zuolun, Is HKLand forming an Adam & Eve Double Bottom? I watch FinVidsDotCom, it seems that the chart do not quite meet the criteria of a double bottom but I need to be vigilant as I have short position . , It's not a double bottom. Set a tight stop loss and run for you life!HK Land has a bullish symmetrical triangle breakout; a symmetrical triangle is a 50/50 bet. It managed to trade above all the 4 SMA, with a bullish crossover showed on the stochastic (14,3,3). The spike in prices past 4 days (due to short-covering) is similar to the one in early Jan 2015. Moody's: Hongkong Land's 2014 results support its ratings ~ 11 Mar 2015 Risk on Hong Kong property developer revaluation gains from 2009 to 2013 ~ 30 Jan 2015 HK Land ~ Bullish symmetrical triangle breakout, interim TP US$7.86, next TP US$8.17HK Land closed with an inverted hammer @ US$7.63 (+0.08, +1.1%) with 1.4m shares done on 1 Apr 2015. Immediate support @ US$7.53, immedfiate resistance @ US$7.73. 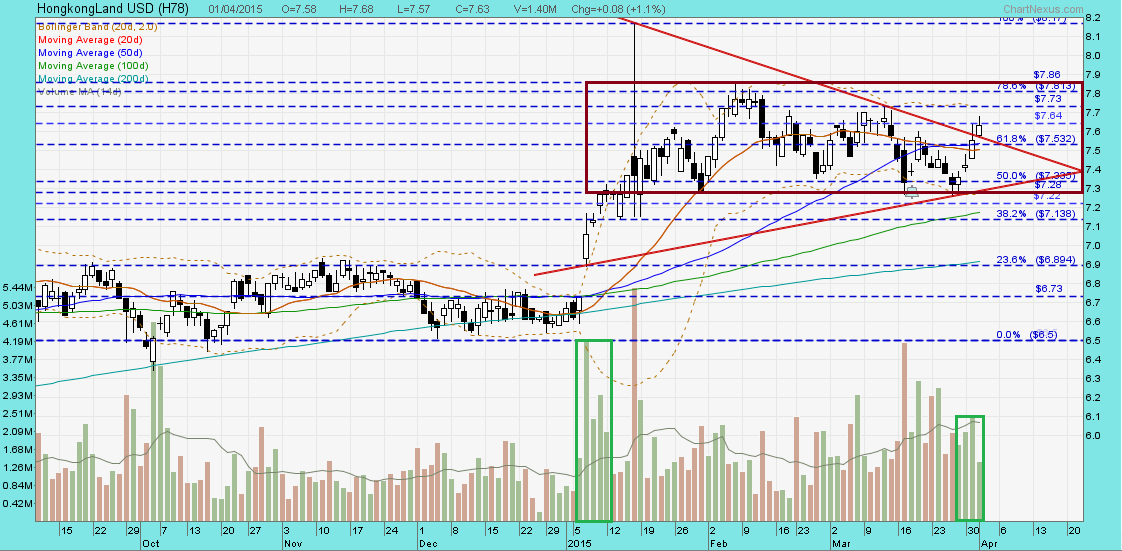 Scalping with Stochastics Scalping with Stochastics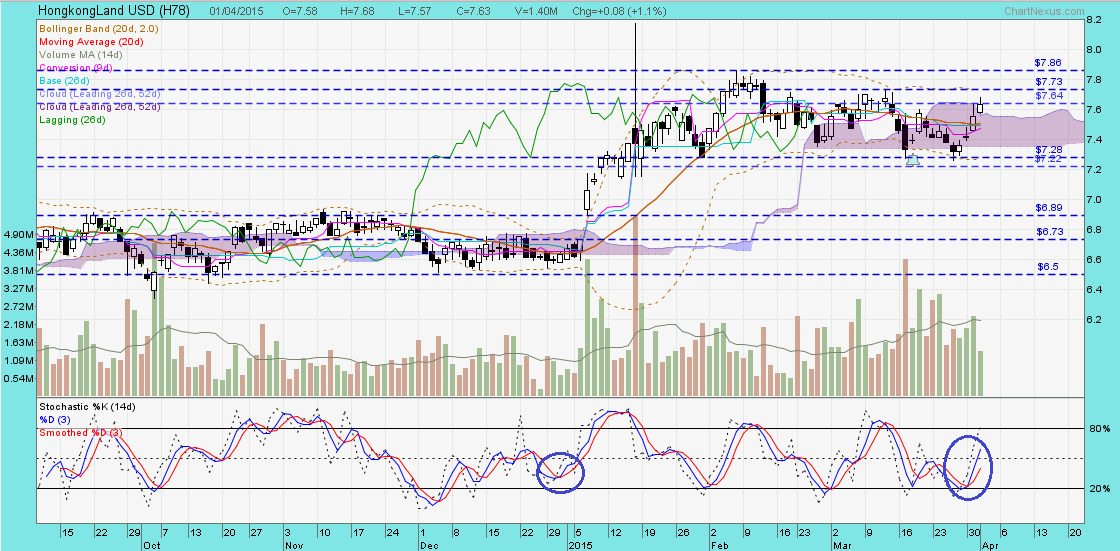 |
|
|
|
Post by zuolun on Apr 12, 2015 11:42:23 GMT 7
HK Land ~ Potential Island Top ReversalHK Land closed with a spinning top @ US$7.50 (-0.12, -1.6%) with 2.76m shares done on 10 Apr 2015. Immediate support @ US$7.42, immediate resistance @ US$7.74. 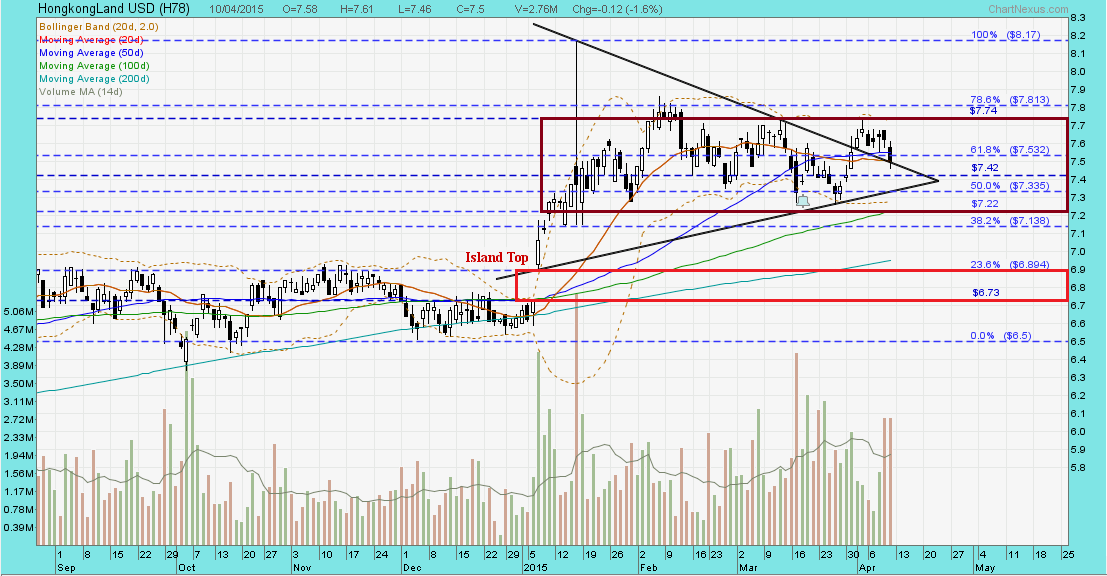 Scalping with stochastics Scalping with stochastics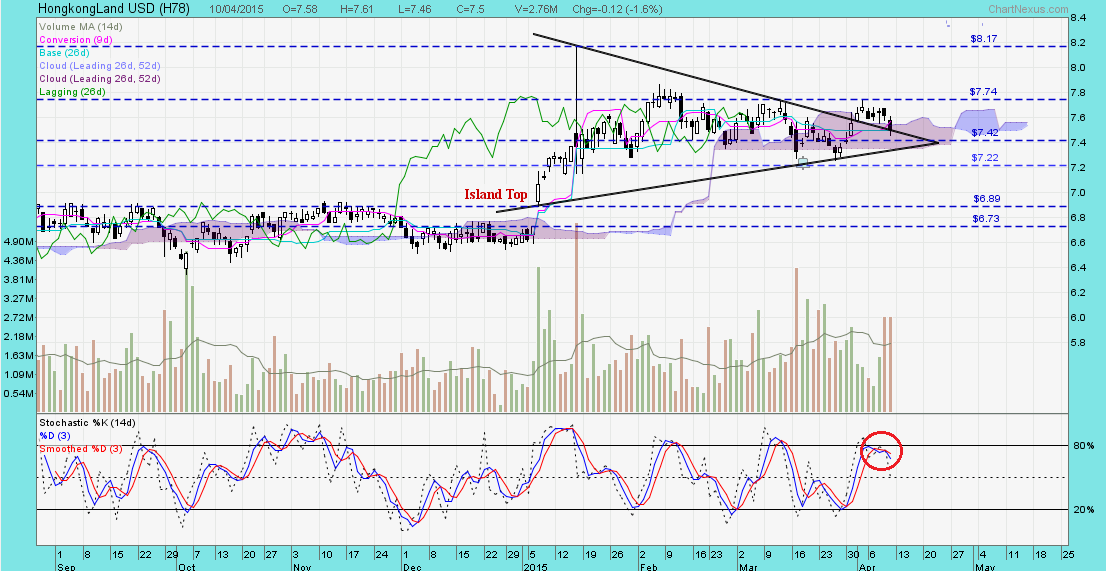
|
|
|
|
Post by zuolun on Nov 2, 2015 11:43:54 GMT 7
HK Land ~ Bearish Gartley formationHK Land gapped down with a hammer and traded @ US$7.34 (-0.17, -2.3%) with 1.53m shares done on 2 Nov 2015 at 1235 hrs. Immediate support @ US$7.20, immediate resistance @ US$7.48. 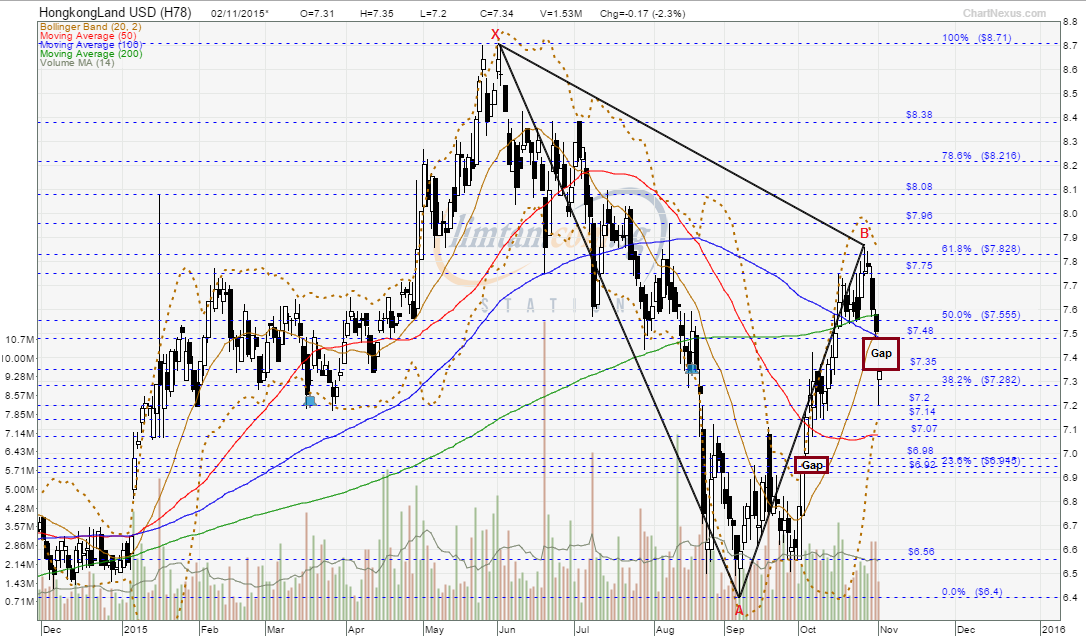 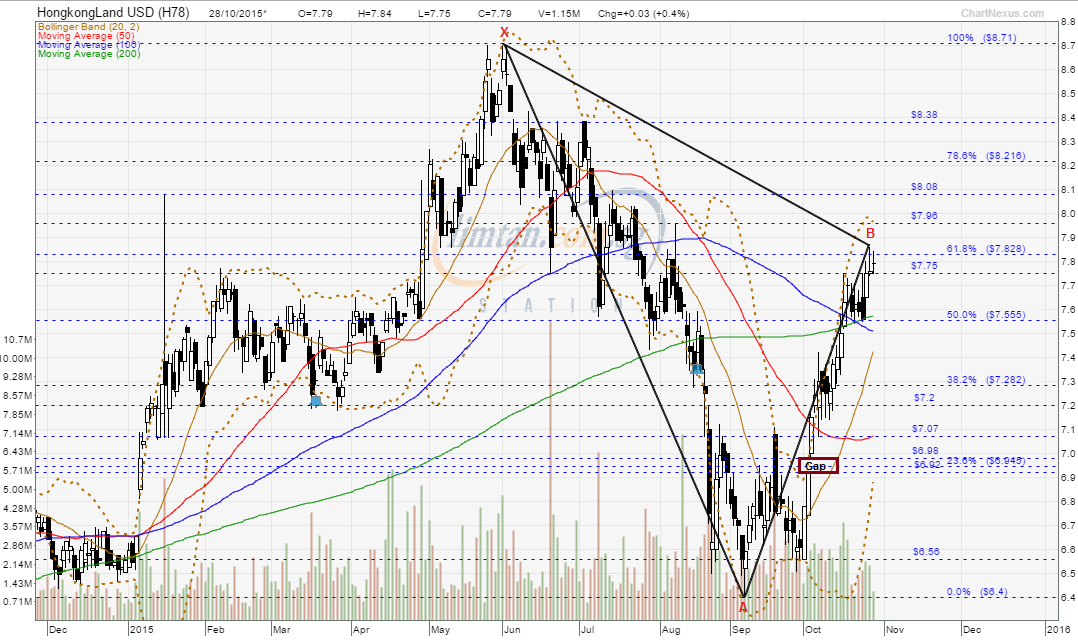
|
|
|
|
Post by zuolun on Feb 3, 2016 13:28:39 GMT 7
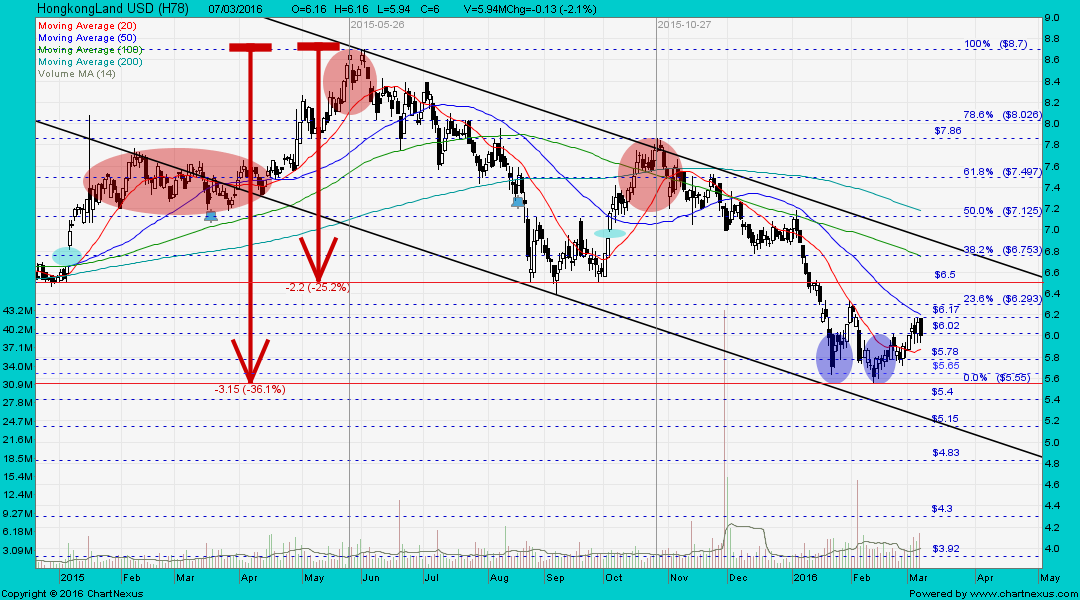
On the chart, bear means the share price is trending down, bull means the share price is trending up; make sure you're betting on the right side of the game to make a good profit. Round 1 goes to the bears ~ 30 Jan 2016 Examples of bull charts: Vivocom and SLP ~ 3 Feb 2016 HK Land ~ Trading in a downward sloping channel, interim TP US$4.83, next TP US$4.30HK Land had a long black marubozu and traded @ US$5.78 (-0.39, -6.3%) with 11.8m shares done on 3 Feb 2016 at 1410 hrs. Immediate support @ US$5.64, immediate resistance @ US$6.12. 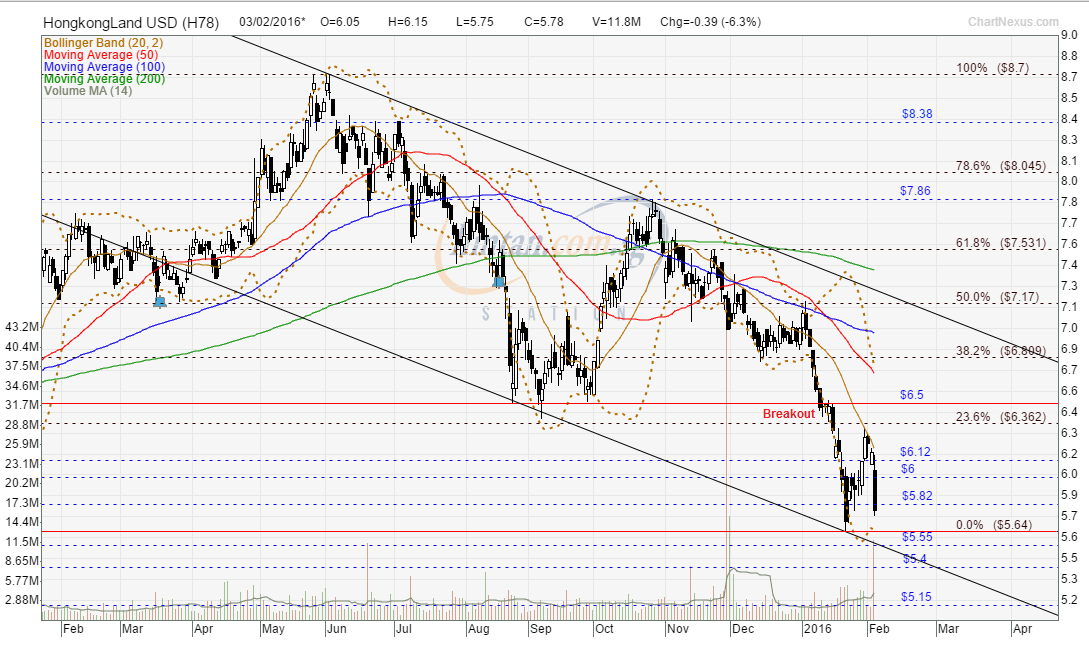 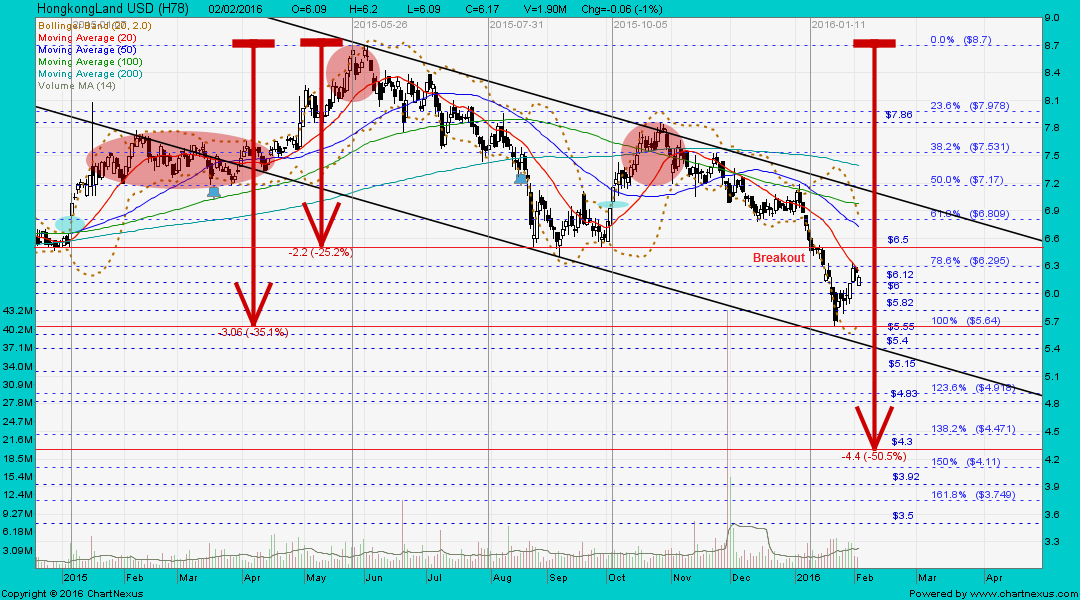 HK Land had peaked @ US$8.70 on 3 Jun 2015, it's now riding on wave-iii of wave-v of A-wave of the corrective ABC-wave down. HK Land (weekly as at 8 Jan 2016) ~ Uptrend is broken, downward bias, interim TP US$4.83, next TP US$4.30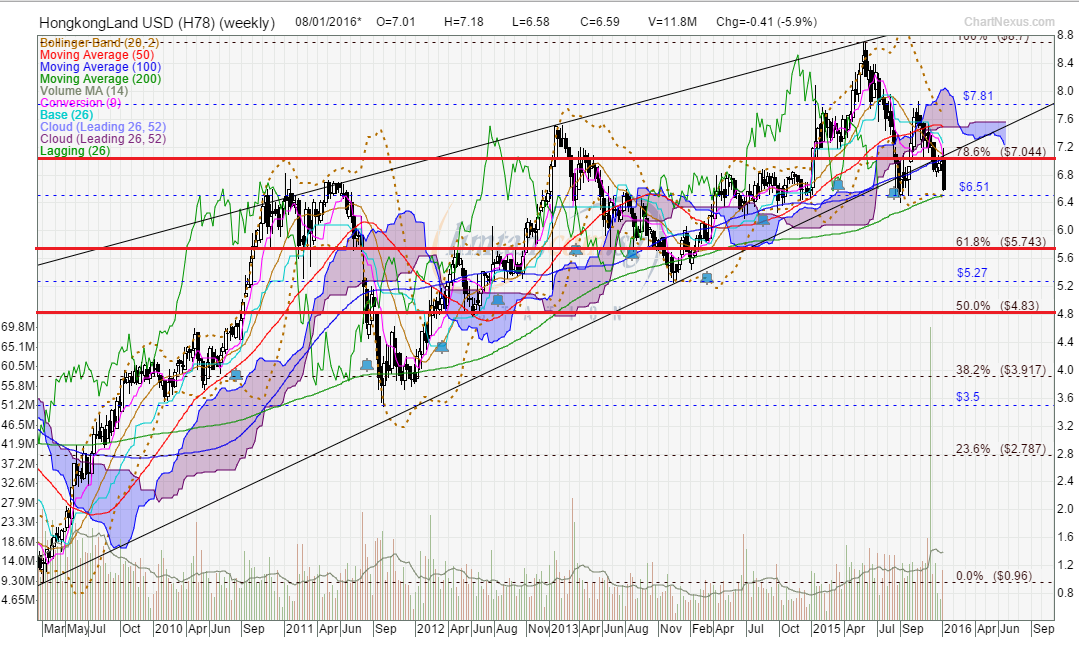 HKland ~ The Elliott Wave pattern as at 30 Aug 2013 HKland ~ The Elliott Wave pattern as at 30 Aug 2013 |
|
|
|
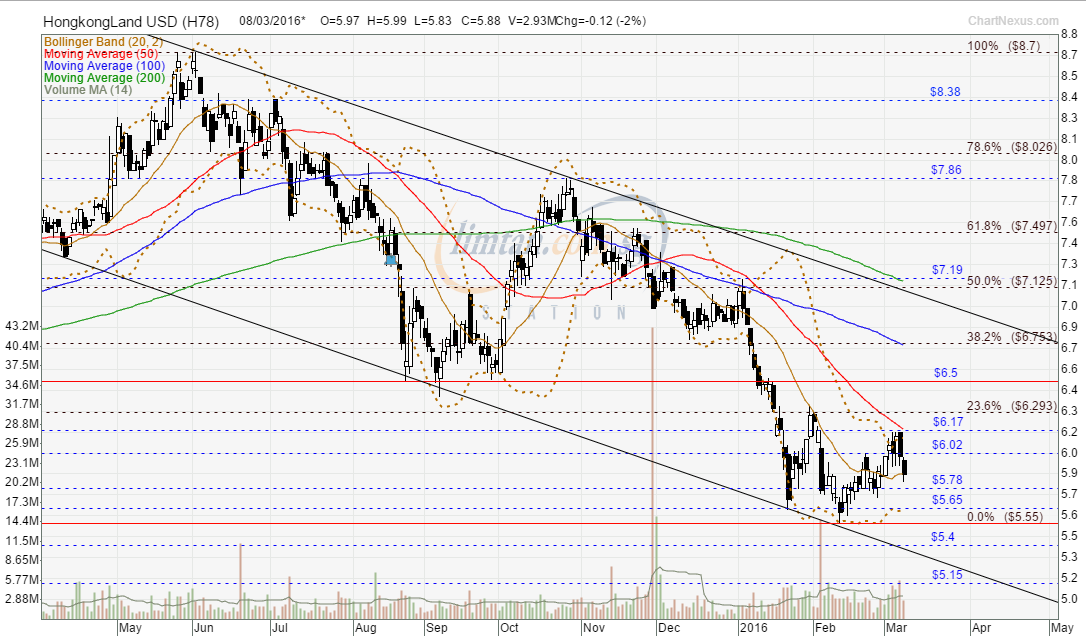
Post by zuolun on Mar 8, 2016 12:21:09 GMT 7
|
|


 .
. .
.