|
|
Post by zuolun on Nov 18, 2013 10:49:17 GMT 7
|
|
|
|
Post by zuolun on Apr 24, 2014 8:36:03 GMT 7
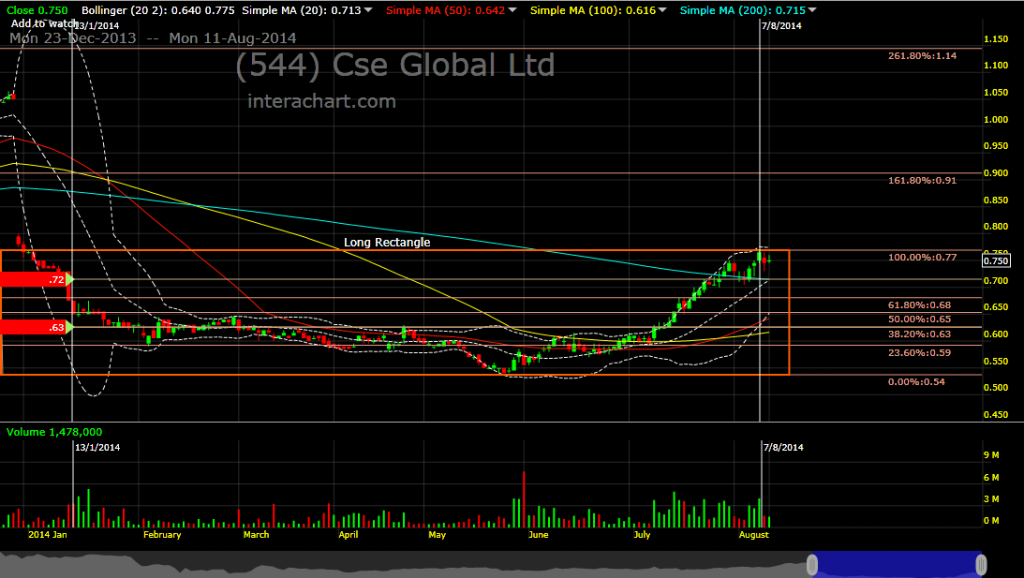
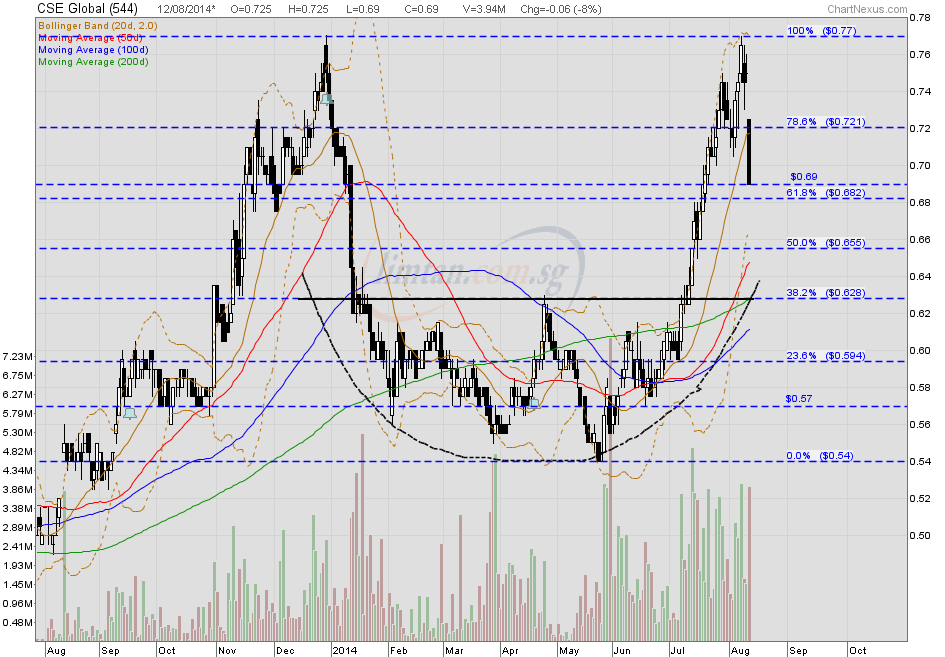
CSE Global names Eddie Foo Toon Ee as group CFO — 11 Apr 2014 CSE Global — Trading in a rectangleCSE Global had a drangonfly doji unchanged @ 0.605 with 16 lots done on 24 Apr 2014 at 9.20am. Immediate support @ 0.58, immediate resistance @ 0.615, strong resistance @ 0.645. CSE Global has been consolidating within a long rectangle since 13 Jan 2014 to date. The uptrend is broken, should the price break 0.58 and below, next support @ 0.51. Alternatively, if the strong resistance @ 0.645 is cleared convincingly with high volume, the uptrend will resume with a u-turn (whipsaw). Note: Only the current ichimoku chart is adjusted for the 28c special dividend + 2.5c final dividends, theoretically the share price is currently @ 0.91. 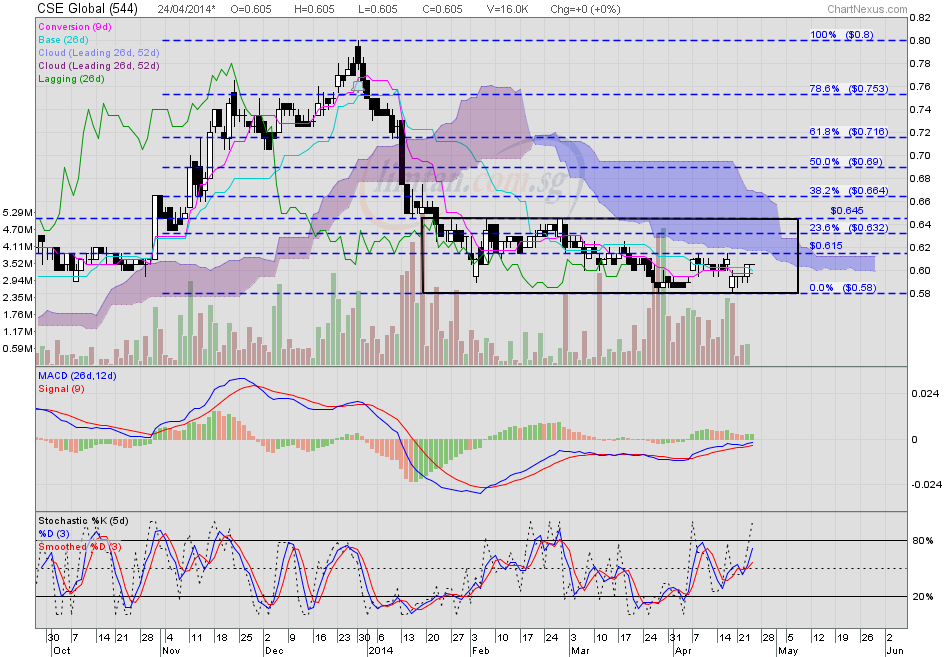 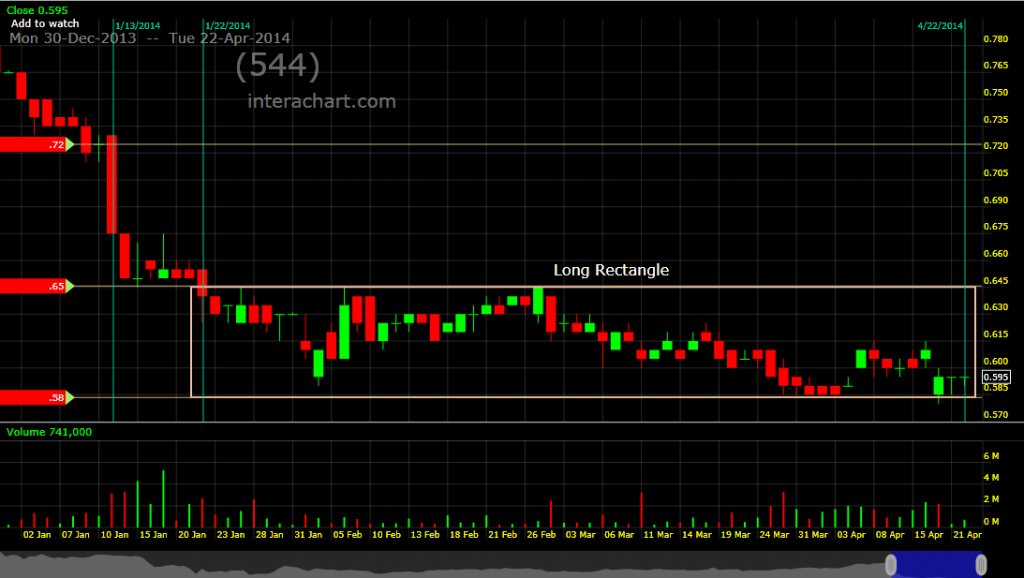 
|
|
|
|
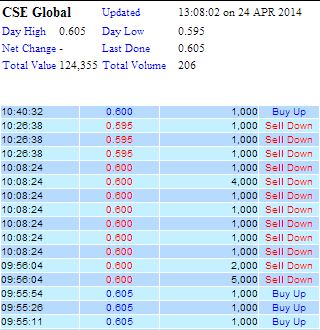
Post by zuolun on Apr 24, 2014 12:19:16 GMT 7
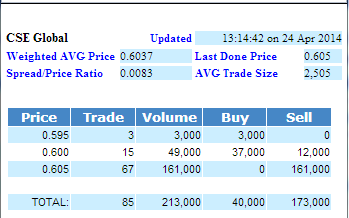
CSE Global — 1-lotter X 3 @ S$0.595 on 23 Apr 2014 at 10:26:38 hrs
|
|
|
|
Post by zuolun on May 15, 2014 10:38:07 GMT 7
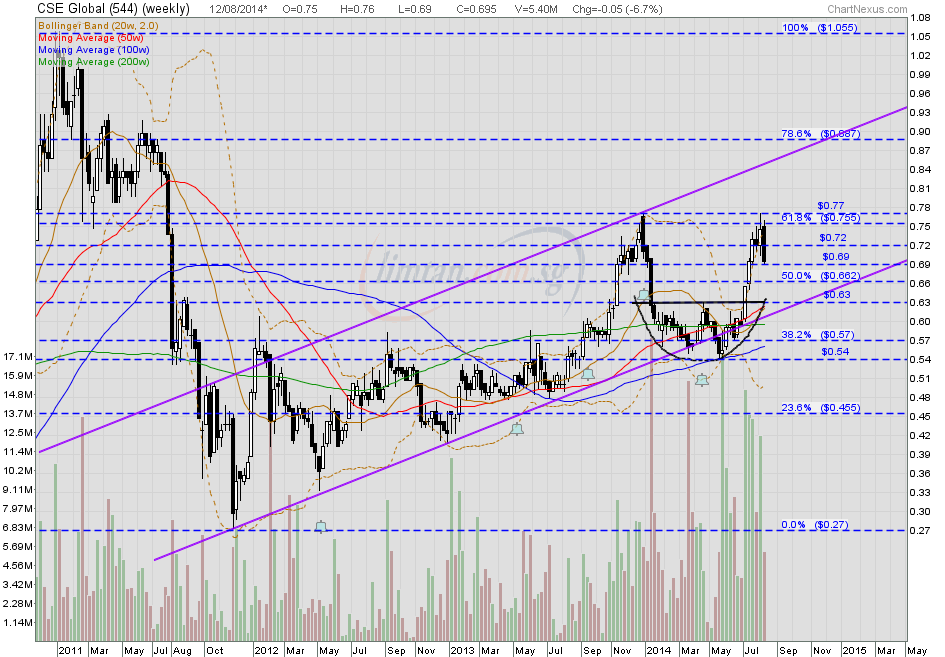
CSE Global — Trading in a rectangleCSE Global had a hammer @ 0.575 (-0.01, -1.7%) with 489 lots done on 15 May 2014 at 11.30am. Crucial support @ 0.55, immediate resistance @ 0.60, strong resistance @ 0.635. 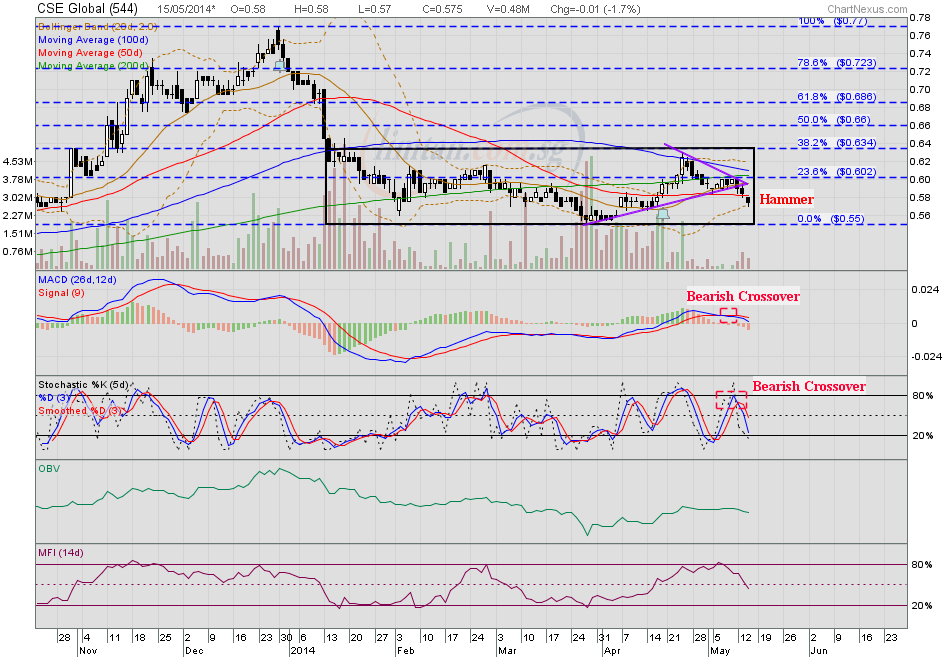 CSE Global (weekly) — Trading in an upward sloping channel CSE Global (weekly) — Trading in an upward sloping channel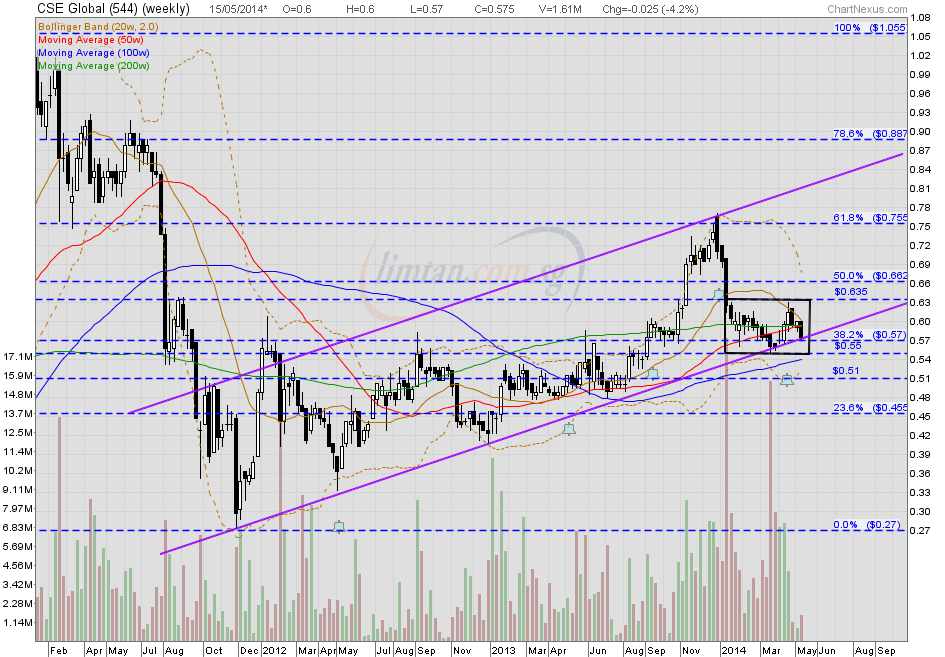
|
|
|
|
Post by zuolun on Aug 12, 2014 12:49:06 GMT 7
|
|
|
|
Post by firecrest on Aug 12, 2014 13:04:35 GMT 7
Hi, I think can accumulate once it hit the resistance $0.655 which you mentioned. It has good sustainable yield which is at least 3.5 cents given previous years. MR market might be over reacting to the news.
|
|
|
|
Post by zuolun on Aug 12, 2014 15:14:58 GMT 7
Hi, I think can accumulate once it hit the resistance $0.655 which you mentioned. It has good sustainable yield which is at least 3.5 cents given previous years. MR market might be over reacting to the news. Double Top Breakout is a bearish trend reversal chart pattern which may trigger a climatic sell off. If the key support @ S$0.63 is broken convincingly with extremely high volume; CSE Global is likely to retest the last low @ S$0.54 and hit lower low. Examples of Bearish Double Top Breakout chart pattern: MTQ and PS Group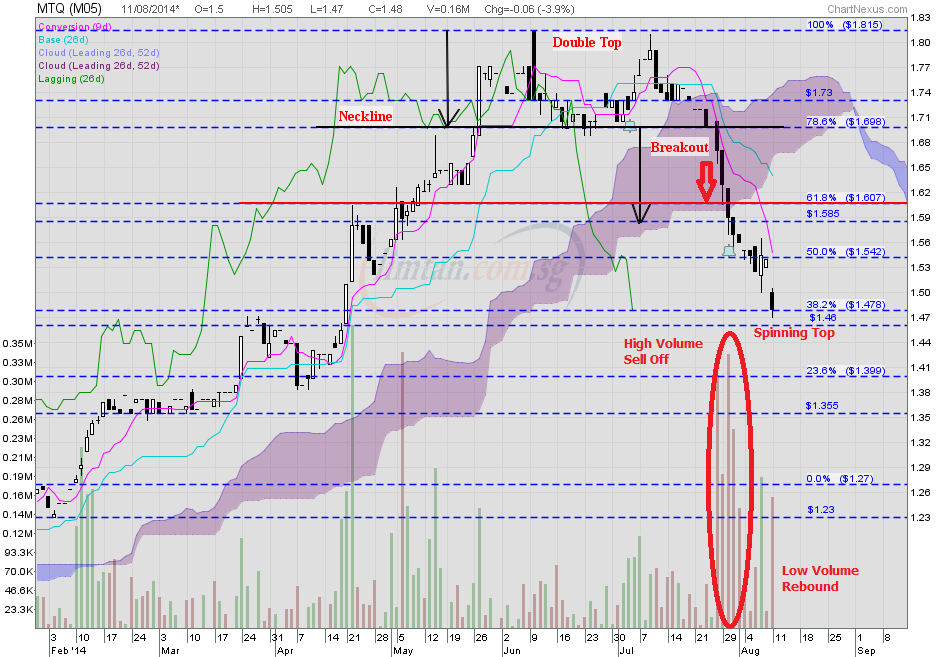 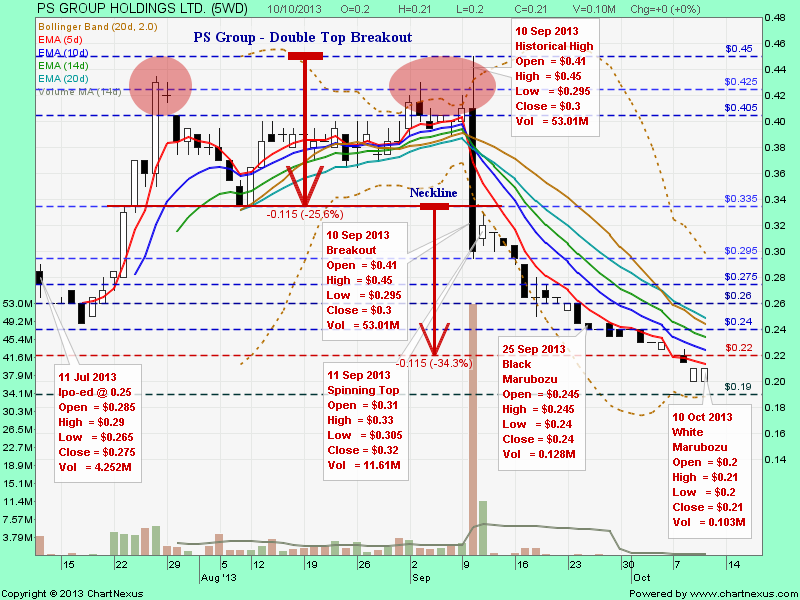 |
|
|
|
Post by firecrest on Aug 13, 2014 17:14:14 GMT 7
CSE Global rebounded strongly today. I wonder will it test the support level of $0.655 again.
|
|
|
|
Post by zuolun on Aug 13, 2014 18:25:16 GMT 7
CSE Global rebounded strongly today. I wonder will it test the support level of $0.655 again. CSE Global's price action today reminds me of RH PetroGas; strong hands short-squeezed the karteks forcing them to do short-covering. The next day, a black candle showed that strong hands reversed and shorted RH PetroGas with equally high volume...can play many rounds by repeating the same trick...  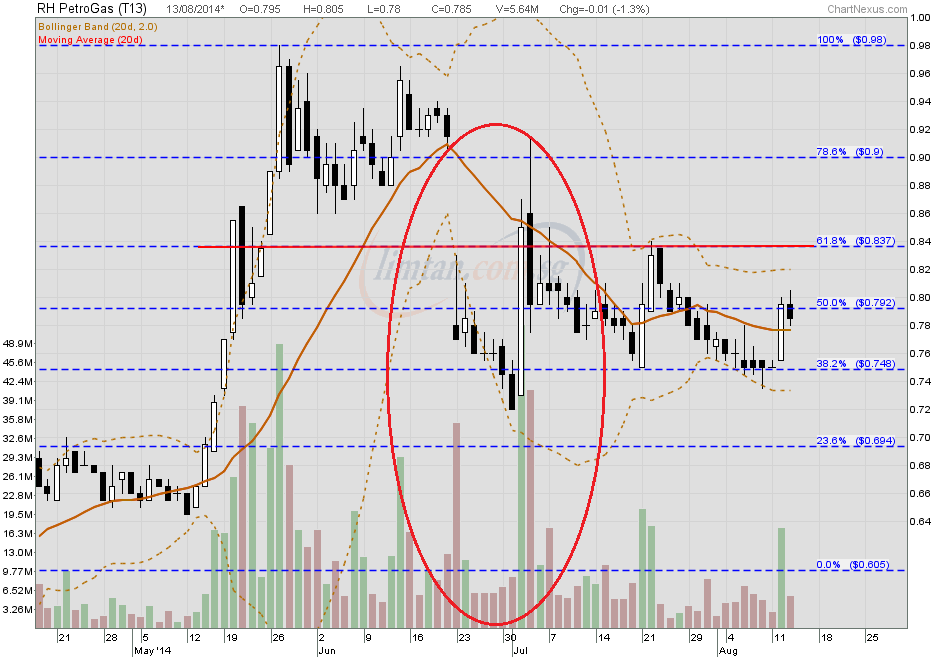 |
|
|
|
Post by zuolun on Sept 25, 2014 14:41:32 GMT 7
CSE Global — Head and Shoulders Breakout TP S$0.59, immediate support @ S$0.625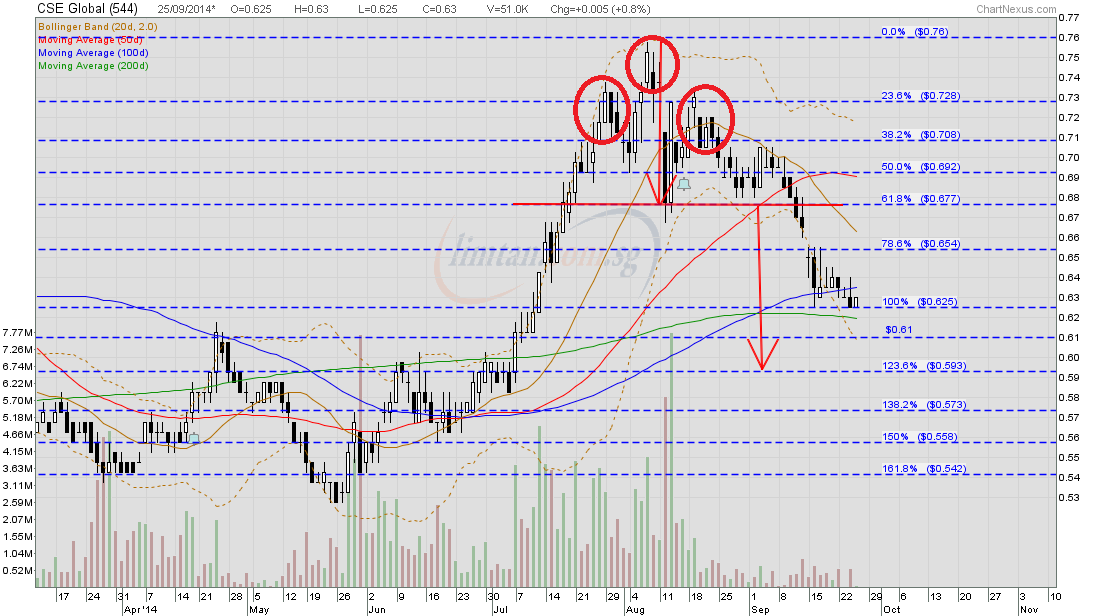 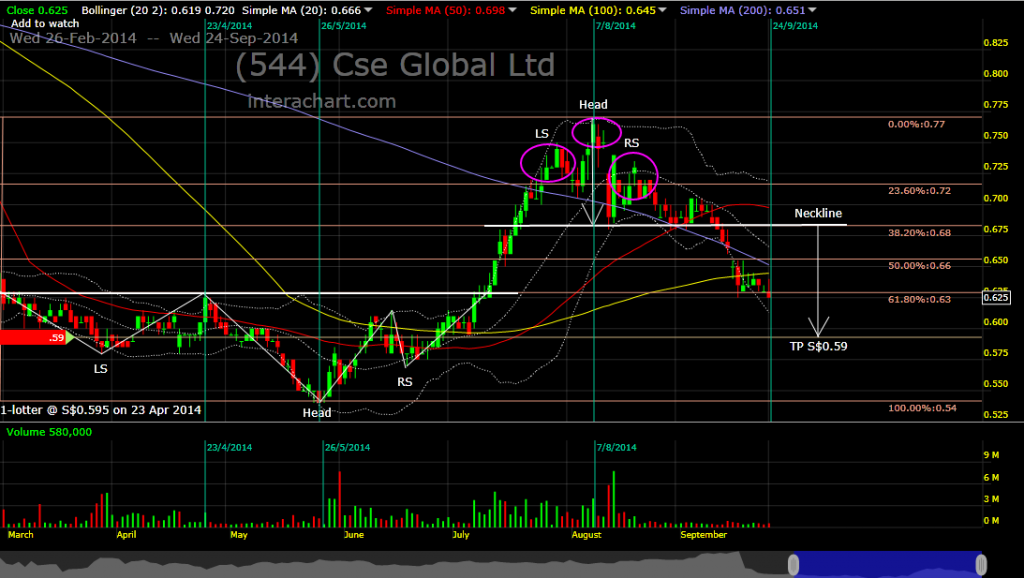
|
|
|
|
Post by zuolun on Dec 13, 2015 16:48:52 GMT 7
Double Top Breakout is a bearish trend reversal chart pattern which may trigger a climatic sell off. If the key support @ S$0.63 is broken convincingly with extremely high volume; CSE Global is likely to retest the last low @ S$0.54 and hit lower low. ~ 11 Dec 2015 CSE Global: OCBC reiterated 'BUY' TP S$0.58 ~ 13 Nov 2015 CSE Global ~ Trading in a downward sloping channel, interim TP S$0.36, next TP S$0.305CSE Global closed with a doji unchanged @ S$0.46 with extremely thin volume done at 67,500 shares on 11 Dec 2015. Immediate support @ S$0.455, immediate resistance @ S$0.47. 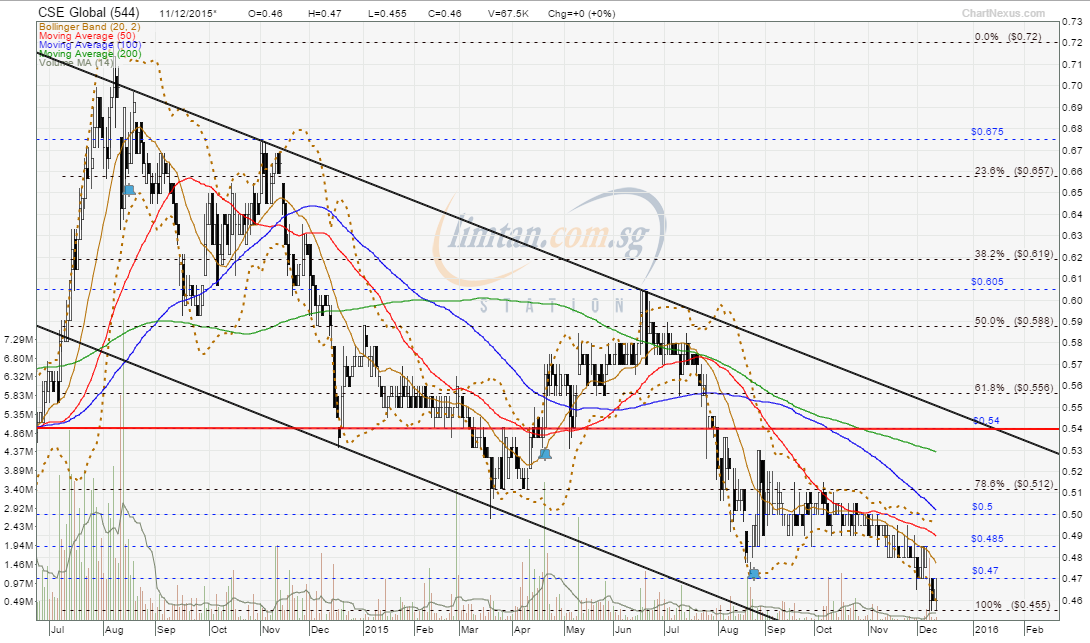 CSE Global (weekly) ~ The intermediate uptrend is broken, interim TP S$0.36, next TP S$0.305 CSE Global (weekly) ~ The intermediate uptrend is broken, interim TP S$0.36, next TP S$0.305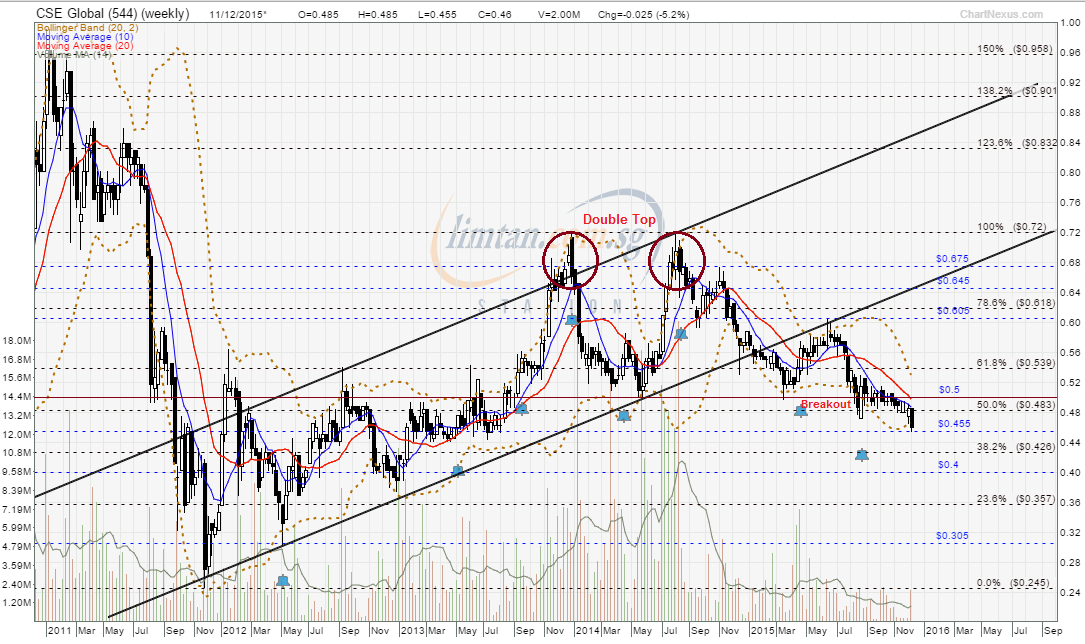 |
|


 [/URL]