|
|
Post by zuolun on Feb 16, 2015 15:14:39 GMT 7
|
|
|
|
UE
Feb 16, 2015 17:26:29 GMT 7
Post by simplemind on Feb 16, 2015 17:26:29 GMT 7
ZL bro,
so what do you think of UE now?
thanks
|
|
|
|
UE
Feb 16, 2015 17:59:46 GMT 7
Post by zuolun on Feb 16, 2015 17:59:46 GMT 7
ZL bro, so what do you think of UE now? thanks For all M&A plays, once the deal is off, it is logical that the big bears / short-sellers will take advantage of the -ve news to whack down the share price. |
|
|
|
UE
Feb 16, 2015 18:45:10 GMT 7
Post by simplemind on Feb 16, 2015 18:45:10 GMT 7
ZL bro,
mean that it will go down more from here?
thanks
|
|
|
|
UE
Feb 16, 2015 22:17:46 GMT 7
sptl123 likes this
Post by zuolun on Feb 16, 2015 22:17:46 GMT 7
ZL bro, mean that it will go down more from here? thanks Unless UE gets a new sugar daddy with better offer price; now no deal no honey, no honey no money. The current CH Offshore M&A play is a good example; the revised offer price @ S$0.55 per share (with additional new players joining) is much better than the old offer price @ S$0.495 per share. |
|
|
|
UE
Feb 18, 2015 10:35:01 GMT 7
oldman likes this
Post by zuolun on Feb 18, 2015 10:35:01 GMT 7
Charoen's United Engineers bid folds ~ ~ 16 Feb 2015 The shares fell 49 cents, or 15.5%, in the biggest decline since January 1998 to close at S$2.68 each, amid very active dealings that saw 26.9m shares changing hands. OCBC and its insurance arm Great Eastern Holdings, which owns significant stakes in UE, said in a joint statement on Saturday that they had failed to reach an agreement to sell their shareholding in the company to TCC Top Enterprise, a firm controlled by Thai billionaire Charoen. 
|
|
|
|
UE
Apr 2, 2015 22:52:25 GMT 7
odie likes this
Post by sptl123 on Apr 2, 2015 22:52:25 GMT 7
Charoen's United Engineers bid folds ~ ~ 16 Feb 2015 The shares fell 49 cents, or 15.5%, in the biggest decline since January 1998 to close at S$2.68 each, amid very active dealings that saw 26.9m shares changing hands. OCBC and its insurance arm Great Eastern Holdings, which owns significant stakes in UE, said in a joint statement on Saturday that they had failed to reach an agreement to sell their shareholding in the company to TCC Top Enterprise, a firm controlled by Thai billionaire Charoen.
Unless UE gets a new sugar daddy with better offer price; now no deal no honey, no honey no money. Bro Zuolun, Rumor of daddy sugar surfaced again. A side from that, the price is above 20dMA. Forward indicators are quite positive. However it has Consecutive Days Of Decreasing Average Volume. Are the TA warrant taking a position? Planning to hoot this counter    |
|
|
|
Post by zuolun on Apr 3, 2015 8:14:02 GMT 7
Bro Zuolun, Rumor of daddy sugar surfaced again. A side from that, the price is above 20dMA. Forward indicators are quite positive. However it has Consecutive Days Of Decreasing Average Volume. Are the TA warrant taking a position? Planning to hoot this counter , Observations on UE:- Consolidating with low volatility, technical and overlay indicators +ve.
- Daytraders scalping for afew bids of profit using the power of the 20d SMA.
- The 20c trading range is within the bollinger bands bet. S$2.66 to S$2.87.
- Watch for a bullish bollinger bands breakout for a decisive buy signal, above S$2.87.
- Short once critical support @ S$2.66 is broken convincingly with high volume.
UE ~ Trading in a rectangle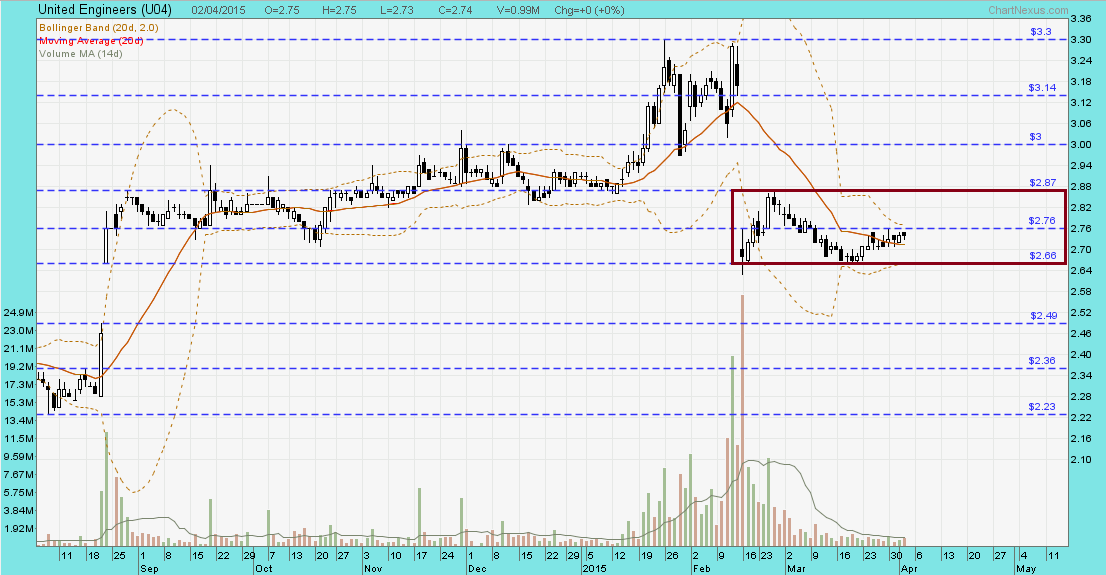 |
|
|
|
UE
Apr 4, 2015 15:09:57 GMT 7
Post by sptl123 on Apr 4, 2015 15:09:57 GMT 7
Observations on UE:- Consolidating with low volatility, technical and overlay indicators +ve.
- Daytraders scalping for afew bids of profit using the power of the 20d SMA.
- The 20c trading range is within the bollinger bands bet. S$2.66 to S$2.87.
- Watch for a bullish bollinger bands breakout for a decisive buy signal, above S$2.87.
- Short once critical support @ S$2.66 is broken convincingly with high volume.
UE ~ Trading in a rectangle Bro Zuolun, Your observation is well noted and thank you very much. In the following UE Chart, could BC be consider as a Double Bottom making a potential Double Bottom Formation of UE?  |
|
|
|
Post by zuolun on May 5, 2015 23:18:52 GMT 7
Observations on UE:- Consolidating with low volatility, technical and overlay indicators +ve.
- Daytraders scalping for afew bids of profit using the power of the 20d SMA.
- The 20c trading range is within the bollinger bands bet. S$2.66 to S$2.87.
- Watch for a bullish bollinger bands breakout for a decisive buy signal, above S$2.87.
- Short once critical support @ S$2.66 is broken convincingly with high volume.
 Why the 200d SMA is important: Why the 200d SMA is important:The Simple Moving Average (SMA) is the average price of an asset over a certain period of time. It is calculated by adding up the closing prices over a certain number of time periods, and then dividing by that number of time periods. SMA’s are used to measure momentum. The most watched SMA is the 200 day, it is widely recognized as the dividing line between bull and bear territory. The primary trend is considered to be up as long as the market is trading above its 200-day moving average but this trend turns bearish whenever the market closes below this average. If UE's share price is convincingly broken at critical support @ S$2.56 with low volume, it's bye-bye for the bulls, "Cheng Kay Run Road" liao...UE ~ Potential Bearish Bollinger Band Breakout, critical support @ S$2.56 (dividend adjusted) UE closed with a bearish "three black crows" candlestick pattern @ S$2.58 (-0.04, -1.5%) with 1.17m shares done on 5 May 2015. Critical support @ S$2.56, immediate resistance @ S$2.66. 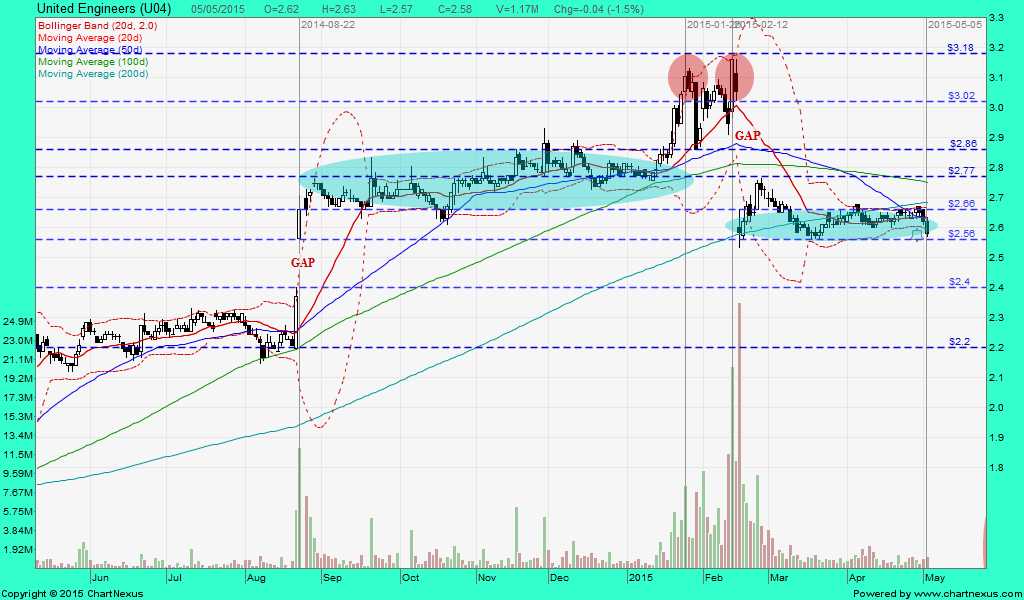 |
|
|
|
Post by zuolun on May 9, 2015 12:21:32 GMT 7
sptl123, The significant difference bet. price crashing down on low vol. and price crashing down on high vol.
Sometimes, certain things could only be visible on the chart when the share price starts its unusual / volatile movement (up or down all in a row, with or without volume). Bollinger bands are very powerful technical indicator. When using it as a key indicator, volume is not necessarily required, instead, the breakout (upside or downside) at the upper or lower Bollinger band is more important. Likewise, in a downtrend, volume is not required for a downside breakout at support level. However, in an uptrend, volume is necessary for an upside breakout at resistance level. Note: A price drop (or rise) on high volume all in a row is a stronger signal indicating that something in the stock has fundamentally changed. UE ~ Bearish Bollinger Band Breakout, TP S$2.20 UE closed with a spinning top @ S$2.53 (+0.02, +0.8%) with 630,000 shares done on 8 May 2015. Immediate support @ S$2.50, immediate resistance @ S$2.57, the 61.8% Fibonacci retracement level. 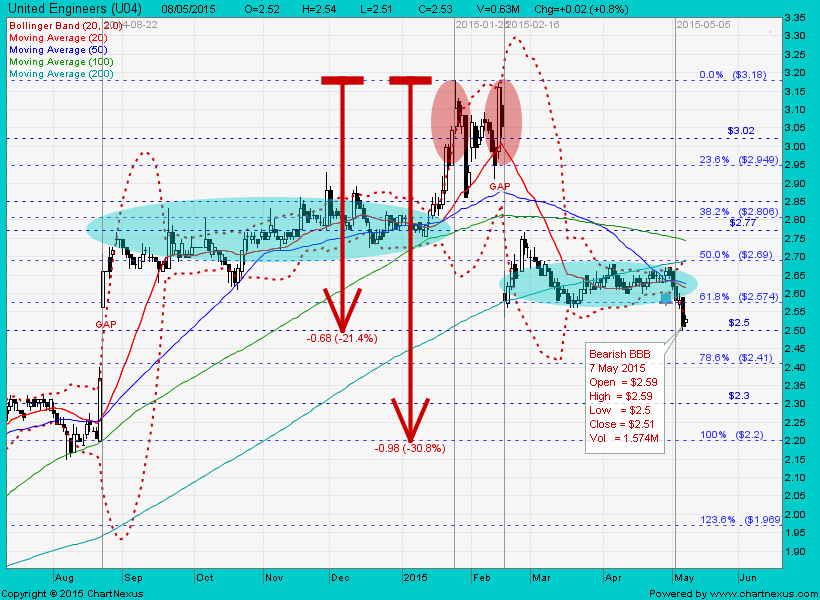
|
|
|
|
Post by zuolun on May 15, 2015 16:23:36 GMT 7
Unless UE gets a new sugar daddy with better offer price; now no deal no honey, no honey no money. Bro Zuolun, Rumor of daddy sugar surfaced again. A side from that, the price is above 20dMA. Forward indicators are quite positive. However it has Consecutive Days Of Decreasing Average Volume.  UOBKH UOBKH ~ 14 May 2015 United Engineers (UEM SP,U04)Technical BUY with 9.3% potential returnsLast price: S$2.56 Target price: S$2.80 Protective stop: S$2.43 BUY with a target price of S$2.80 with stops placed at S$2.43. Currently, the stock appears to have rebounded from an intraday low of S$2.50, which is above our SELL target of S$2.43 mentioned on 14 Apr 15. Excluding the total dividend of S$0.10/share (ex on 29 April), the stock would have fallen about 10 cents since. The stock has not traded lower since forming a bullish Harami pattern on 8 May 15, and in the near term, surpassing S$2.63 could suggest a higher probability for further upside. The MACD histogram has turned up for now. Expected timeframe: 2 weeks to 2 months. -------------------------------------------------------- UOBKH ~ 14 Apr 2015 United Engineers (UEM SP, U04)Technical SELL with 10.0% potential returnsLast price: S$2.70 Target price: S$2.43 Protective stop: S$2.82 SELL with a target price of S$2.43, placing stops at S$2.82. The stock has failed to move above S$3.20 which was the technical BUY stop level on 13 Feb 15. The stock has formed a lower high with reference to the 26 Feb 15 high and currently looks poised to test the immediate support level at S$2.65. A break below it could suggest further downside towards a potential resistance-turned-support level. The 14-day RSI has been resisted near 50 previously and its MACD indicator could form a bearish crossover beneath its centreline as MACD histogram has turned down, suggesting bearish momentum. Expected timeframe: 3 weeks to 2 months. |
|
|
|
UE
May 31, 2015 6:51:48 GMT 7
Post by odie on May 31, 2015 6:51:48 GMT 7
United Engineers closed at 2.71
Vested
|
|
|
|
Post by zuolun on Jun 16, 2015 11:10:04 GMT 7
The mighty 200d SMAWhy the 200d SMA is important:The Simple Moving Average (SMA) is the average price of an asset over a certain period of time. It is calculated by adding up the closing prices over a certain number of time periods, and then dividing by that number of time periods. SMA’s are used to measure momentum. The most watched SMA is the 200 day, it is widely recognized as the dividing line between bull and bear territory. The primary trend is considered to be up as long as the market is trading above its 200-day moving average but this trend turns bearish whenever the market closes below this average. UE ~ Three Dead Crosses, biased to the downside, TP S$2.20UE had an inverted hammer and traded @ S$2.55 (-0.01, -0.4%) with thin volume done at 76,400 shares on 16 Jun 2015 at 1205 hrs. Immediate support @ S$2.53, immediate resistance @ S$2.60.  sptl123, The significant difference bet. price crashing down on low vol. and price crashing down on high vol.
Sometimes, certain things could only be visible on the chart when the share price starts its unusual / volatile movement (up or down all in a row, with or without volume). Bollinger bands are very powerful technical indicator. When using it as a key indicator, volume is not necessarily required, instead, the breakout (upside or downside) at the upper or lower Bollinger band is more important. Likewise, in a downtrend, volume is not required for a downside breakout at support level. However, in an uptrend, volume is necessary for an upside breakout at resistance level. Note: A price drop (or rise) on high volume all in a row is a stronger signal indicating that something in the stock has fundamentally changed. UE ~ Bearish Bollinger Band Breakout, TP S$2.20 UE closed with a spinning top @ S$2.53 (+0.02, +0.8%) with 630,000 shares done on 8 May 2015. Immediate support @ S$2.50, immediate resistance @ S$2.57, the 61.8% Fibonacci retracement level.
|
|
|
|
UE
Jun 25, 2015 22:21:08 GMT 7
sptl123 likes this
Post by zuolun on Jun 25, 2015 22:21:08 GMT 7
|
|


