|
|
Post by zuolun on Oct 3, 2014 8:51:58 GMT 7
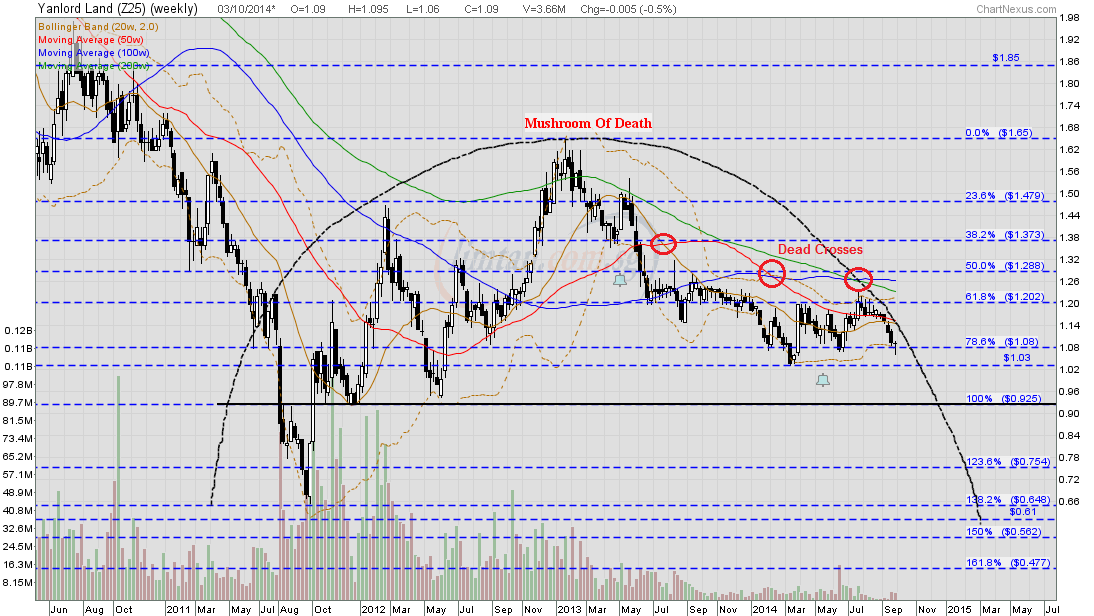
Yanlord and Genting both have identical characteristics: Chart Pattern — Major bearish trend reversal with 5-Wave downYanlord — A penny stock in the making, Interim TP S$0.925Yanlord had an inverted hammer @ S$1.06 (-0.01, -0.9%) with extremely thin volume done at 270 lots on 2 Oct 2014 at 1.30pm. Immediate support @ S$1.03, immediate resistance @ S$1.07. 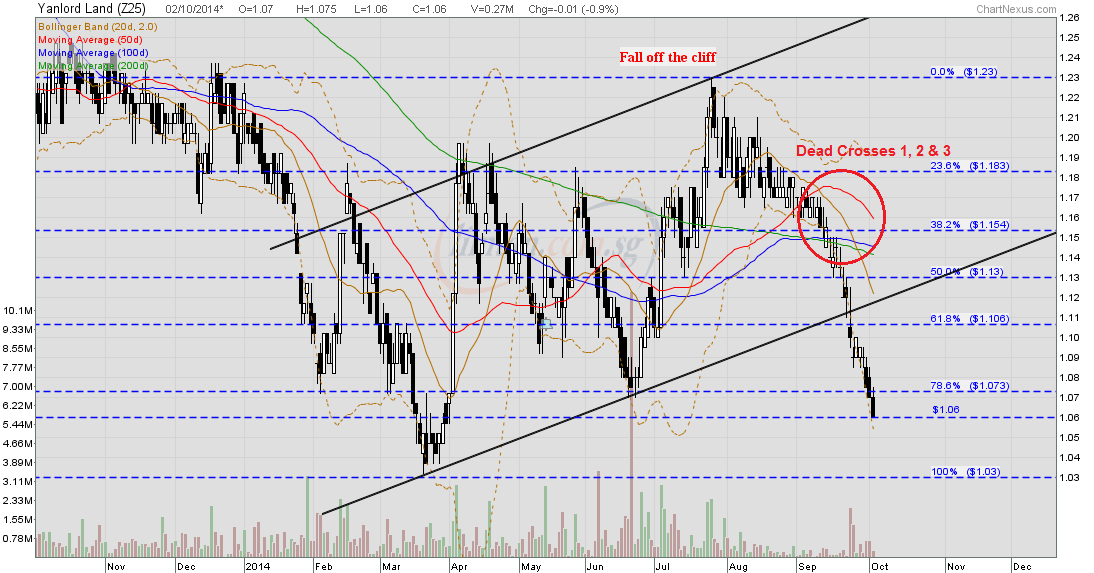 Yanlord's weekly chart has a bear flag breakout and a 5-Wave down chart pattern. Expect a "Waterfall Decline" ending with a semi-round arch or a "Mushroom Of Death". Yanlord (weekly) — Bear Flag Breakout Interim TP S$0.925, Next TP S$0.61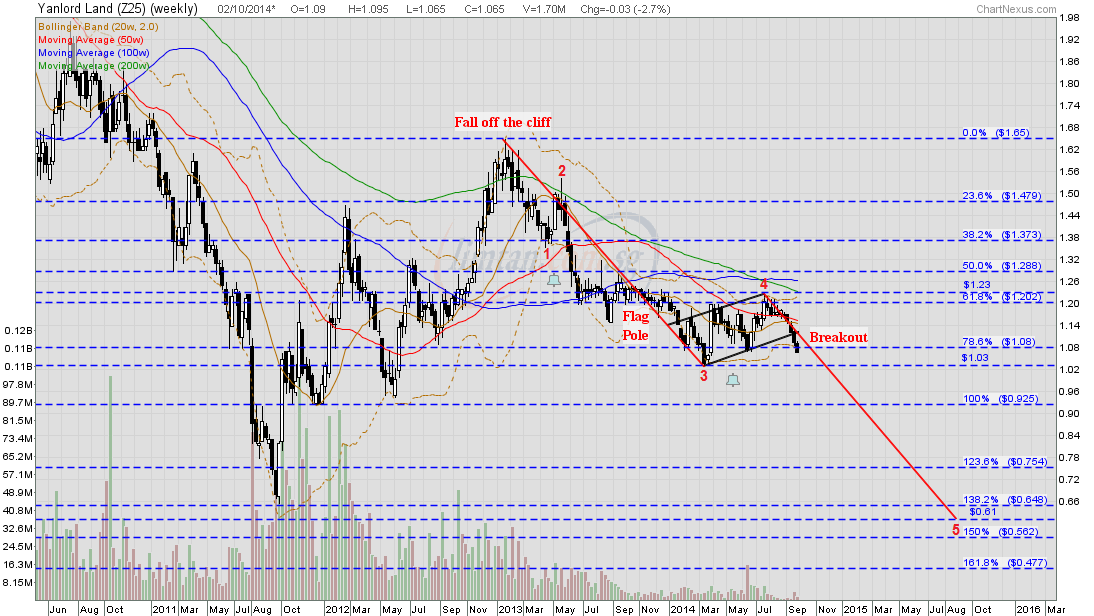 Target Projection @ S$1.08 is based on a bear pennant breakout; Genting SP will form a new bear flag with a long flag pole after this massive climatic sell off; expect more downside.  Genting SP — Bearish Pennant / Symmetrical Triangle Breakout, TP S$1.08 Genting SP — Bearish Pennant / Symmetrical Triangle Breakout, TP S$1.08Genting SP gapped down with a hammer @ S$1.155 (-0.015, -1.3%) with 7.43m shares done on 15 Sep 2014 at 9.10am. Immediate support @ S$1.13, immediate resistance @ S$1.17. 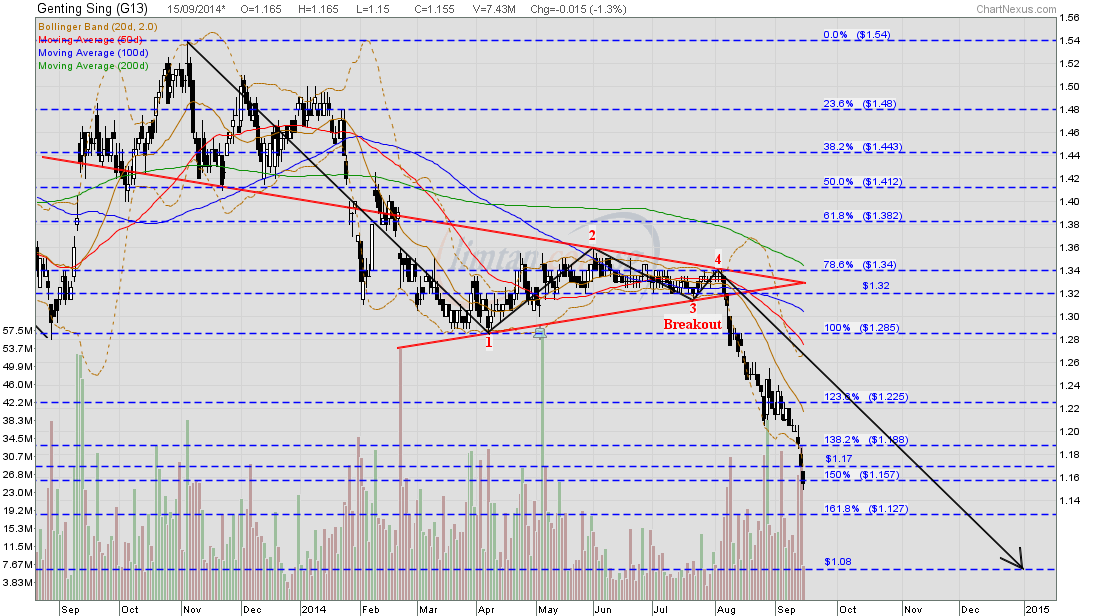 Genting SP (weekly Mid-Nov 2010 to 15 Sep 2014) — Bearish Descending Triangle Breakout, neckline @ S$1.15, interim TP S$0.80 Genting SP (weekly Mid-Nov 2010 to 15 Sep 2014) — Bearish Descending Triangle Breakout, neckline @ S$1.15, interim TP S$0.80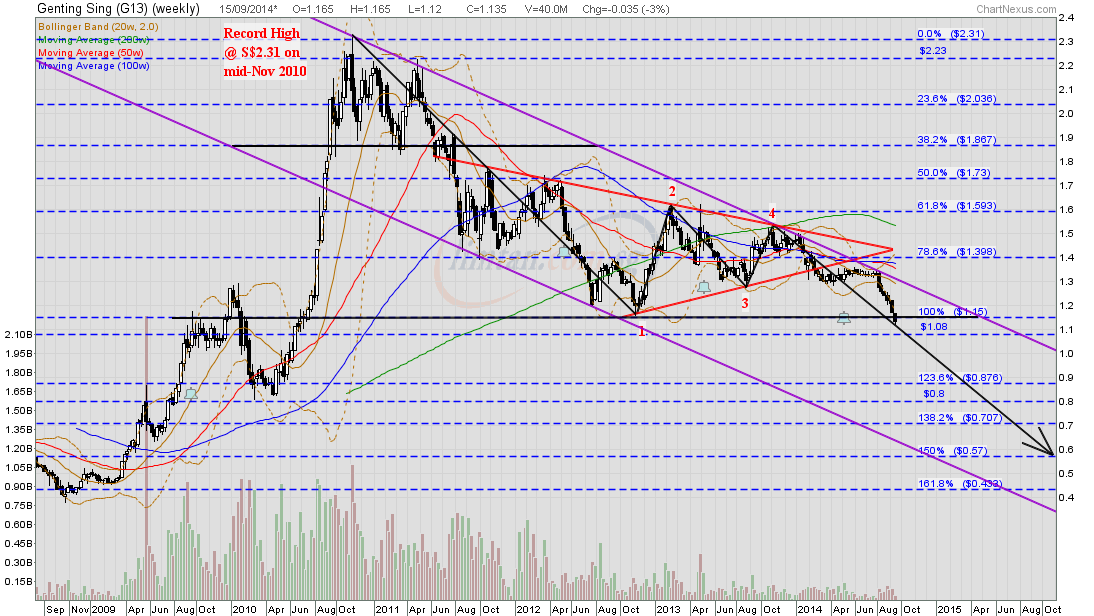 Genting SP closing at day's low @ S$1.17 with high volume done at 33.3m shares on 12 Sep 2014 showed that the strong selling pressure had accelerated as the CMF indicator has been extremely bearish since Nov 2013.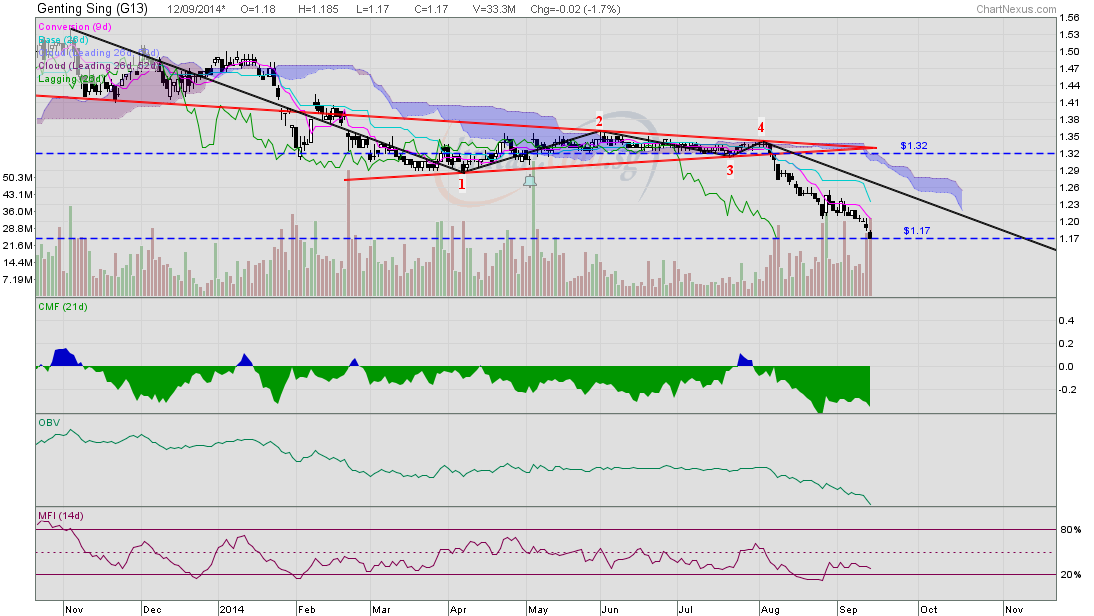
|
|
|
|
Post by zuolun on Oct 3, 2014 14:42:20 GMT 7
Hyflux, IndoAgri and JC&C: Chart Pattern — Major bearish trend reversal with 5-Wave down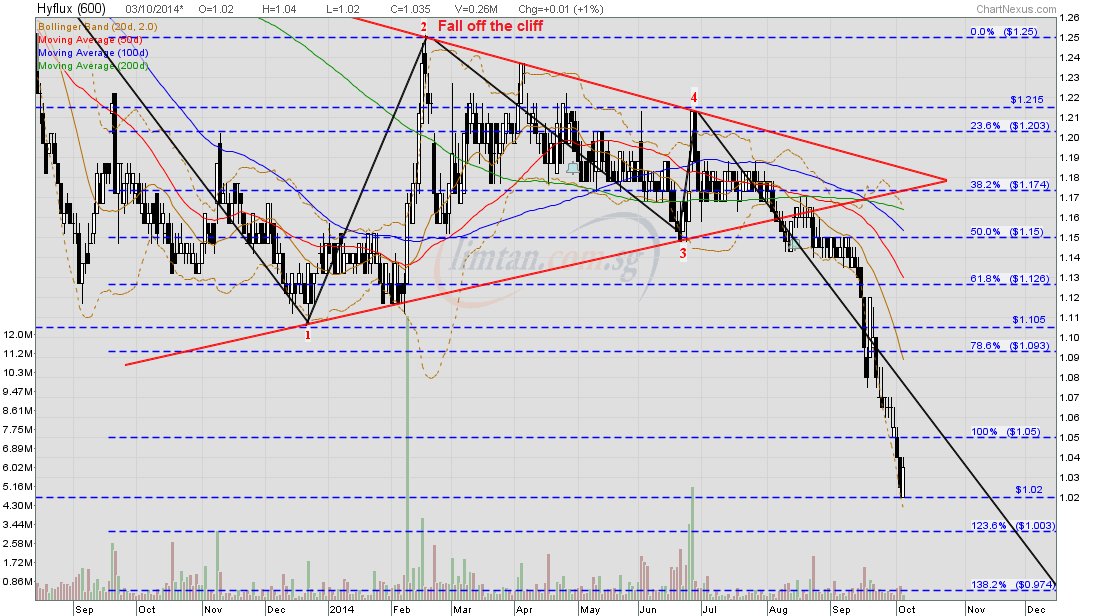 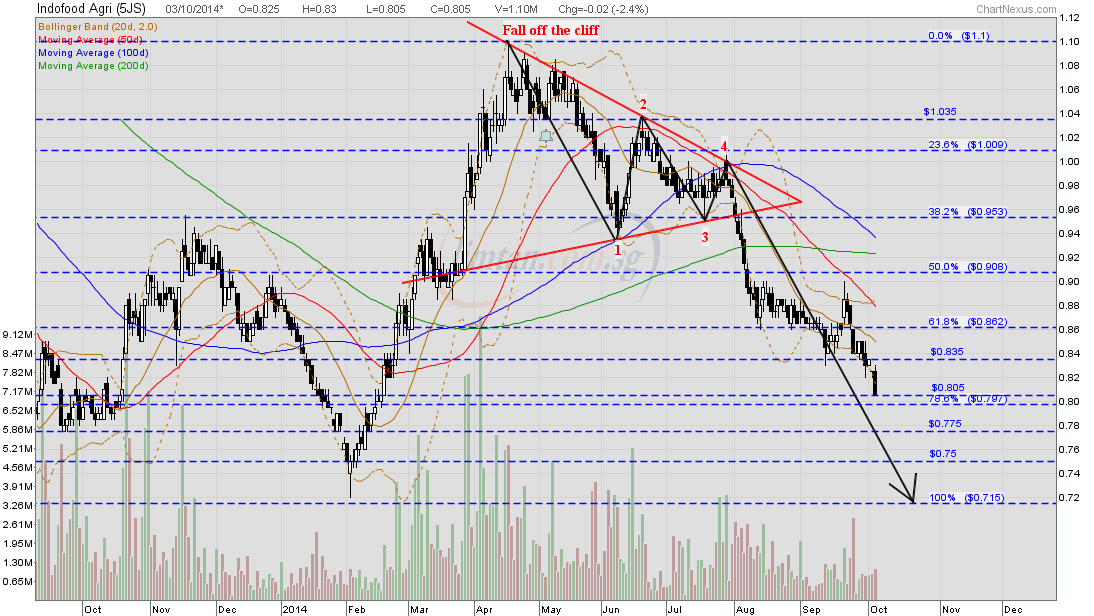 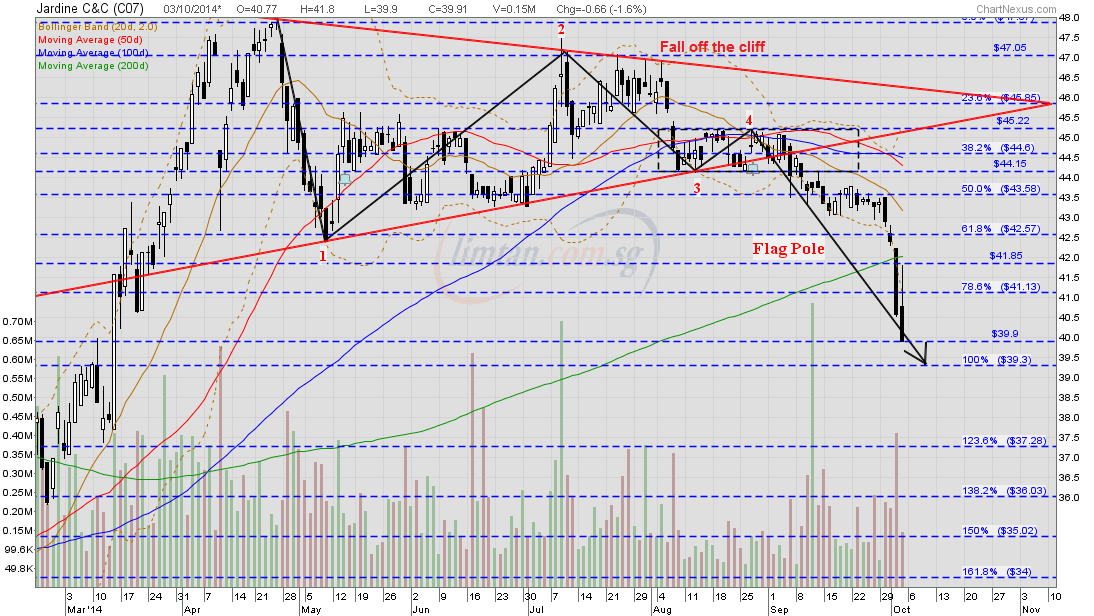
|
|
|
|
Post by zuolun on Oct 4, 2014 9:02:37 GMT 7
|
|
|
|
Post by zuolun on Oct 5, 2014 12:02:59 GMT 7
|
|
|
|
Post by zuolun on Oct 7, 2014 13:21:35 GMT 7
Capitaland and Oxley: Chart Pattern — Bearish Symmetrical Triangle Breakout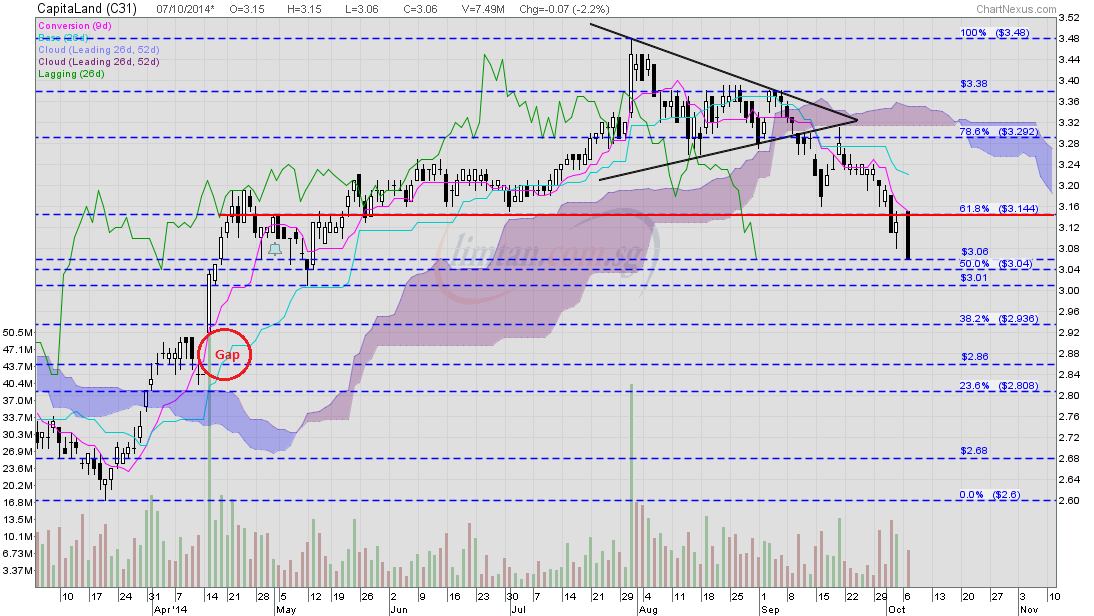 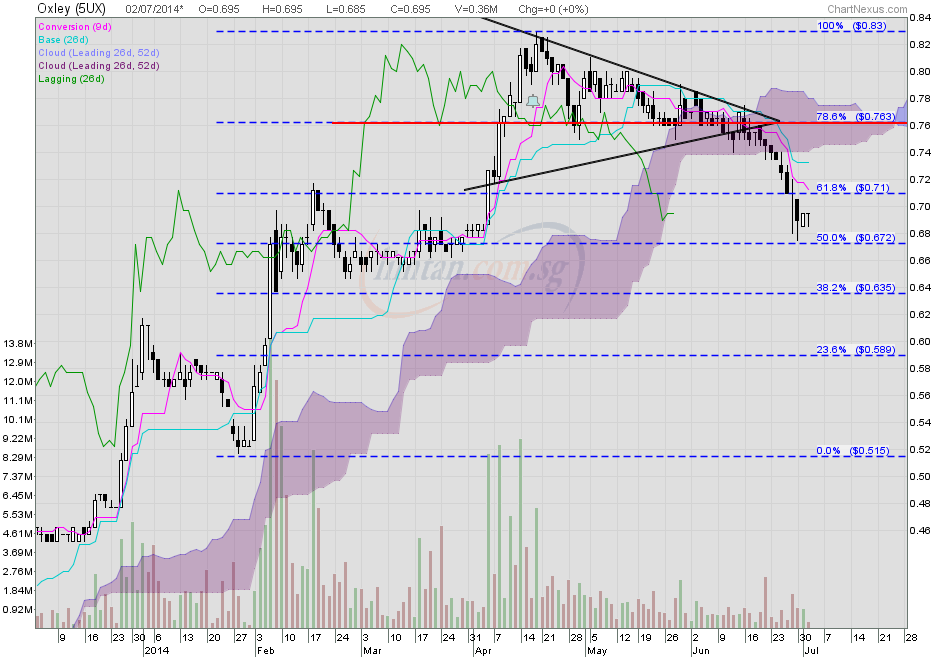
|
|
|
|
Post by zuolun on Oct 8, 2014 10:43:52 GMT 7
SIA, Lian Beng and G Invacom: Chart Pattern — Bearish Rectangle Breakout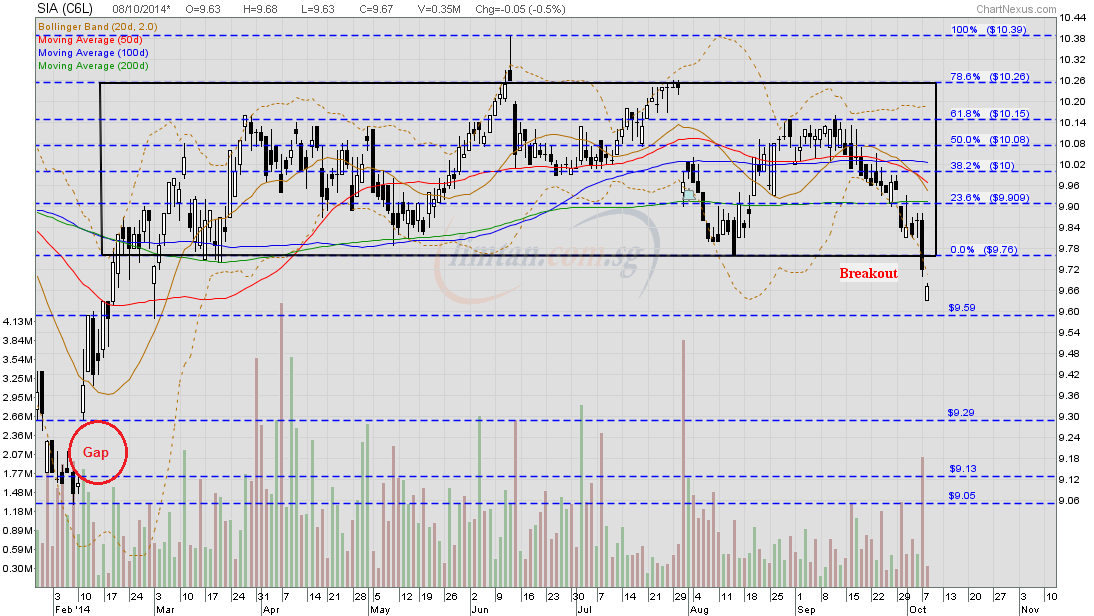 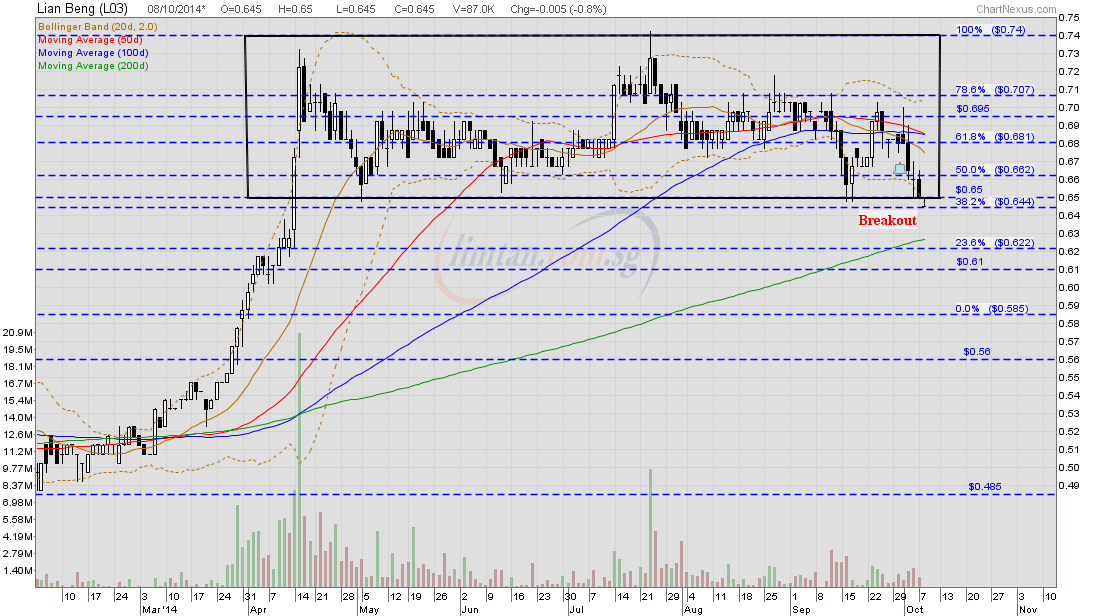 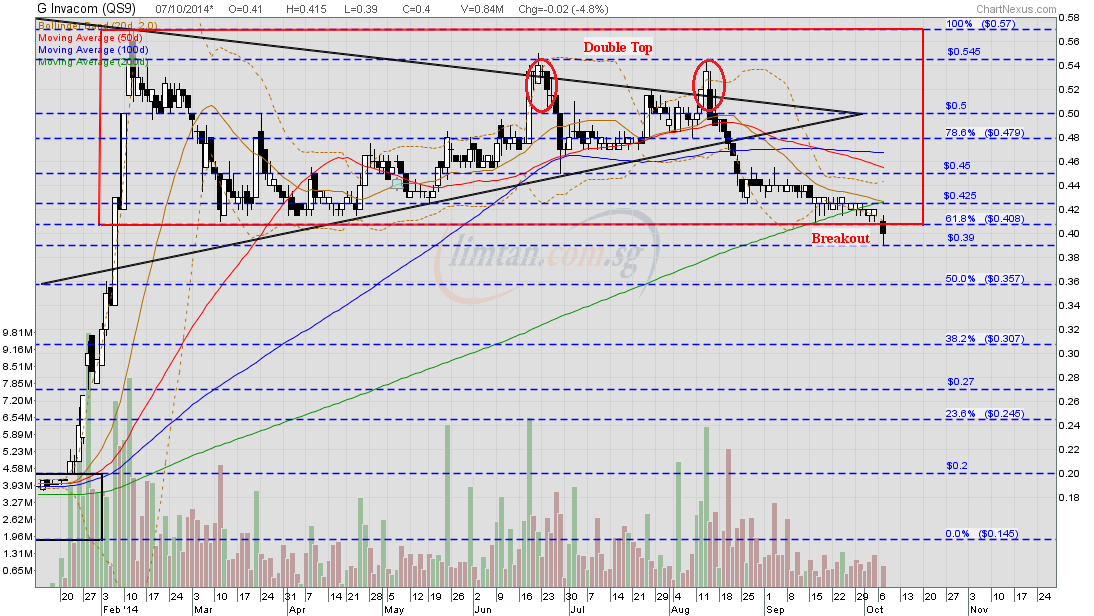
|
|
|
|
Post by zuolun on Oct 8, 2014 12:11:28 GMT 7
KepCorp Oct 2014 and KepCorp Aug 2011: Chart Pattern — Climatic sell-off with extremely high volume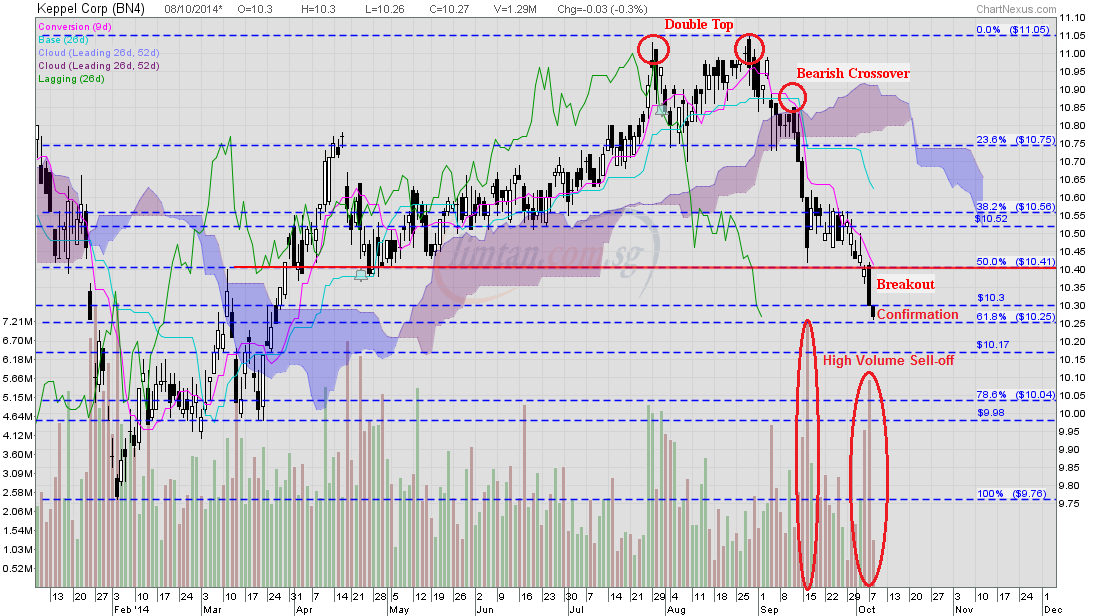 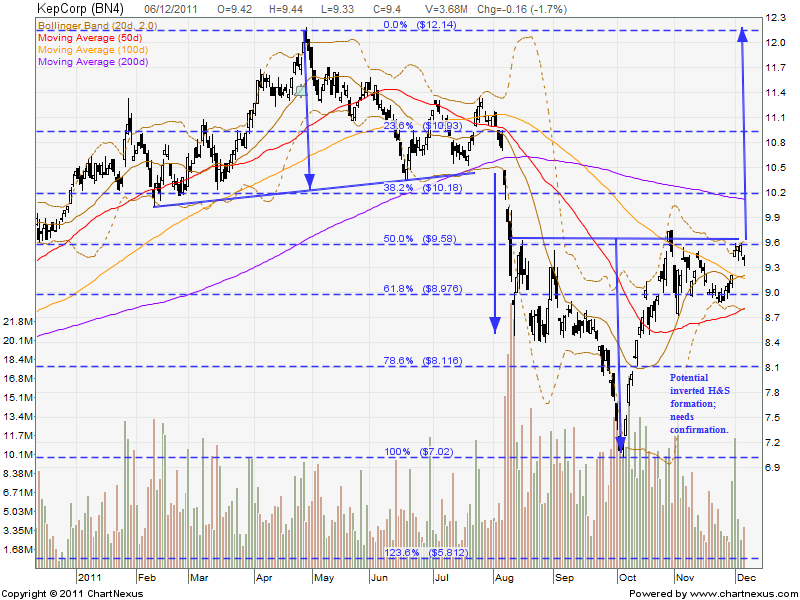
|
|
|
|
Post by zuolun on Oct 10, 2014 10:00:45 GMT 7
POSH and Linc Energy: Chart Pattern — A "Waterfall Decline" chart pattern, major bearish trend reversal with 5-Wave down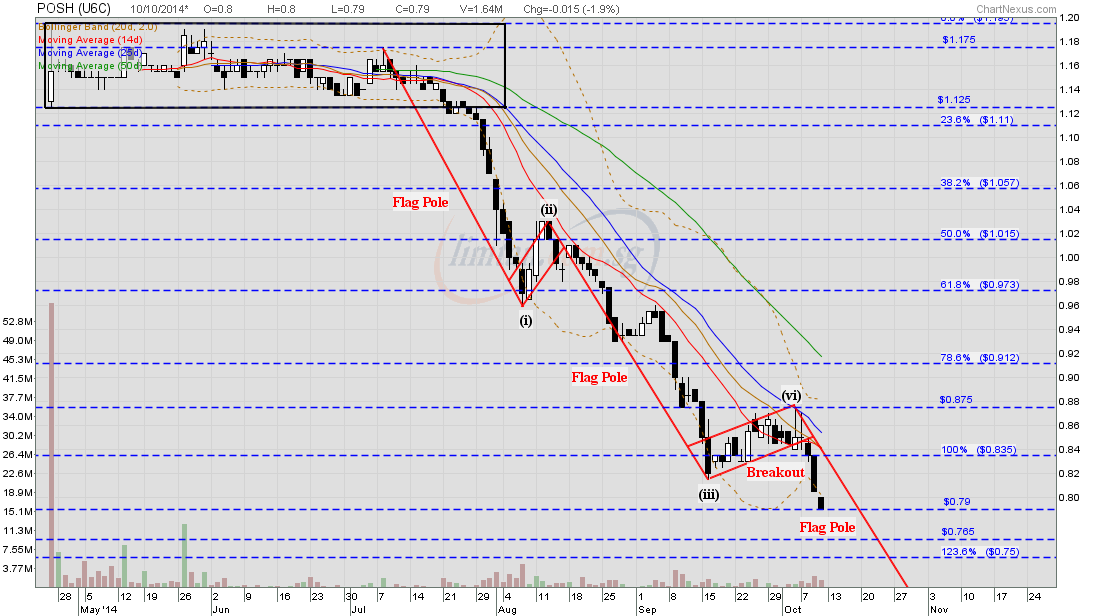 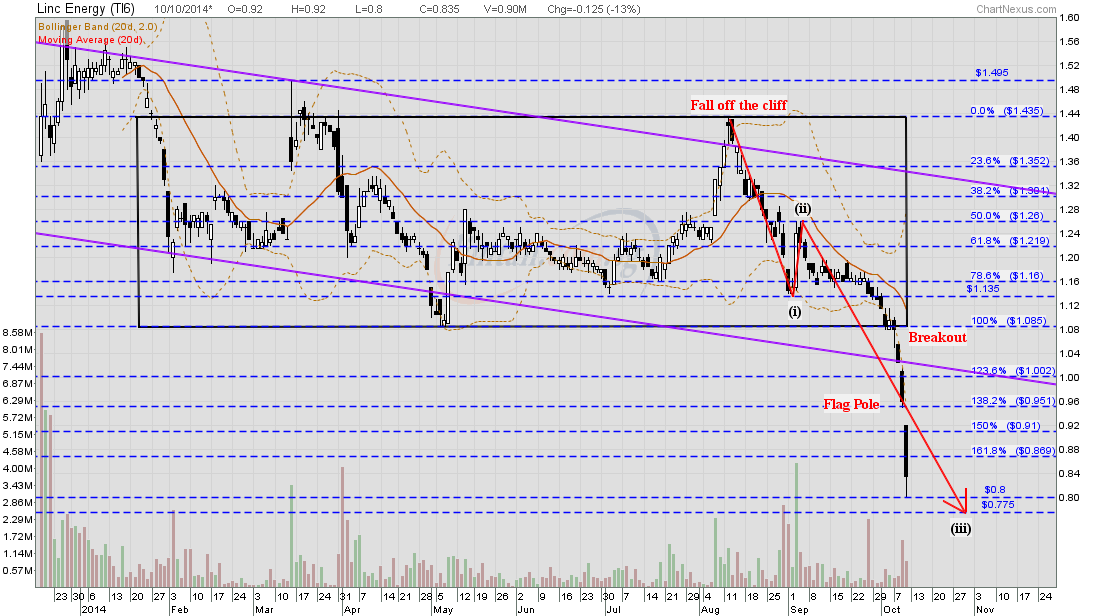
|
|
|
|
Post by zuolun on Oct 10, 2014 14:36:39 GMT 7
Pacific Radiance and Oxley: Chart Pattern — Completed the impulsive 5-Wave up, riding on the corrective 3-Wave down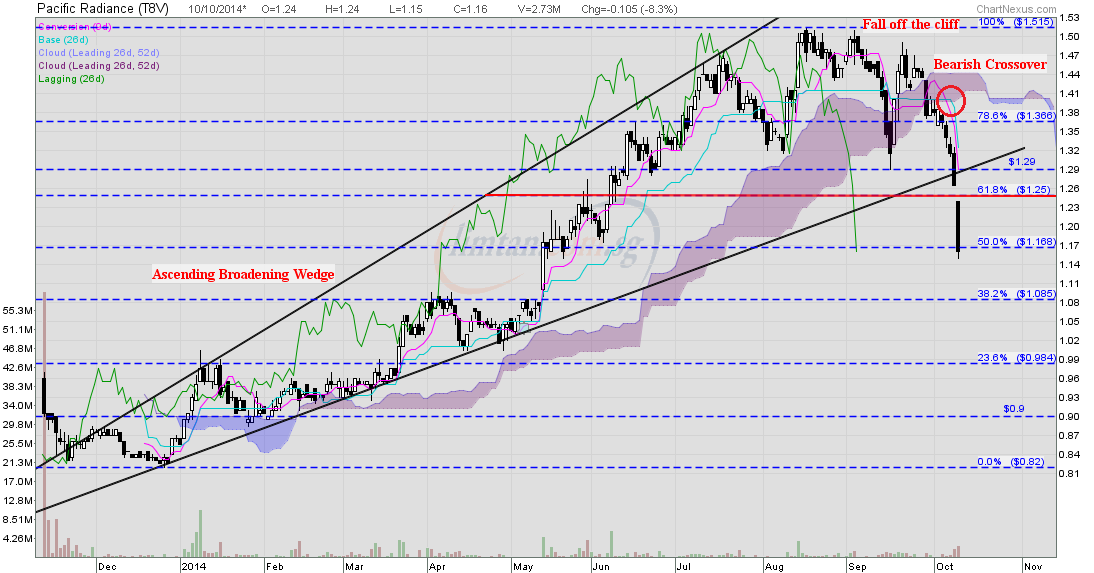 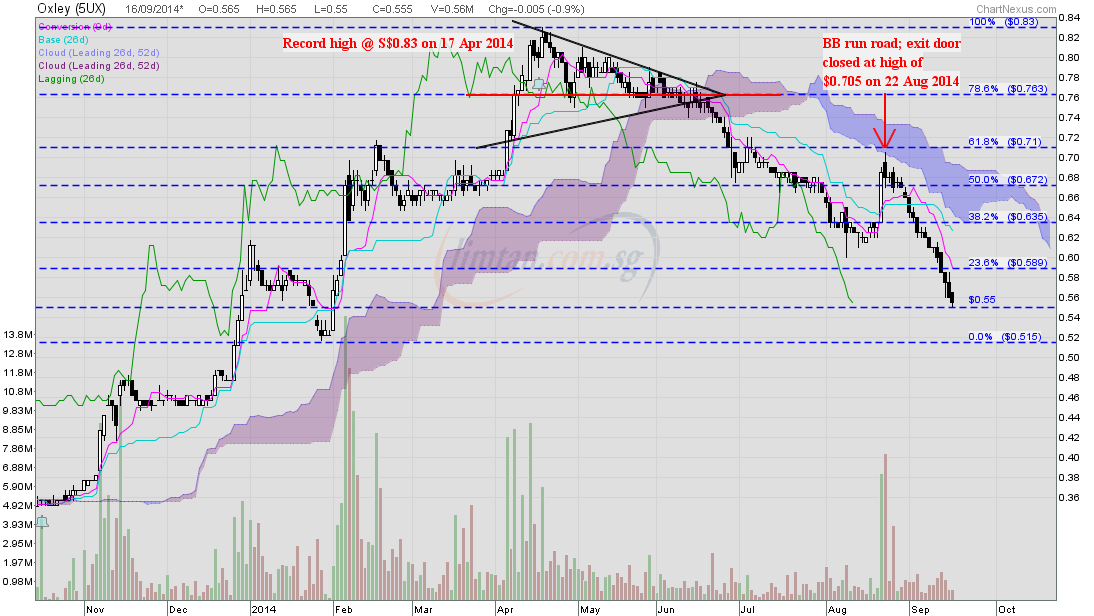
|
|
|
|
Post by kenjifm on Oct 10, 2014 15:00:59 GMT 7
I was at a lim and tan seminar and Pacific Radiance was recommended.
I hope no one follow blindly.
|
|
|
|
Post by zuolun on Oct 17, 2014 14:55:11 GMT 7
KepCorp and SeaDrill (SDRL): Chart Pattern — Major bearish trend reversal in the Offshore Drilling Industry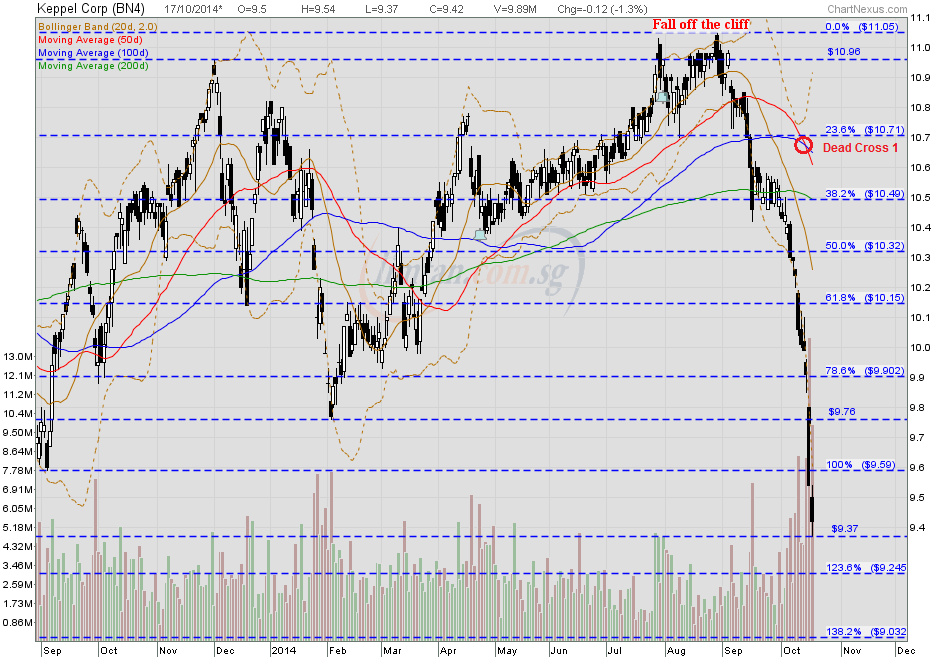 SeaDrill (SDRL) as at 7 Oct 2014 SeaDrill (SDRL) as at 7 Oct 2014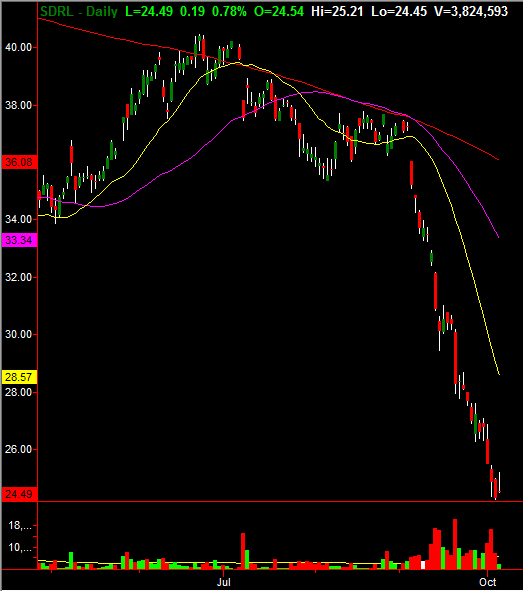
|
|
|
|
Post by zuolun on Oct 21, 2014 16:11:15 GMT 7
MHB (5186), Xinghe and POSH: Chart Pattern — Bearish Rectangle Breakout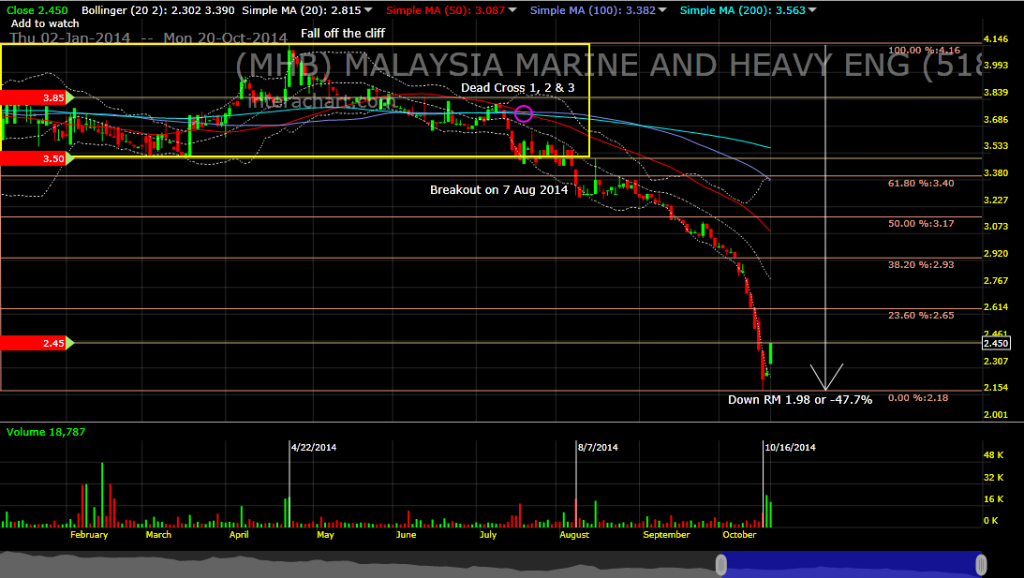 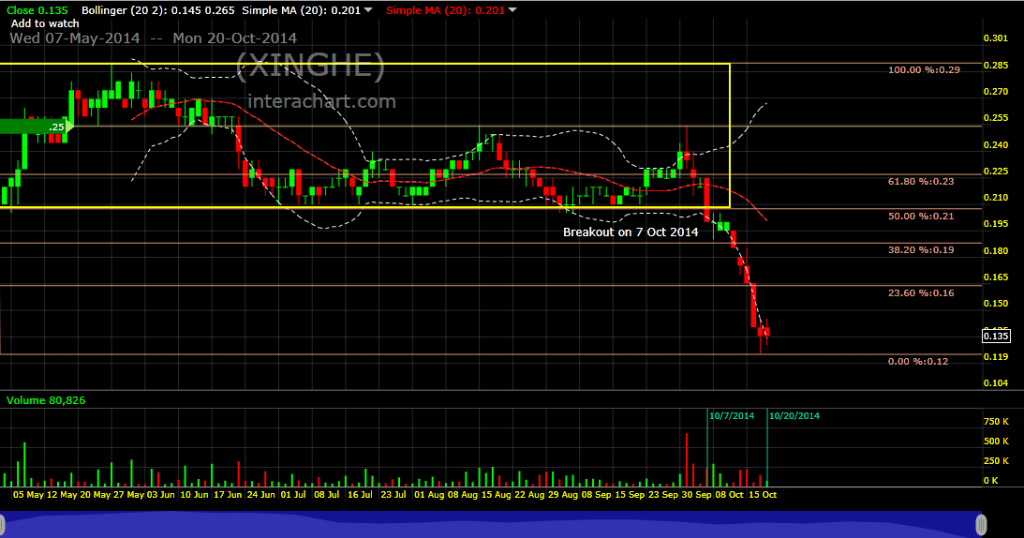 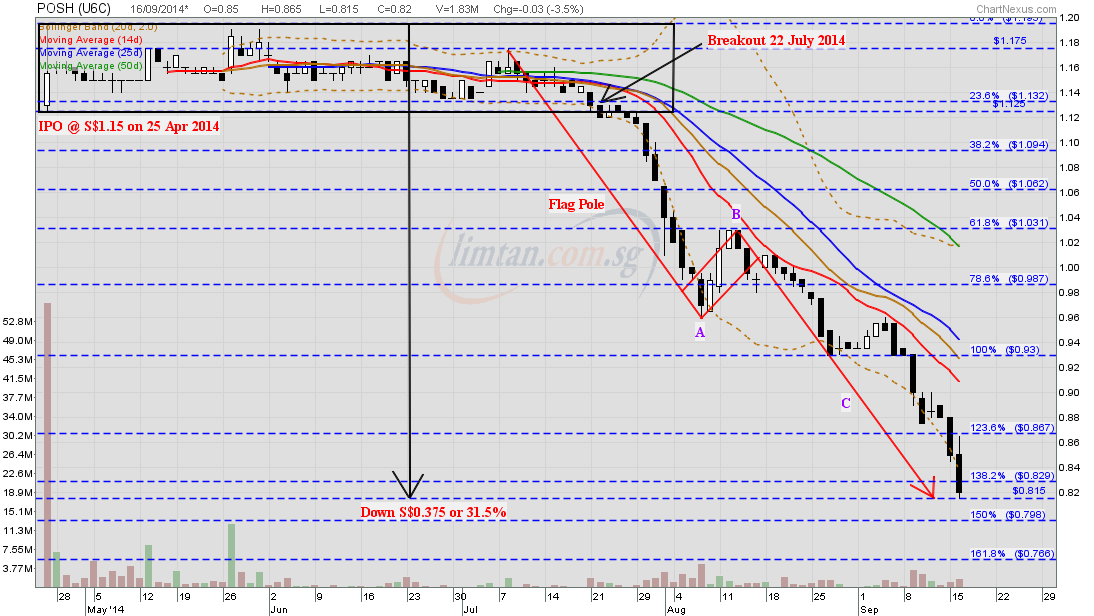
|
|
|
|
Post by zuolun on Oct 22, 2014 13:34:40 GMT 7
NOL and MHB (5186): Chart Pattern — A "Waterfall Decline"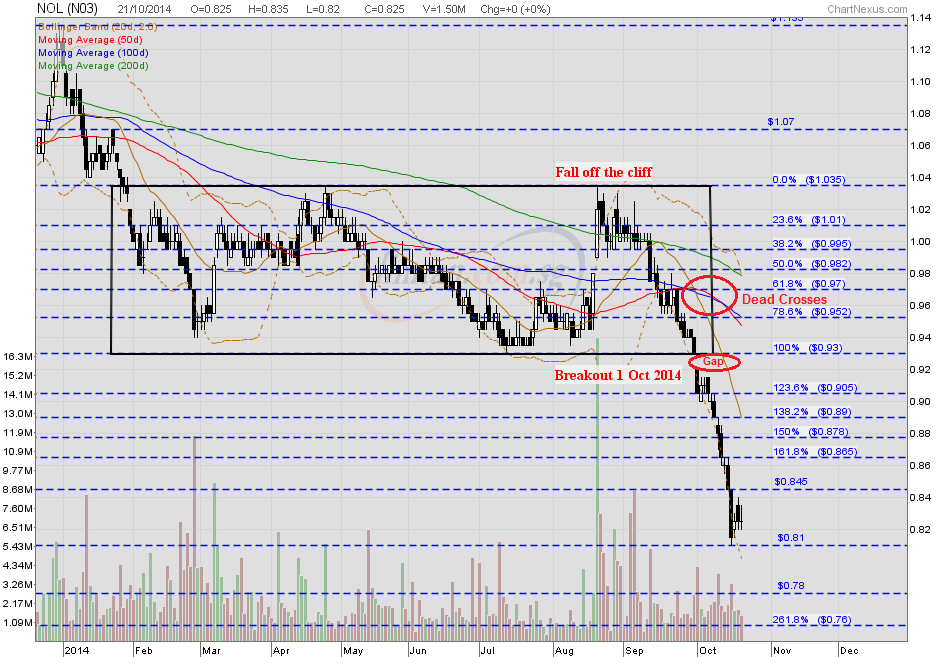
|
|
|
|
Post by zuolun on Oct 24, 2014 17:39:21 GMT 7
|
|
|
|
Post by zuolun on Oct 24, 2014 18:08:33 GMT 7
Chart Pattern — A "Waterfall Decline" with 5-Wave down1. Genting Sp (-S$0.35, -25.7%)2. KepCorp (-S$1.68, -15.2%)3. MTQ (-S$0.675, -37.2%)4. Sino Grandness (-S$0.29, -38.7%)5. POSH (-S$0.525, -43.9%)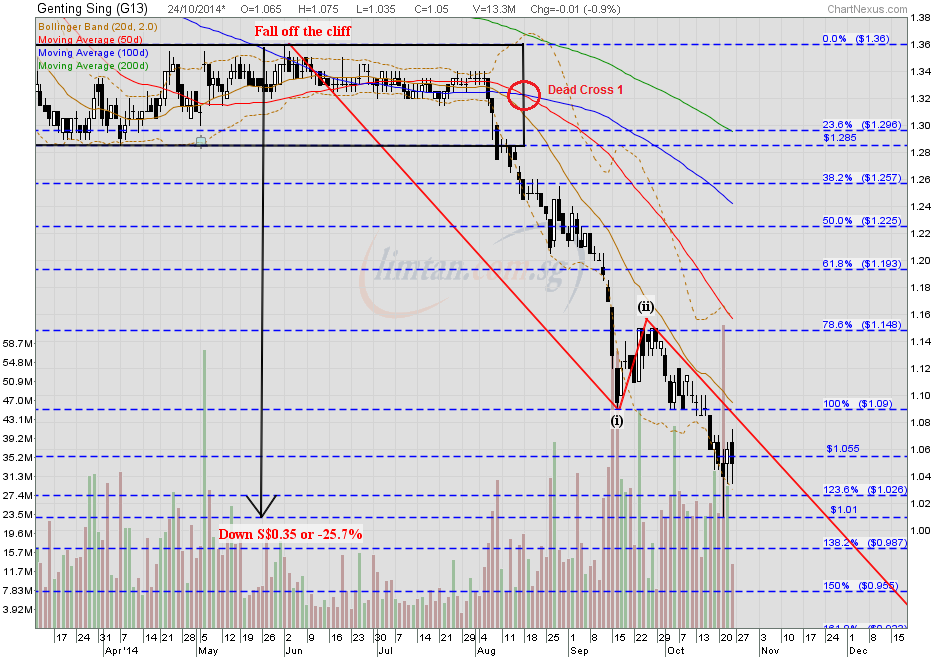 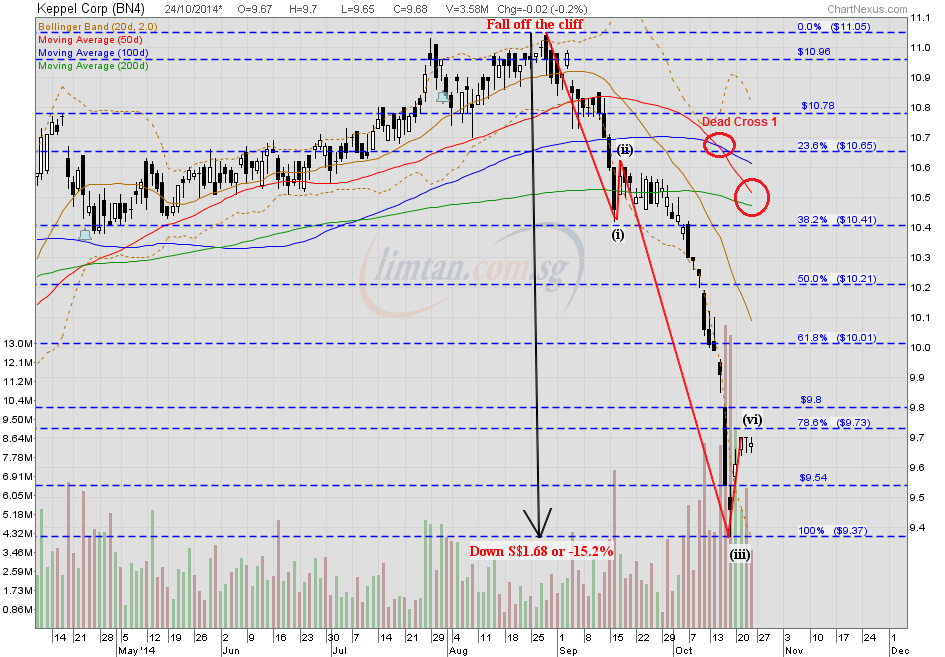 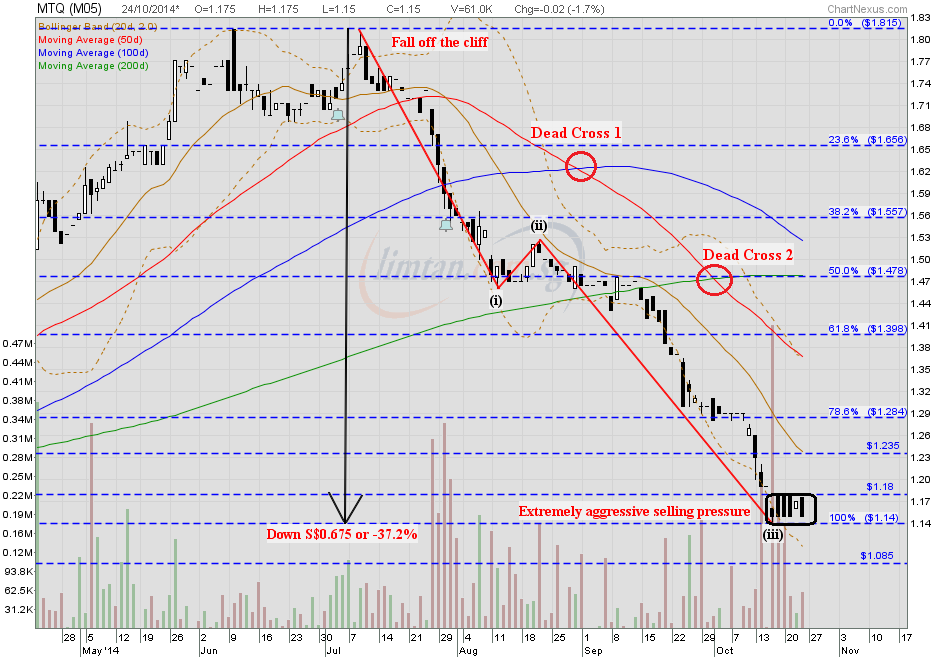 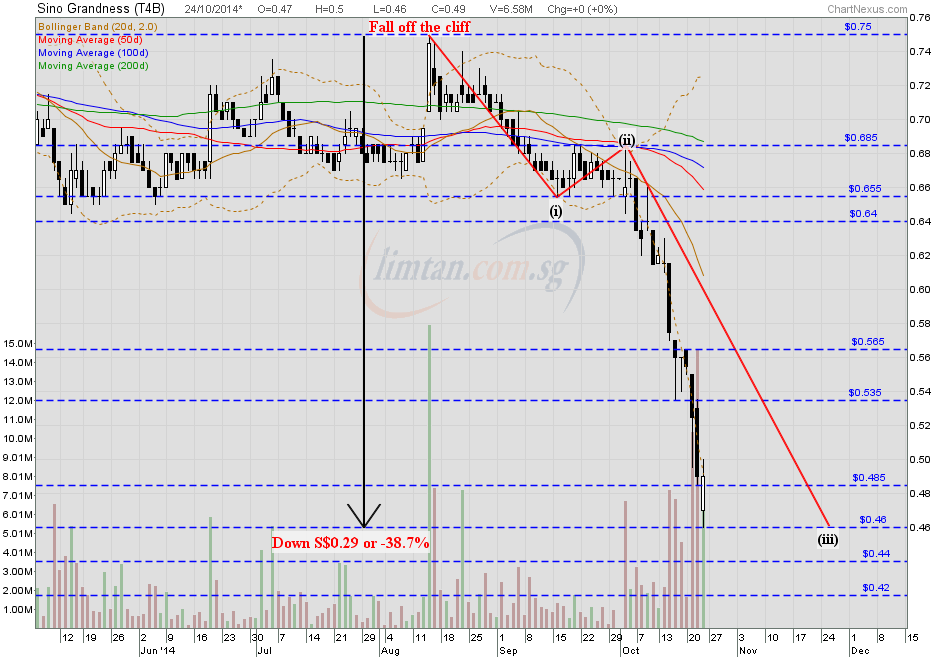 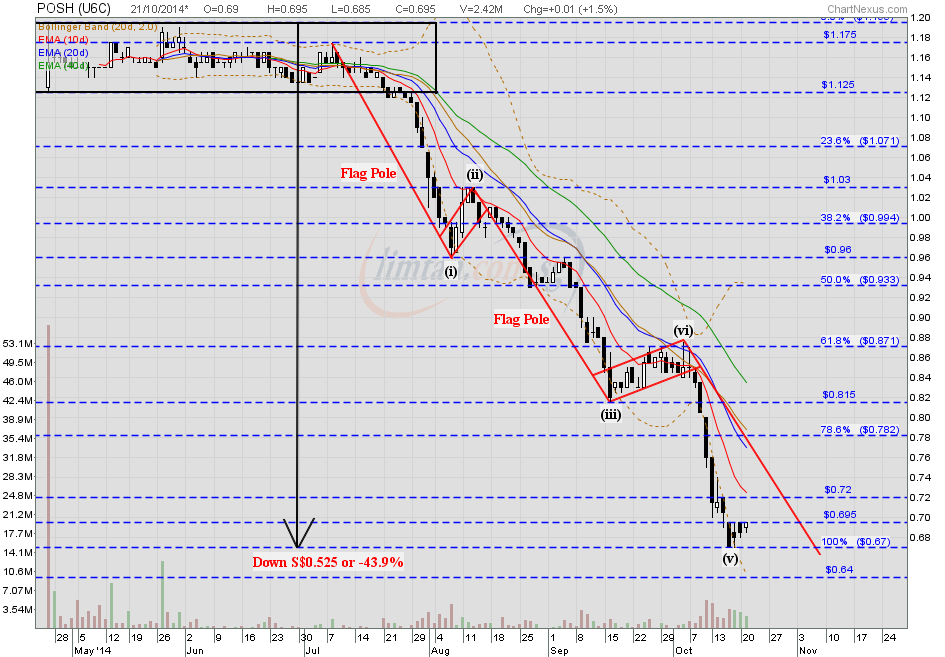
|
|