|
|
Post by zuolun on Dec 9, 2013 11:27:32 GMT 7
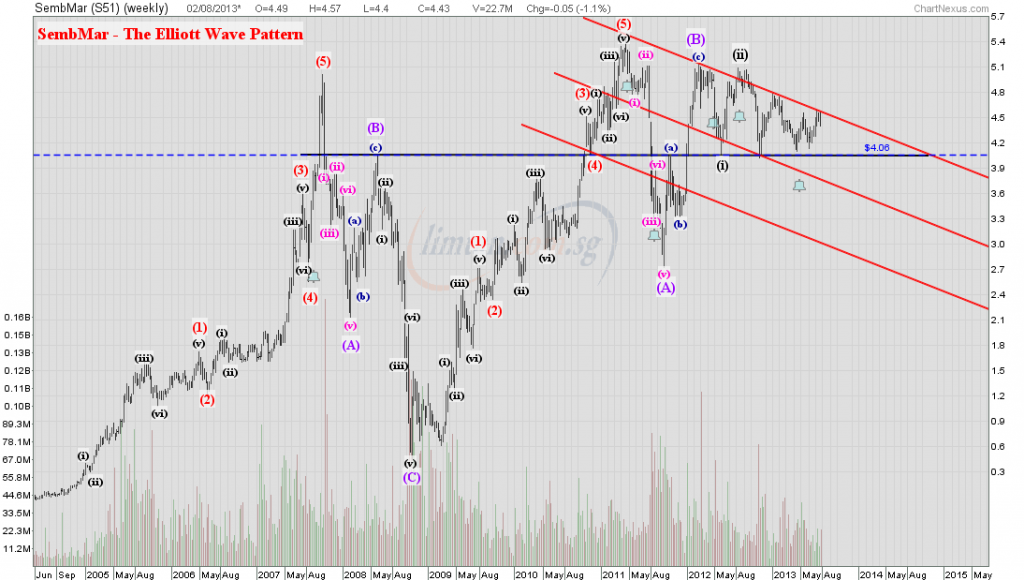
SembMar @ S$4.31 (-0.01, 0.2%) on 9 Dec at 12.25 noon.  SembMar (weekly) — Trading in a rectangle SembMar (weekly) — Trading in a rectangle SembMar — The Elliott Wave pattern as at 2 Aug 2013 SembMar — The Elliott Wave pattern as at 2 Aug 2013
 |
|
|
|
SembMar
Dec 10, 2013 10:37:17 GMT 7
Post by zuolun on Dec 10, 2013 10:37:17 GMT 7
|
|
|
|
SembMar
Dec 11, 2013 10:44:40 GMT 7
Post by zuolun on Dec 11, 2013 10:44:40 GMT 7
SembMar — Descending triangle formation; crucial support @ S$4.05
|
|
|
|
Post by simplemind on May 5, 2014 9:46:17 GMT 7
ZL bro,
what do you think of sembm?
results looks ok but got whack down today n break support.
thanks
|
|
|
|
Post by zuolun on May 5, 2014 10:30:46 GMT 7
odie, One of the best-performed Funds is doing portfolio adjustment on SMM as it is the worst stock stuck in the Fund for 18 months. Don't touch this stock now until the selling is done. pertama.freeforums.net/post/1687Good illustration that at the end of the day, the rise and fall of stock prices are more about demand and supply and much less about fundamentals... ZL bro, what do you think of sembm? results looks ok but got whack down today n break support. thanks simplemind, Don't touch this stock. SMM's strong selling pressure won't disappear overnite because when longterm funds buy; they'll buy, buy-on-dip and hold-long-long. However, when they sell; they'll sell and short-sell-long-long, thus the downtrend resumes after a dead cat bounce. Supply > Demand = Decrease in price"At the end of the day, the rise and fall of stock prices are more about demand and supply and much less about fundamentals." — oldman |
|
|
|
Post by simplemind on May 5, 2014 14:40:33 GMT 7
ZL bro
thank you
|
|
|
|
Post by zuolun on May 5, 2014 17:36:12 GMT 7
simplemind, SMM gapped down and closed with a long black marubozu @ S$3.97 (-0.09, -2.2%) today 5 May 2014. SMM (weekly) chart showed an extremely huge bearish diamond top breakout @ S$4.86 dated 29th Oct 2012; it is likely to retest the last low @ S$3.05 scored on 4th Oct 2011 and hit lower low. 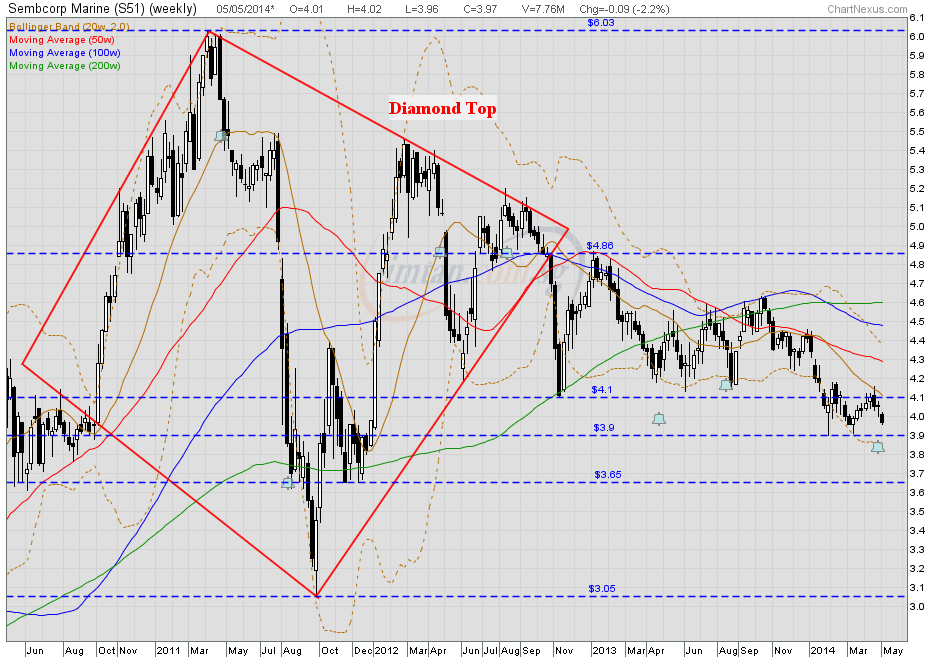 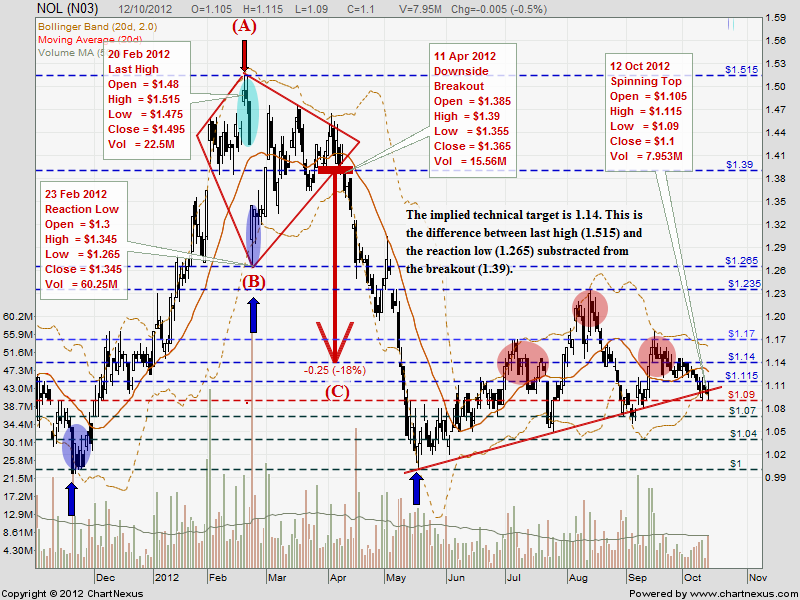 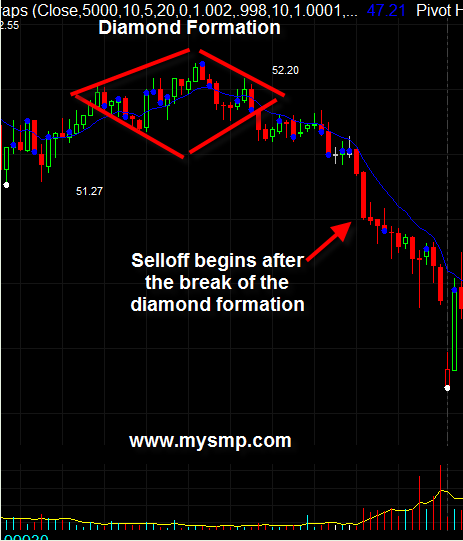 |
|
|
|
Post by zuolun on May 6, 2014 12:13:11 GMT 7
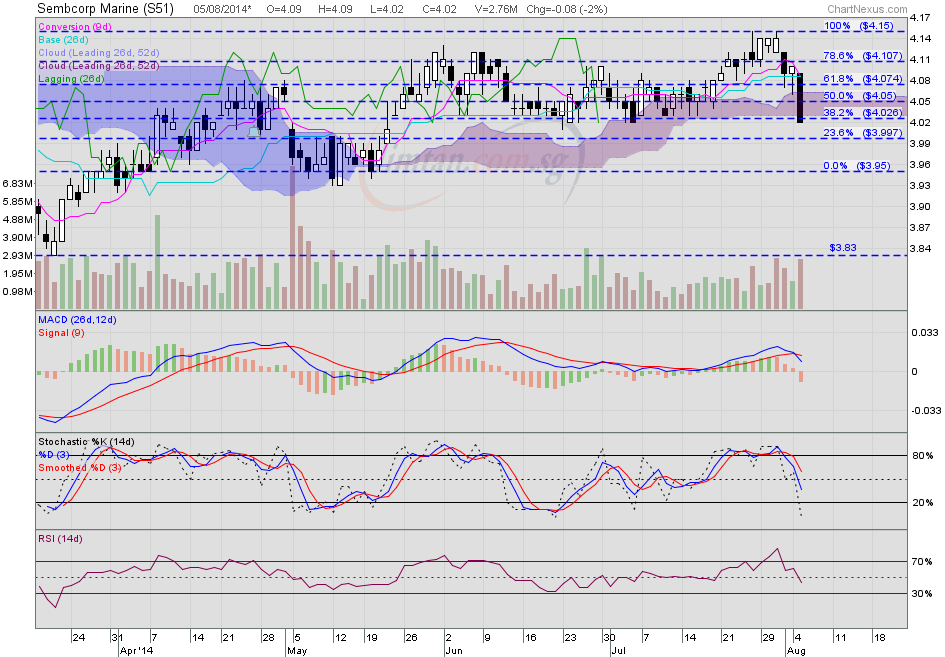
Based on the ichimoku chart, downside is more than upside for SMM when the Tenkan-Sen (pink line) has a bearish crossover below the Kijun-Sen (blue line) coupled with a bearish Chikou-Span. SMM as at 6 May 2014 at 1.25pm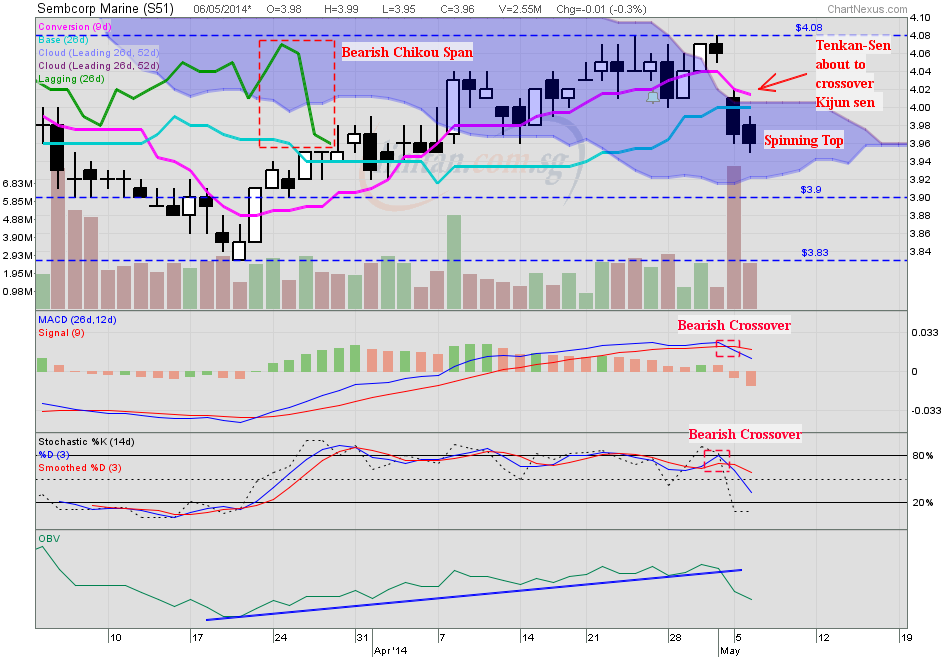 [/URL] |
|
|
|
Post by zuolun on May 12, 2014 16:37:58 GMT 7
 This is a typical bull trap the BBs used to trap the silly bulls... SMM closed with a bearish engulfing @ S$3.94 (-0.03, -0.8%) on 12 May 2014. 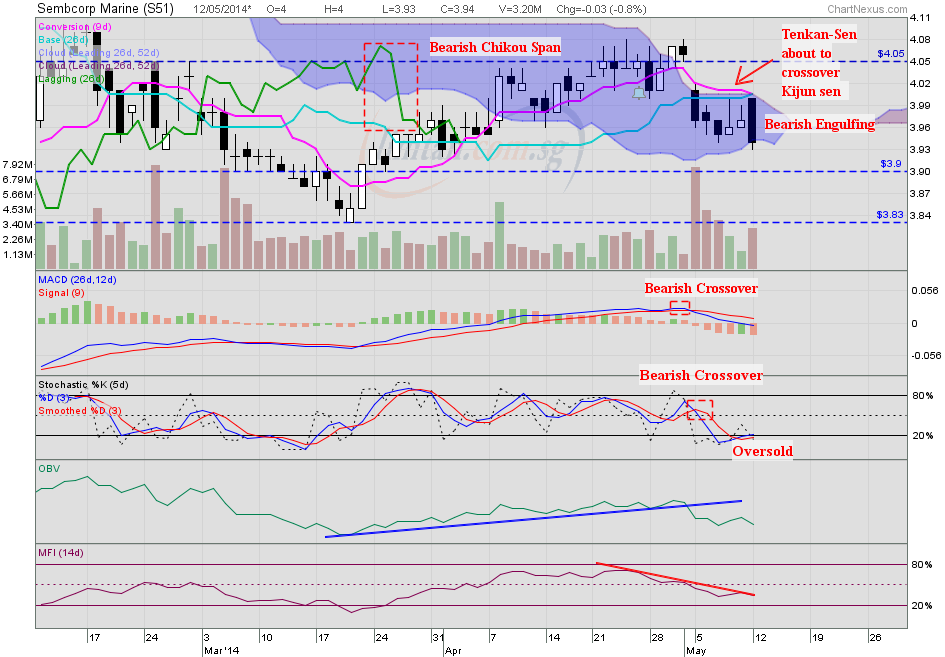 |
|
|
|
Post by zuolun on Jul 12, 2014 11:12:45 GMT 7
zuolun bro, seems like super group's 2 diamonds are super scary  odie, The most heavy-weight diamond is the one in SMM...it has been rolling down from the cliff, slow and steady... 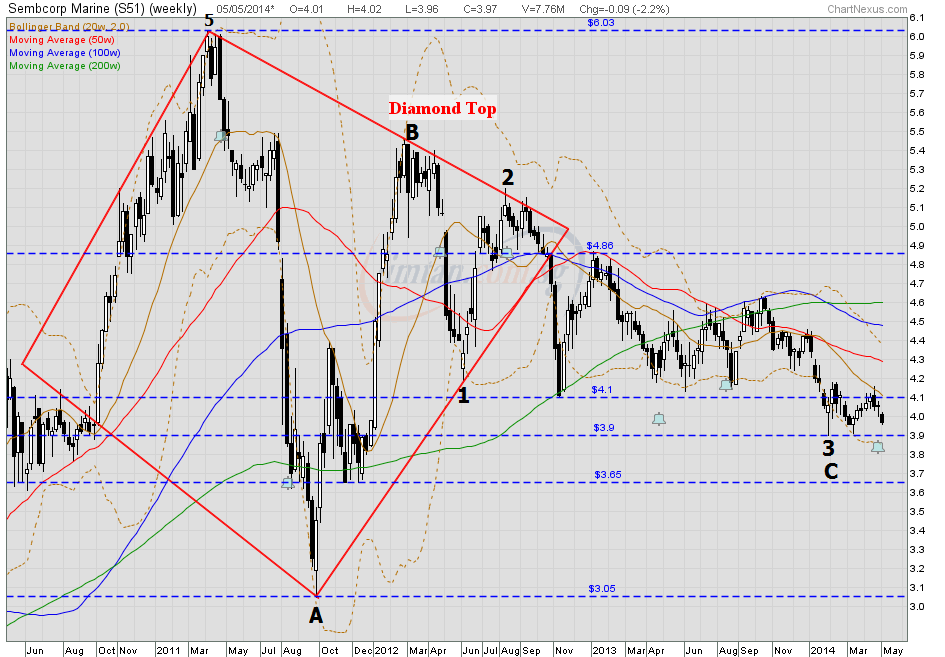 |
|
|
|
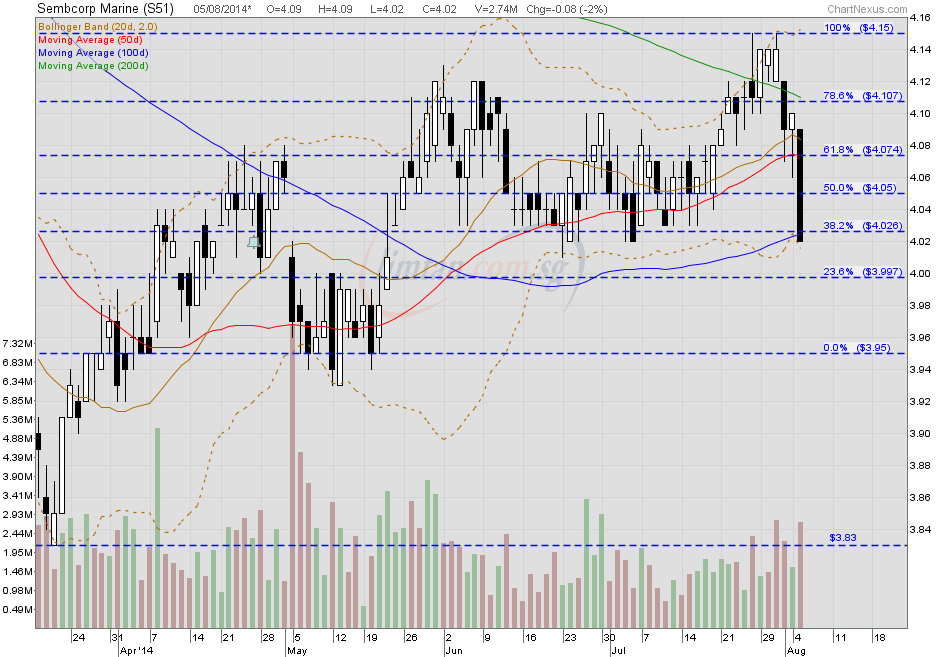
Post by zuolun on Aug 5, 2014 9:59:03 GMT 7
|
|
|
|
Post by zuolun on Sept 14, 2014 15:37:43 GMT 7
SembMar — H&S Breakout, Interim TP S$3.77, next TP S$3.65SembMar closed with a spinning top @ S$3.87 (+0.01, +0.3%) with 3.87m shares done on 12 Sep 2014. Immediate support @ S$3.81, immediate resistance @ S$3.90, longterm horizontal strong resistance @ S$4.10, below the 200d SMA.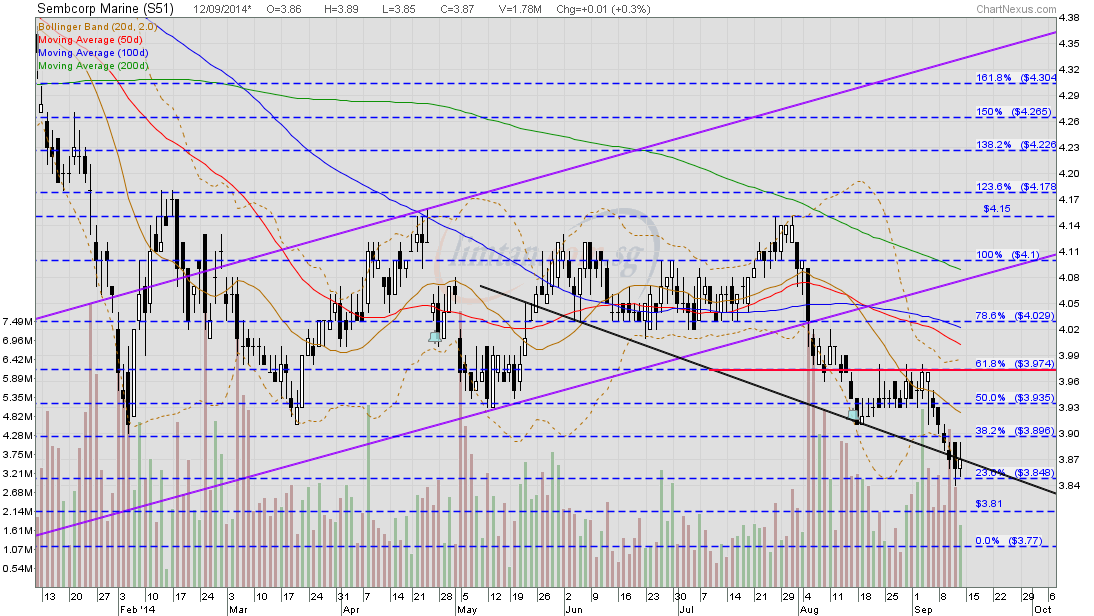 SMM gapped down and closed with a long black marubozu @ S$3.97 (-0.09, -2.2%) today 5 May 2014. SMM (weekly) chart showed an extremely huge bearish diamond top breakout @ S$4.86 dated 29th Oct 2012, it is likely to retest the last low @ S$3.05 scored on 4th Oct 2011 and hit lower low.
|
|
|
|
Post by zuolun on Sept 23, 2014 15:34:40 GMT 7
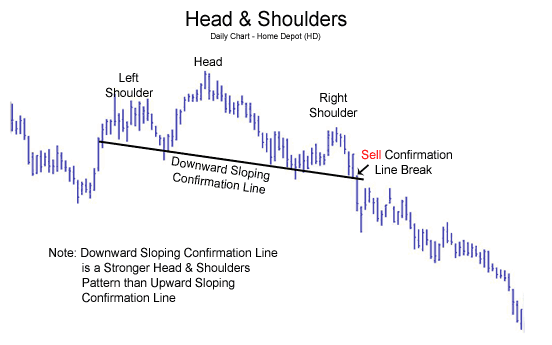 SembCorp Marine — Head and Shoulders / Bear Flag Breakout, Interim TP S$3.60, Next TP S$3.05 SembCorp Marine — Head and Shoulders / Bear Flag Breakout, Interim TP S$3.60, Next TP S$3.05SembCorp Marine had a long black marubozu @ S$3.70 (-0.06, -1.6%) with 2.88m shares done on 23 Sep 2014 at 4.25 pm. Immediate support @ S$3.70, immediate resistance @ S$3.78. 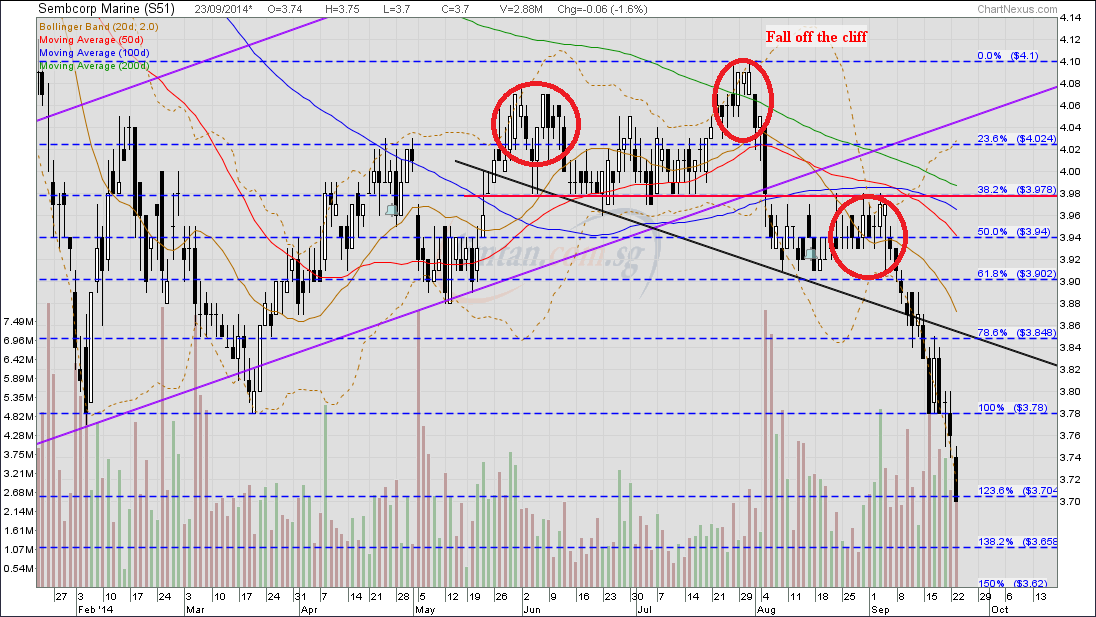 |
|
|
|
Post by kenjifm on Sept 25, 2014 14:39:59 GMT 7
Sembcorp Marine's Subsidiary SMOE secures LNG Process Modules Assembly Contract 23-Sep-2014 17:12:42 infopub.sgx.com/FileOpen/SCMPressRelease23Sep2014.ashx?App=Announcement&FileID=315645Announce on 23rd Sep 2014 but positive effect seen on 25th Sep 2014? Riding on Dow Jones Upside? Other then this news, their growth will still be slower. By looking at the chart, there is a confluence zone with a small hammer if you look closed up in your own chart. Downside is still in play unless we see a good upside break up from 4.15. Then again, will we see an upside from current 3.78 to 3.91 as a major resistance? This might be a dead cat bounce for the downtrend. Always remember this, the trend is your friend.  Your guess is as good as my guess. Trade Safely! |
|
|
|
Post by zuolun on Sept 25, 2014 17:13:46 GMT 7
SembCorp Marine — Dead Cat Bounce, biased to the downside TP S$3.65 next TP S$3.05SembCorp Marine closed with a bullish morning doji star pattern @ S$3.78 (+0.06, +1.6%) with 3.96m shares done on 25 Sep 2014. Immediate support @ S$3.70, immediate resistance @ S$3.81, strong resistance @ S$3.86. 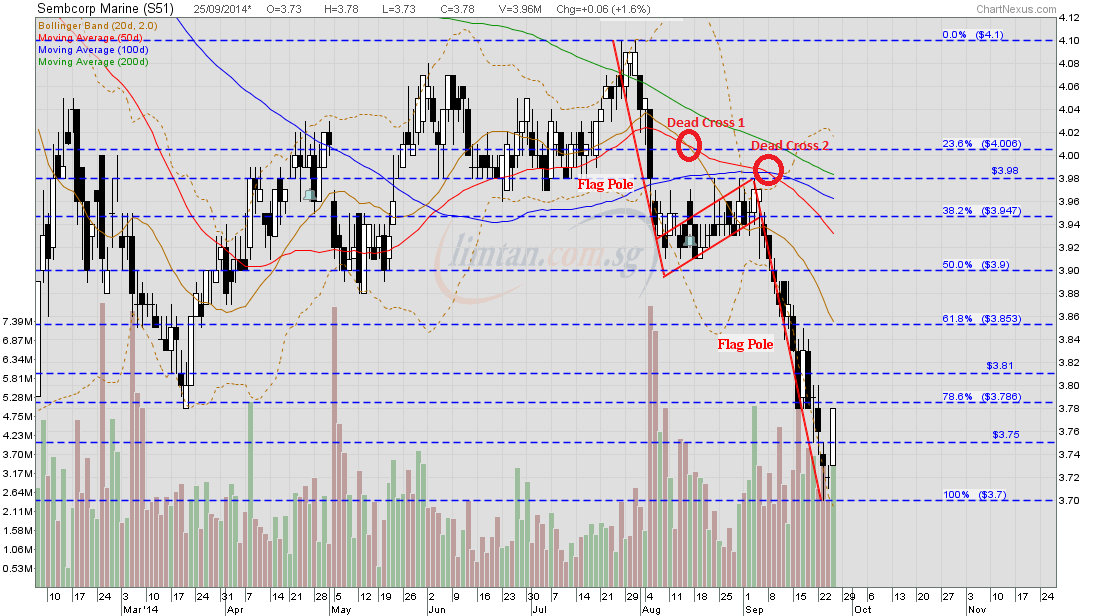 
|
|