|
|
Post by zuolun on Dec 22, 2013 7:51:43 GMT 7
GoldenAgri — Trading in a rectangle
Crucial support @ S$0.515, immediate resistance @ S$0.55, the 200d SMA.  GoldenAgri (weekly) — Trading in a downward sloping channel GoldenAgri (weekly) — Trading in a downward sloping channel

|
|
|
|
Post by zuolun on Mar 8, 2014 10:46:12 GMT 7
|
|
|
|
Post by zuolun on Dec 17, 2014 13:14:17 GMT 7
In technical analysis, a stock that has made a new low is a decisive signal to short, not long. GoldenAgri — A "Waterfall Decline", Interim TP S$0.355, Next TP S$0.275Golden Agri had a long black marubozu @ S$0.425 (-0.02, -4.5%) with 41.1m shares done on 17 Dec 2014 at 2pm. immediate support @ S$0.405, immediate resistance @ S$0.445. 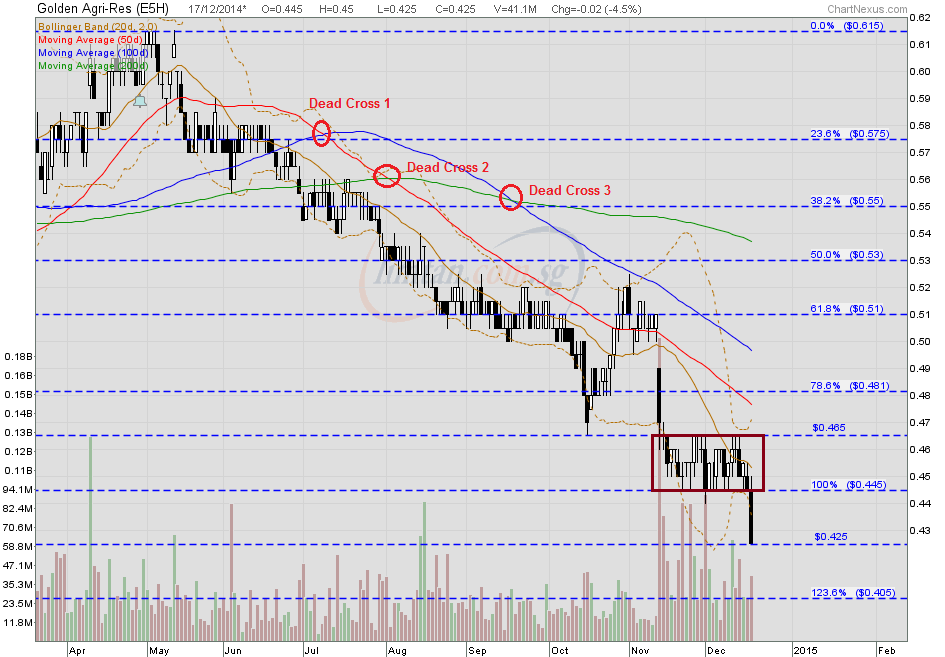 GoldenAgri (monthly) — Bearish Descending Triangle Breakout, biased to the downside, Interim TP S$0.275 GoldenAgri (monthly) — Bearish Descending Triangle Breakout, biased to the downside, Interim TP S$0.275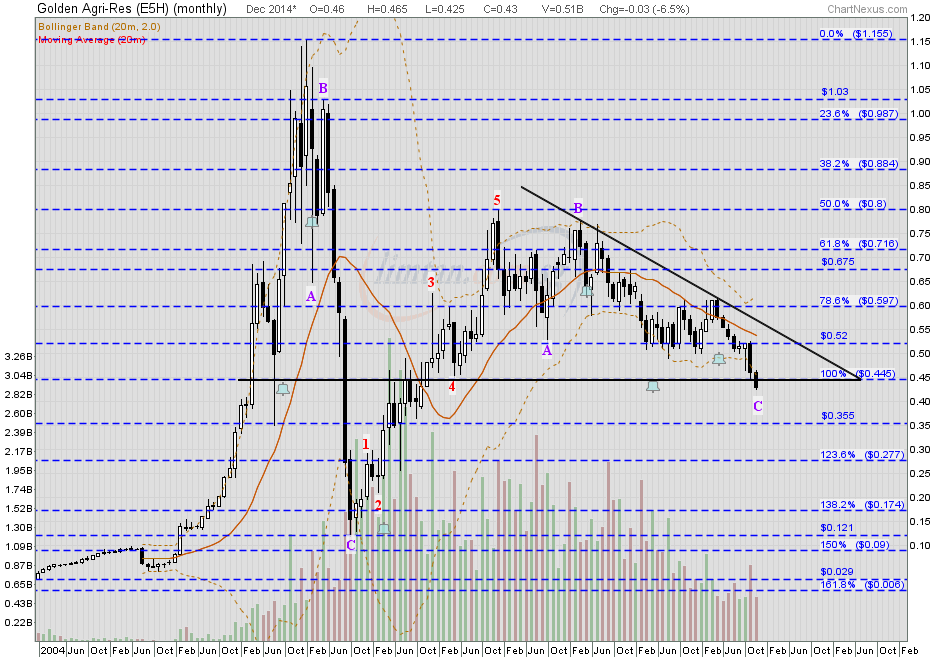
|
|
|
|
Post by zuolun on Feb 8, 2016 7:23:47 GMT 7
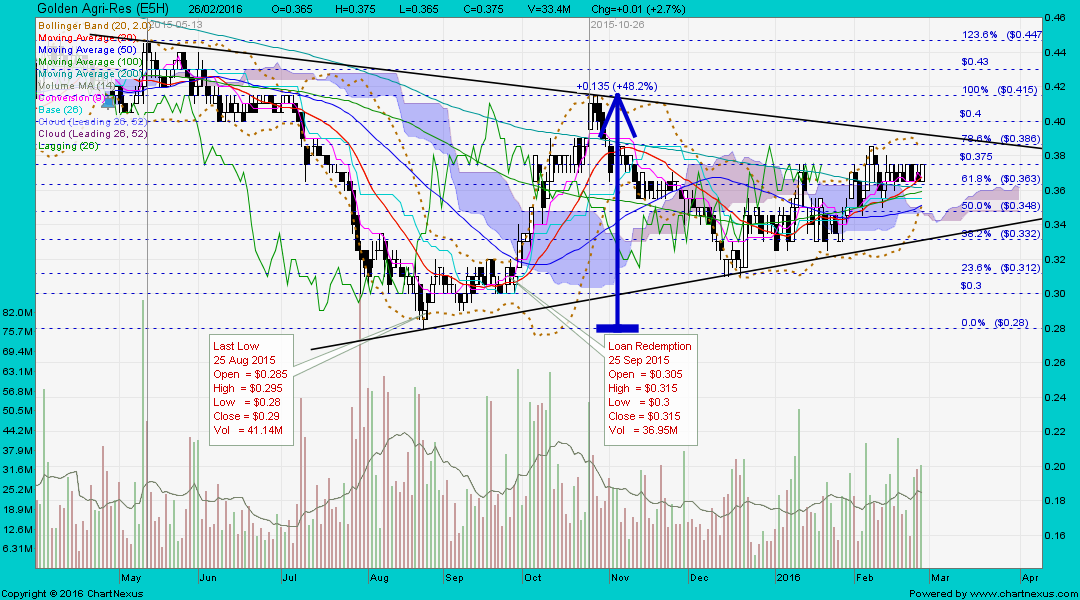
Palm oil prices to rise on tight stocks, may hit 2,700 rgt in Q2 ~ 7 Feb 2016 Call to end palm oil price war ~ 6 Feb 2016 BMI Research: Golden Agri’s performance in the coming quarters will likely remain sluggish as palm oil production is tipped to be slow or even register negative growth. Meanwhile, downstream operations will continue to be hurt by lingering overcapacity, and the outlook for the company’s oilseed division in China remains ncertain, BMI Research has kept a “neutral” view on the company’s strategy over the long term due to enduring headwinds in the refining sector and the relatively low and declining margins due to rising expenses. ~ 28 Jan 2016 Golden Agri 9M15 earnings up 261% despite revenue slip ~ 13 Nov 2015 Why the 200d SMA is important: The Simple Moving Average (SMA) is the average price of an asset over a certain period of time. It is calculated by adding up the closing prices over a certain number of time periods, and then dividing by that number of time periods. SMA’s are used to measure momentum. The most watched SMA is the 200 day, it is widely recognized as the dividing line between bull and bear territory. The primary trend is considered to be up as long as the market is trading above its 200-day moving average but this trend turns bearish whenever the market closes below this average. GoldenAgri ~ Symmetrical triangle formationGolden Agri closed with a white marubozu @ S$0.385 (+0.01, +2.7%) with 23.6m shares done on 5 Feb 2016. Immediate support @ S$0.375, immediate resistance @ S$0.40. 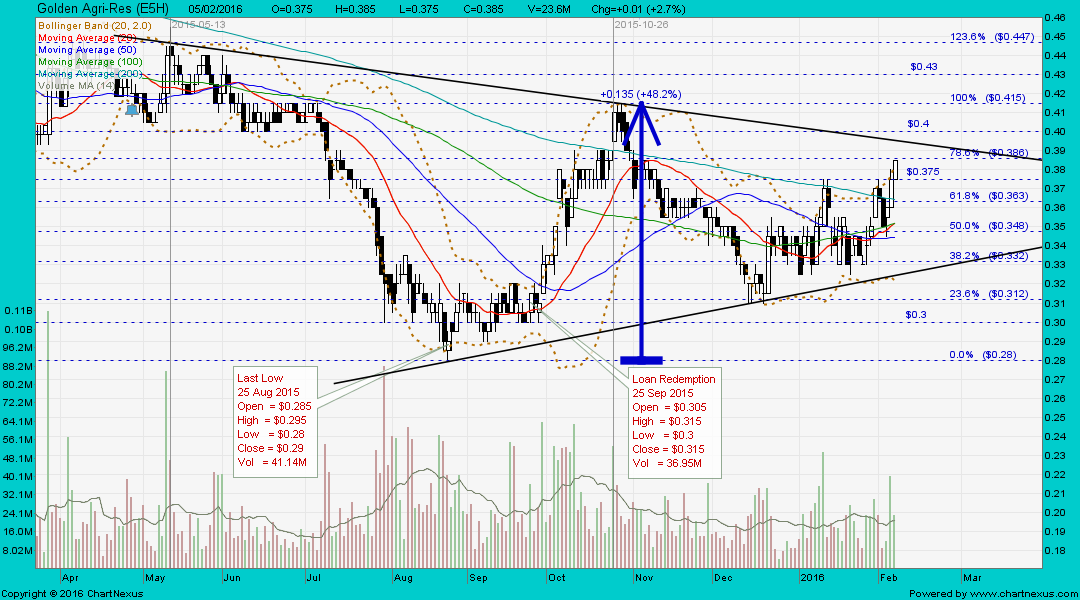
|
|
|
|
Post by zuolun on Feb 27, 2016 6:45:03 GMT 7
|
|
|
|
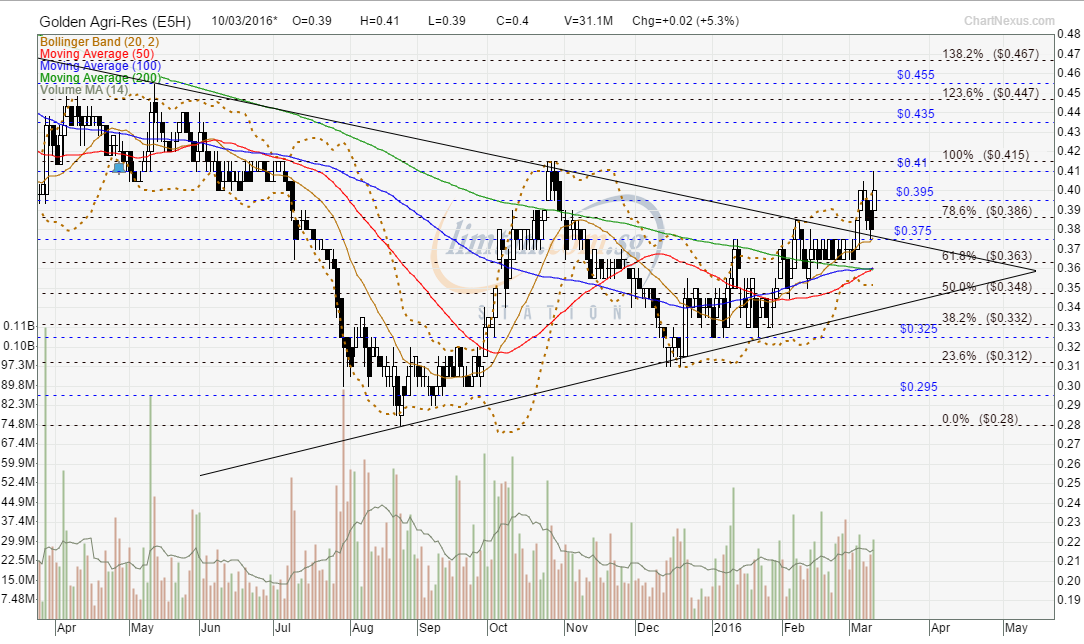
Post by zuolun on Mar 10, 2016 14:32:40 GMT 7
|
|