|
|
Post by zuolun on May 22, 2014 13:20:14 GMT 7
The best time to short big is after the "Cheng Kay Run Road Signal" has just appeared coupled with confirmation of no more stabilizing managers around. Especially on syndicate stocks; when every crucial support (measured by FIBO) is broken convincingly, the stock price will collapse fast and furious. "A stock is never too high to buy and never too low to short." — Jesse Livermore  MEGB — Evening Doji Star MEGB — Evening Doji Star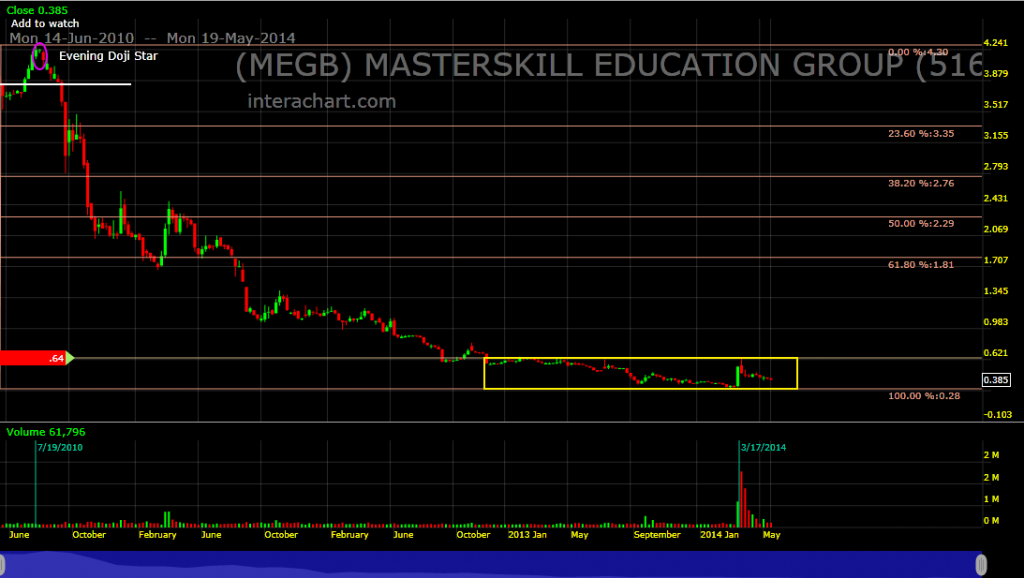 CSL — Dark cloud Cover CSL — Dark cloud Cover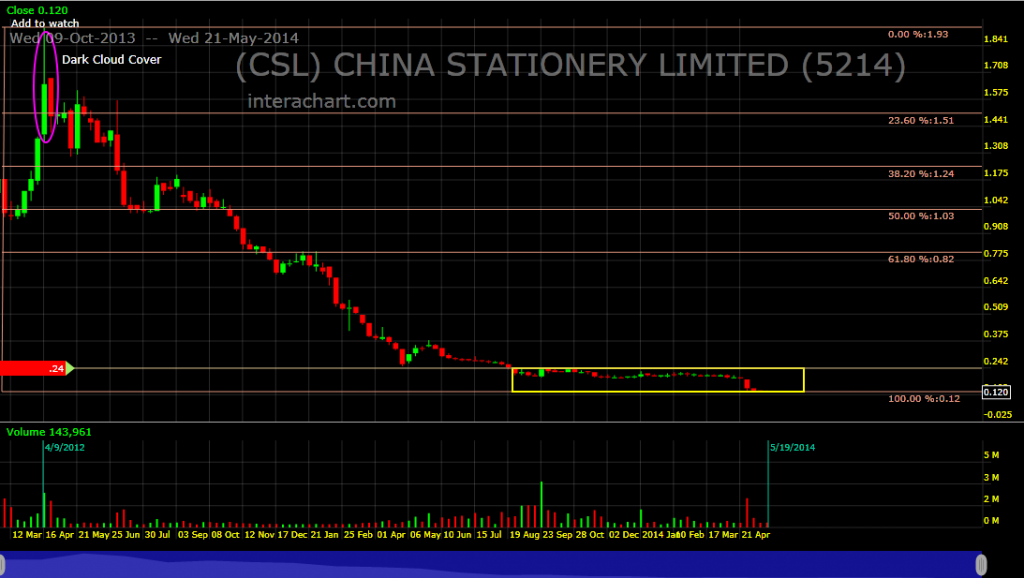 |
|
|
|
Post by zuolun on May 23, 2014 14:48:11 GMT 7
How to determine if there is a Cheng Kay manipulating the stockI ever worked in the former Singapore Turf Club at Racecourse road. I noticed all the racing horses always run fast but they run orderly within the track lines and never crashed into each other. If they crash it's accident, which means both the horse and the jockey riding on it will be badly injured. It goes the same with stocks; the share price hardly moves if there is no Cheng Kay manipulating it. When there is a Cheng Kay manipulating a stock, you see the price moves very fast and orderly; similar to horse racing in the Singapore Turf Club. I draw my chart with many lines like those horse racing track lines and the box represents the horse; the uptrend is sustainable as long as there is a Cheng Kay inside, irrespective of time. If the horse runs below the immediate track line at the peak, it means the Cheng Kay who controls the horse is getting ready to run road. The moment the horse runs wild and crashes into many track lines below, it indicates that the Cheng Kay is gone and he let the horse die liao... While other stocks have many Cheng Kays + gatekeepers involved, SuperGroup is such a unique stock with only one major cheng kay + gatekeepers, so when that particular Cheng Kay began to run road starting from 12 Aug 2013 followed by mid-Nov 2013, the price action and trading volume clearly reflected on the chart.  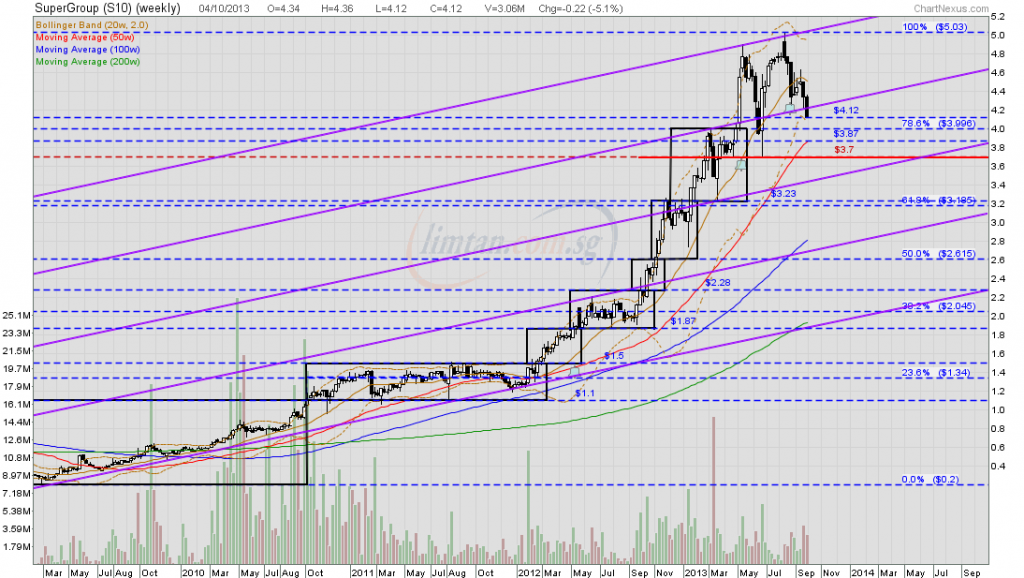 SuperGroup — Three Black Crows SuperGroup — Three Black Crows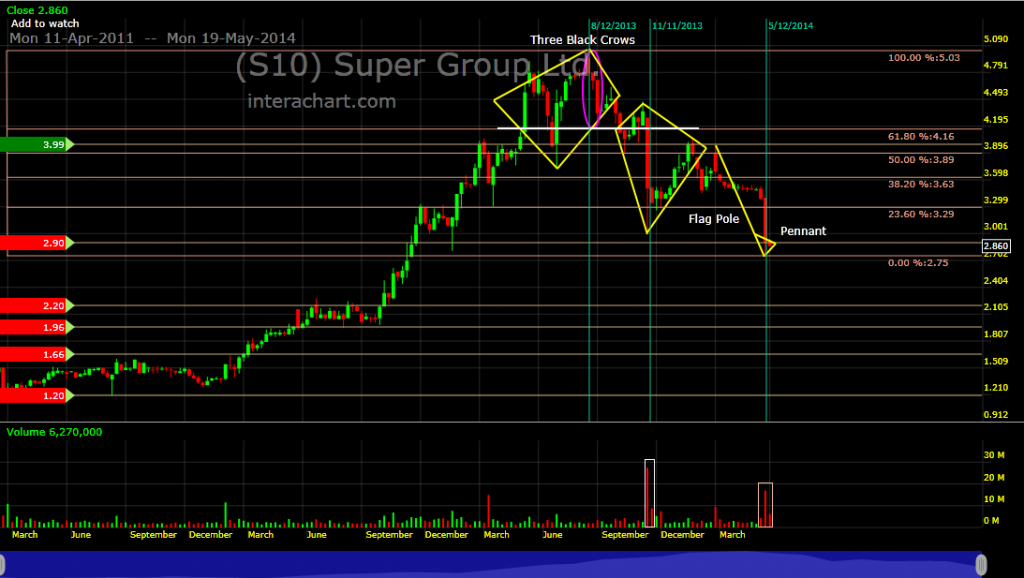
|
|
|
|
Post by chlio on May 24, 2014 13:24:57 GMT 7
Interesting. The question for me to think is - how can I profit from identifying Chng Kay Run Road signs?
|
|
|
|
Post by zuolun on May 24, 2014 14:10:02 GMT 7
Interesting. The question for me to think is - how can I profit from identifying Chng Kay Run Road signs? From a TA point of view; Cheng Kay run road signal appeared at the peak coupled with confirmation means sell if you're long and go short using CFD. |
|
|
|
Post by stockpicker on May 25, 2014 20:47:33 GMT 7
Hi chlio,
Guess there will no good answer to your question because there is just not enough information that one can pin point what had happened. Is it really due to some SSH selling or it is due to margin calls that kept SuperGroup coming up with selling and selling waves one after another or it is just someone taking opportunities to short-sell because of dismay result and challenging business environment ahead? We really don't know. Say, we now know that there are two "falling knives" in SuperGroup appearing over the last few months. The most recent one just about a week ago, bringing the price from 3.3 to 2.86. We all knew the fall is about to end but is it really? and when? some will rely on charts; others will rely on stars; may be some asked earthly Gods.. this is anyone's play. There just isn't enough information. One can only answer if one can profit will depend on whether one has predicted the correct move and if one has disciplines to overcome one's losses when one has made a wrong prediction.
|
|
|
|
Post by zuolun on May 25, 2014 23:52:38 GMT 7
Simplemind, All stocks have this "Cheng Kay Run Road Signal", some are very obvious if you train your eyes to look at charts without indicators. ISDN was one of the syndicate stocks which gave you the "Cheng Kay Run Road Signal" to sell above S$1.00 b4 the collapse then. 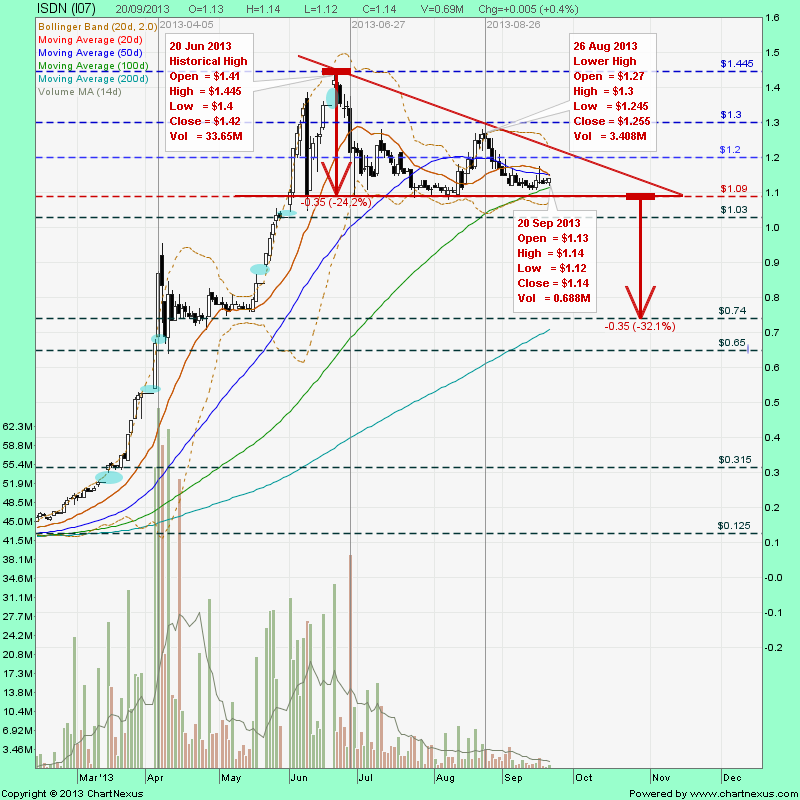 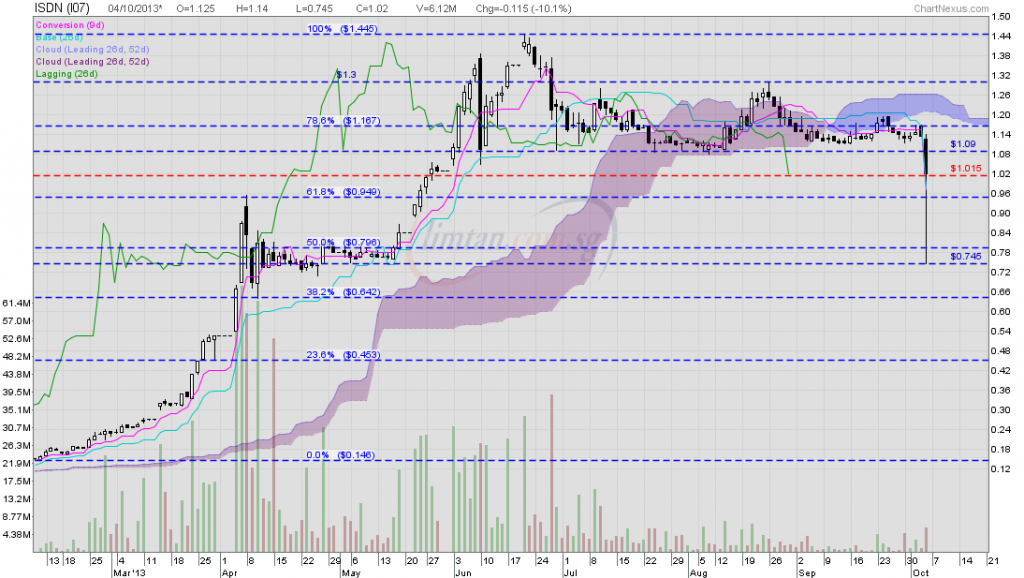 ISDN — A "Waterfall Decline" (仙女散花)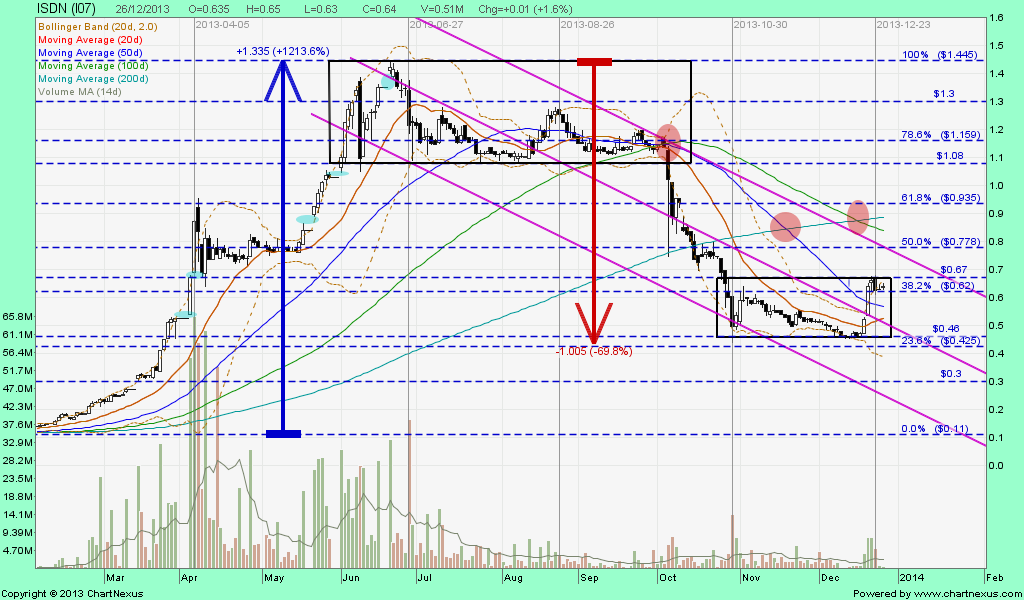 |
|
|
|
Post by chlio on May 26, 2014 8:40:04 GMT 7
Hi zuolun & stockpicker, many thx for replying. After reading Dr. Michael Leong's book some time ago, I am still trying to figure out the right style of making my money work for me. Previously, I also consulted Dr. Leong about gold when he was still active in Facebook. As it turned out, he was right about gold. I was singing a different tune as I was accumulating gold on a monthly basis. Well, I hope to learn more. |
|
|
|
Post by zuolun on May 26, 2014 12:51:59 GMT 7
Hi zuolun & stockpicker, many thx for replying. After reading Dr. Michael Leong's book some time ago, I am still trying to figure out the right style of making my money work for me. Previously, I also consulted Dr. Leong about gold when he was still active in Facebook. As it turned out, he was right about gold. I was singing a different tune as I was accumulating gold on a monthly basis. Well, I hope to learn more. I'm still bearish on gold to date, as the "Cheng Kay Run Road Signal" had already appeared, after it hit record high of US$1,921.15 on 6 Sep 2011. oldman, I'm bearish on gold...its chart pattern looks like "The Flying Guillotine".  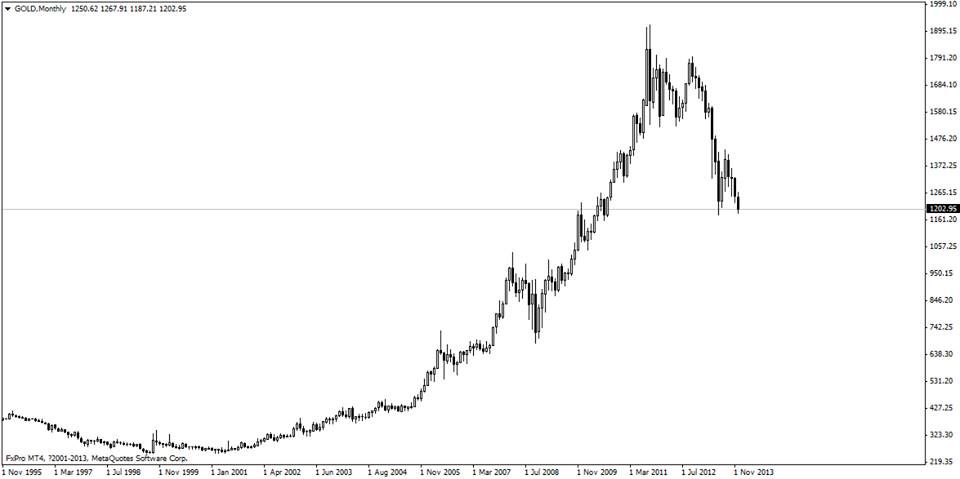 |
|
|
|
Post by oldman on Sept 24, 2014 15:54:27 GMT 7
We must also not forget to thank the CKs as without them the market will be boring. They are also the ones who can make shares zoom to the moon and crash back to earth. As investors, we should be aware of their presence and the impact that they can have on share prices. We should learn to recognise patterns of operations and be nimble enough to take advantage of such situations. As passengers in the journey, we should not be greedy as we must always recognise that the heavy lifting is done by them and we are just riding along. We must also recognise that our financial gains are not because we are smart, it is because we are just lucky to be riding with them, in the right direction. |
|
|
|
Post by zuolun on Sept 24, 2014 22:50:10 GMT 7
We must also not forget to thank the CKs as without them the market will be boring. They are also the ones who can make shares zoom to the moon and crash back to earth. As investors, we should be aware of their presence and the impact that they can have on share prices. We should learn to recognise patterns of operations and be nimble enough to take advantage of such situations. As passengers in the journey, we should not be greedy as we must always recognise that the heavy lifting is done by them and we are just riding along. We must also recognise that our financial gains are not because we are smart, it is because we are just lucky to be riding with them, in the right direction. oldman, "How to spot the signs of syndicate presence or syndicate manipulations"It is a better version of my "Cheng Kay Run Road Signal" based on the horse racing track lines.    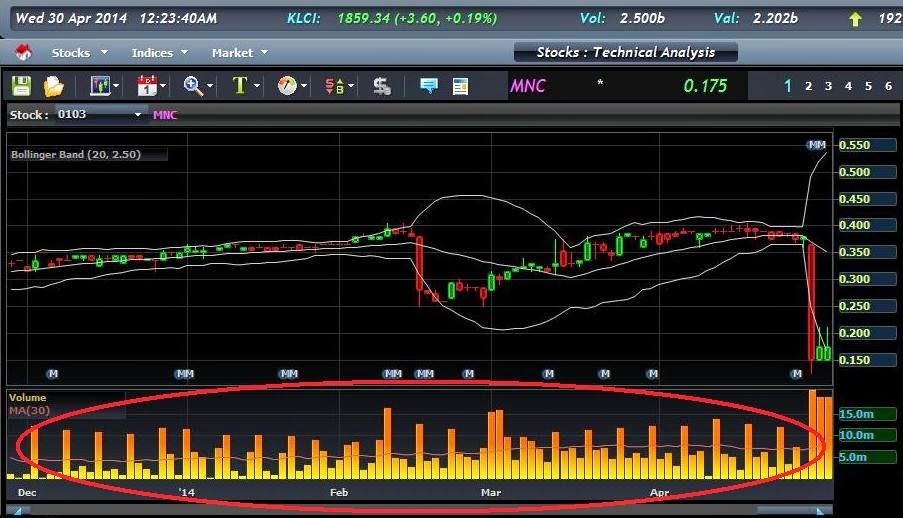 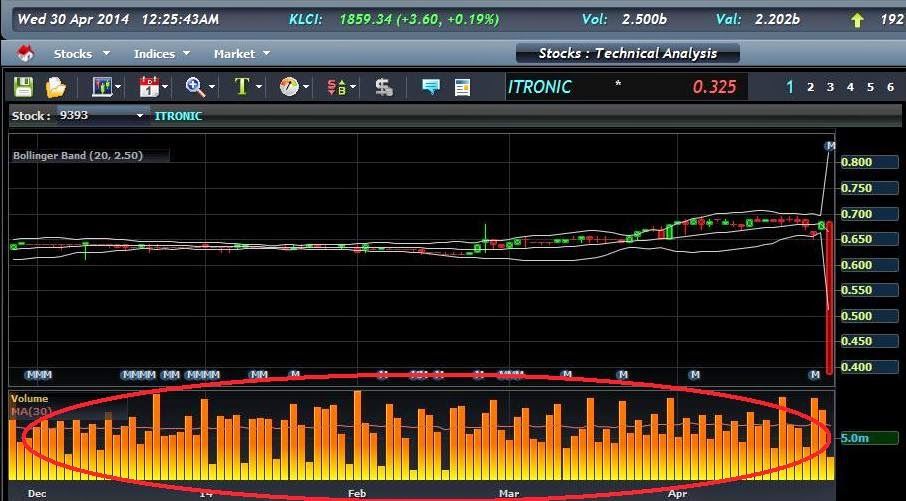 |
|
|
|
Post by roberto on Jan 1, 2015 22:07:03 GMT 7
Is there a way to find out a fund/SSH's average price in a particular stock? Some may have been involved in a stock for more than 10 years, and to manually compute yourself using SGX announcements, one can only go back to 2010 (SGX's company disclosure page).
|
|
|
|
Post by zuolun on Jan 2, 2015 4:16:41 GMT 7
Is there a way to find out a fund/SSH's average price in a particular stock? Some may have been involved in a stock for more than 10 years, and to manually compute yourself using SGX announcements, one can only go back to 2010 (SGX's company disclosure page). The latest percentage of shares owned by any major longterm funds/SSHs (updated on the SGX's company disclosure page) is more important than the average purchase price bought over a long period of time (more than 10 years). One good example is SembCorp Marine. The stock has peaked @ S$5.03 and the longterm downtrend chart indicates that persistent strong selling pressure has been in place since 2011 till to-date and it's not done yet. SMM's strong selling pressure won't disappear overnite because when longterm funds buy; they'll buy, buy-on-dip and hold-long-long. However, when they sell; they'll sell and short-sell-long-long, thus the downtrend resumes after every dead cat bounce. Supply > Demand = Decrease in price.
The most heavy-weight diamond is the one in SMM...it has been rolling down from the cliff, slow and steady... 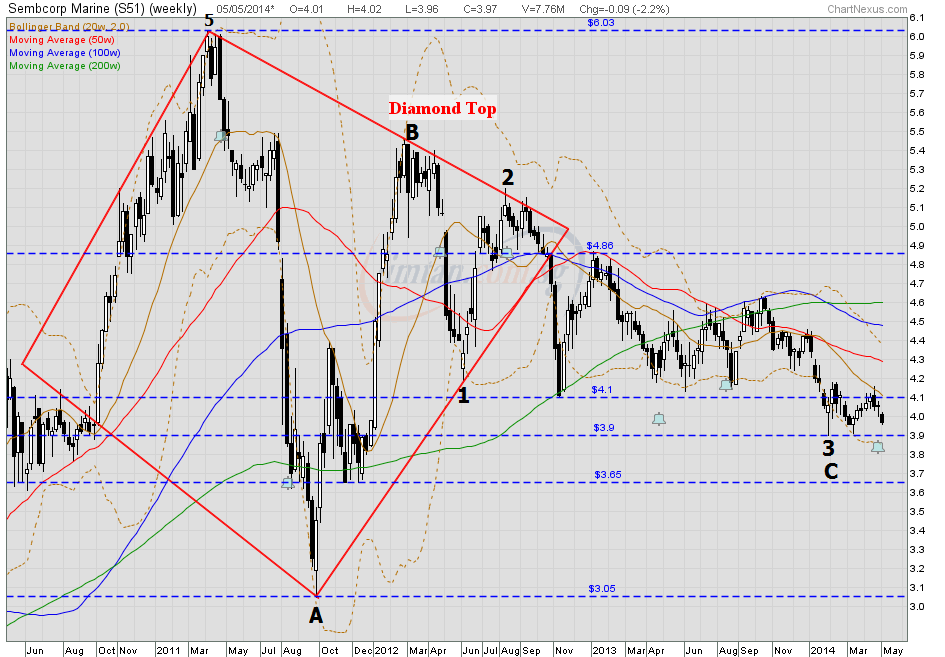 |
|
|
|
Post by roberto on Jan 2, 2015 13:50:11 GMT 7
zuolun, I think I understand the principle of what you're trying to say, and I agree. I may have phrased my question inaccurately and hence, I'll use SembCorp Marine as an e.g. to show what I'm getting at.   Referring to the two attachments obtained from SGX's StockFacts screener, I'm wondering if there's a way to find out the avg price that the major shareholders are currently holding at. My basis of interest is that they may be unlikely to sell if they are "underwater" and may choose to avg down instead. In the case of Semb Marine, while I think it's unlikely Sembcorp Industries will sell its Semb Marine shares, perhaps Franklin or Vanguard would give less of a hoot, and do so when they get a chance. If there's a better or alternative way to look at this I'm open to hearing it, from anyone. We're here to learn after all. Thanks man. |
|
|
|
Post by zuolun on Jan 2, 2015 14:22:01 GMT 7
zuolun, I think I understand the principle of what you're trying to say, and I agree. I may have phrased my question inaccurately and hence, I'll use SembCorp Marine as an e.g. to show what I'm getting at. Referring to the two attachments obtained from SGX's StockFacts screener, I'm wondering if there's a way to find out the avg price that the major shareholders are currently holding at. My basis of interest is that they may be unlikely to sell if they are "underwater" and may choose to avg down instead. In the case of Semb Marine, while I think it's unlikely Sembcorp Industries will sell its Semb Marine shares, perhaps Franklin or Vanguard would give less of a hoot, and do so when they get a chance. If there's a better or alternative way to look at this I'm open to hearing it, from anyone. We're here to learn after all. Thanks man. roberto, Sometimes ago in Nov 2013, I happened to know by chance that one reputable and best-performed fund has been doing portfolio alignment — to progressively pare down its big chunk of underperformed SembCorp Marine shares. (Re my postings dated 9 Dec 2013 and 5 May 2014.) Based on the current price action and volume on the SMM's chart, it shows that there are more than one big sellers. The 3 dead crosses showed on SMM's weekly chart are key indicators that the stock has more downside than upside. Going against the major trend to play the dead cat bounce is ok but longterm wise when the BBs are dumping the stock and the price hits lower low and lower high repeatedly; it is advisable to short / sell on strength, not long. SembCorp Marine (weekly) — Classic MOD chart pattern TP S$2.10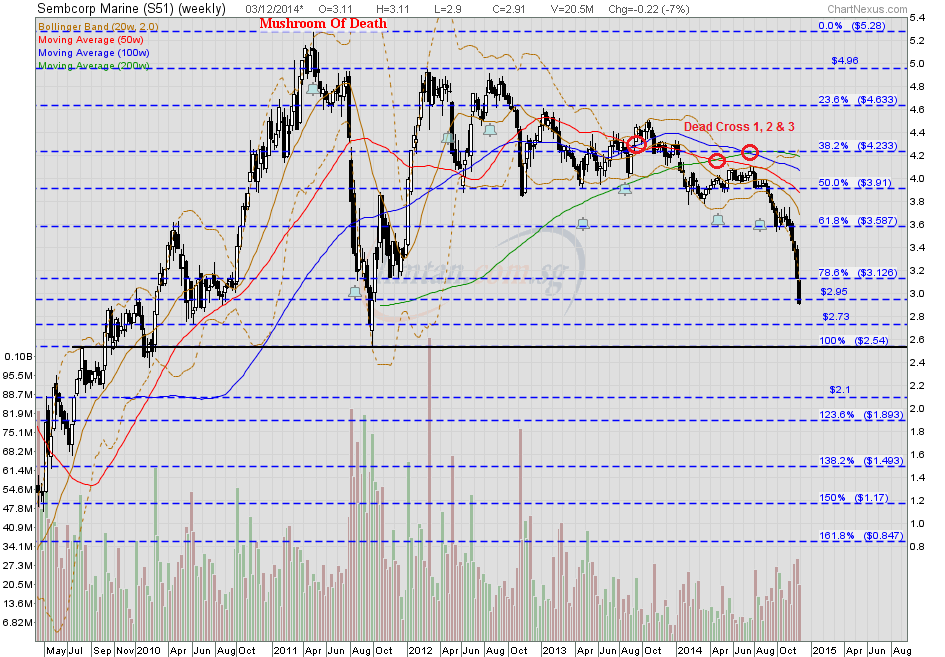 odie, One of the best-performed Funds is doing portfolio adjustment on SMM as it is the worst stock stuck in the Fund for 18 months. Don't touch this stock now until the selling is done. pertama.freeforums.net/post/1687simplemind, Don't touch this stock. SMM's strong selling pressure won't disappear overnite because when longterm funds buy; they'll buy, buy-on-dip and hold-long-long. However, when they sell; they'll sell and short-sell-long-long, thus the downtrend resumes after a dead cat bounce. Supply > Demand = Decrease in price"At the end of the day, the rise and fall of stock prices are more about demand and supply and much less about fundamentals." — oldman |
|


