Post by zuolun on Jun 26, 2015 9:26:00 GMT 7
sptl123,
Silverlake's corrective A-B-C Wave reminds me of Supergroup's corrective A-B-C Wave, i.e. the decisive SELL signal for Silverlake should be after the completion of the 1-for-5 bonus issue. With an increase of 20% Silverlake shares, the volatility of the share price is likely similar to SuperGroup, after the 1st leg down or after the initial ABCD pattern is completed. The bonus issue is a blessing in disguise; it is a catalyst for the short-sellers to whack Silverlake's share price to collapse much further down.
Silverlake's baseline support level @ S$0.198 Vs SuperGroup's baseline support level @ S$0.22, the collapse in share price should be at a similar Fibonacci retracements ratio in percentage, based on prior bonus issues of both stocks.

 Bro zuolun
Silverlake Axis closed at S$1.14 (-0.03, -2.56%) with 2.704 million shares traded on 25th June 2015.
Emerging AB=CD Pattern. TP= S$ 0.83 as what you have projected previously.
Bro Zuolun would you open short at Silverlake Axis? If you do, let us know so we could follow and provide support fire to shoot it down.

 sptl123,
Silverlake peaked @ S$1.46 (point x or point 5) on 6 Apr 2015 and had completed the impulsive 5-Wave up; it's now riding on the corrective A-B-C Wave down. Its share price collapsed S$0.53 or 36.3% to S$0.93 (point a or point A) on 8 Jun 2015. It then rebounded to S$1.25 (point b, the 38.2% Fibonacci retracements) on 22 Jun 2015. Yesterday, 25 Jun 2015, Silverlake closed with a spinning top @ S$1.14 (-0.03, -2.6%). The Gartley pattern is a subset of the Elliott Wave pattern, based on the corrective A-B-C Wave; the potential AB=CD pattern is likely to 1st hit S$0.995 (point c, the 88.6% Fibonacci retracement level) and then rebound to point d or point B (the target projections or resistance levels can be anywhere @ S$1.335, S$1.37 and S$1.41), b4 it continues its downside movement to form a lower low @ S$0.805 or point C, the 123.6% Fibonacci retracement level (depending on point d or point B, the target projections or support levels can be anywhere between S$$0.905 to S$0.805).
Should this scenario (Fibonacci retracements ratio) materialise, Silverlake would have completed the Bearish Gartley Bat pattern @ S$0.805 or point C.
For short-trades, take note Silverlake: 1-for-5 bonus issue – Notice of books closure date ~ 24 Jun 2015

Silverlake Axis ~ Bearish Gartley Bat Formation
Silverlake closed with a spinning top @ S$1.14 (-0.03, -2.6%) with 2.7m shares done on 25 Jun 2015.
Immediate support @ S$1.09, immediate resistance @ S$1.195.

Silverlake (weekly 2 Jan 2012 to 5 Jun 2015) ~ The Elliott Wave pattern; riding on the corrective A-B-C Wave
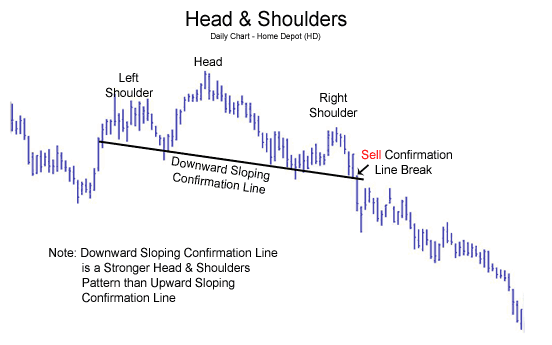
 SuperGroup — H&S breakout
With the neckline of the H&S @ S$3.70 broken convincingly with extremely high volume;
SuperGroup has now become a prime target for short-selling after the last burst of fire @ S$5.03, the impulse Wave-5 completed on 12 Aug 2013.
As at 12 Nov 2013 at 4.35pm, SuperGroup hits low of S$3.53, high of S$3.97 and has a "Three Black Crows" chart pattern.

SuperGroup — The Elliott Wave pattern as at 8 Oct 2013
SuperGroup is now on the correction Wave-A down.


As at 25 Sep 2013, SuperGroup had a rare diamond top chart pattern.

Silverlake's corrective A-B-C Wave reminds me of Supergroup's corrective A-B-C Wave, i.e. the decisive SELL signal for Silverlake should be after the completion of the 1-for-5 bonus issue. With an increase of 20% Silverlake shares, the volatility of the share price is likely similar to SuperGroup, after the 1st leg down or after the initial ABCD pattern is completed. The bonus issue is a blessing in disguise; it is a catalyst for the short-sellers to whack Silverlake's share price to collapse much further down.

Silverlake's baseline support level @ S$0.198 Vs SuperGroup's baseline support level @ S$0.22, the collapse in share price should be at a similar Fibonacci retracements ratio in percentage, based on prior bonus issues of both stocks.


Silverlake Axis closed at S$1.14 (-0.03, -2.56%) with 2.704 million shares traded on 25th June 2015.
Emerging AB=CD Pattern. TP= S$ 0.83 as what you have projected previously.
Bro Zuolun would you open short at Silverlake Axis? If you do, let us know so we could follow and provide support fire to shoot it down.


Silverlake peaked @ S$1.46 (point x or point 5) on 6 Apr 2015 and had completed the impulsive 5-Wave up; it's now riding on the corrective A-B-C Wave down. Its share price collapsed S$0.53 or 36.3% to S$0.93 (point a or point A) on 8 Jun 2015. It then rebounded to S$1.25 (point b, the 38.2% Fibonacci retracements) on 22 Jun 2015. Yesterday, 25 Jun 2015, Silverlake closed with a spinning top @ S$1.14 (-0.03, -2.6%). The Gartley pattern is a subset of the Elliott Wave pattern, based on the corrective A-B-C Wave; the potential AB=CD pattern is likely to 1st hit S$0.995 (point c, the 88.6% Fibonacci retracement level) and then rebound to point d or point B (the target projections or resistance levels can be anywhere @ S$1.335, S$1.37 and S$1.41), b4 it continues its downside movement to form a lower low @ S$0.805 or point C, the 123.6% Fibonacci retracement level (depending on point d or point B, the target projections or support levels can be anywhere between S$$0.905 to S$0.805).
Should this scenario (Fibonacci retracements ratio) materialise, Silverlake would have completed the Bearish Gartley Bat pattern @ S$0.805 or point C.
For short-trades, take note Silverlake: 1-for-5 bonus issue – Notice of books closure date ~ 24 Jun 2015
Silverlake Axis ~ Bearish Gartley Bat Formation
Silverlake closed with a spinning top @ S$1.14 (-0.03, -2.6%) with 2.7m shares done on 25 Jun 2015.
Immediate support @ S$1.09, immediate resistance @ S$1.195.
Silverlake (weekly 2 Jan 2012 to 5 Jun 2015) ~ The Elliott Wave pattern; riding on the corrective A-B-C Wave
With the neckline of the H&S @ S$3.70 broken convincingly with extremely high volume;
SuperGroup has now become a prime target for short-selling after the last burst of fire @ S$5.03, the impulse Wave-5 completed on 12 Aug 2013.
As at 12 Nov 2013 at 4.35pm, SuperGroup hits low of S$3.53, high of S$3.97 and has a "Three Black Crows" chart pattern.
SuperGroup — The Elliott Wave pattern as at 8 Oct 2013
SuperGroup is now on the correction Wave-A down.
As at 25 Sep 2013, SuperGroup had a rare diamond top chart pattern.