|
|
Post by zuolun on May 29, 2014 14:59:54 GMT 7
One of the Elliott Wave rules stated that Wave-3 cannot be the shortest wave. - Rule 1: Wave 2 cannot retrace more than 100% of Wave 1.
- Rule 2: Wave 3 can never be the shortest of the three impulse waves.
- Rule 3: Wave 4 can never overlap Wave 1.
Usually for commodities, Wave-5 will be the longest wave; while for stocks, Wave-3 will be the longest wave and a minimum target for Wave-5 is 100% of Wave-1. |
|
|
|
Post by zuolun on May 31, 2014 3:40:14 GMT 7
One of the Elliott Wave rules stated that Wave-3 cannot be the shortest wave. - Rule 1: Wave 2 cannot retrace more than 100% of Wave 1.
- Rule 2: Wave 3 can never be the shortest of the three impulse waves.
- Rule 3: Wave 4 can never overlap Wave 1.
Usually for commodities, Wave-5 will be the longest wave; while for stocks, Wave-3 will be the longest wave and a minimum target for Wave-5 is 100% of Wave-1. Introduction to Elliott Wave Theory |
|
|
|
Post by zuolun on Jun 25, 2014 5:26:59 GMT 7
“射击之星” 又称为 “倒转锤头” 或 “流星” 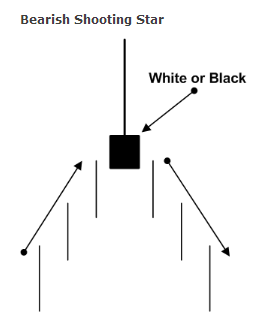 一根K线要成为射击之星,必须满足以下两个基本条件: 一根K线要成为射击之星,必须满足以下两个基本条件:
1、 K线实体要很小,下影线很小或没有,但上影线要很长。
2、 出现在上升趋势中,通常有一段较大涨幅。
什么是射击之星
射击之星又称为“倒转锤头”,仿如枪的准头,是以有此称谓。射击之星可以是阴线或阳线,但实体比较短小,上影线较长,其位置主要出现在某只个股的顶部,是一种十分明显的见顶信号。这一形态的形成是开盘价比较低,多头组织力量向上攻,一度急升,但尾市卖压加强,收市价又回落至开盘价附近。射击之星因为光芒短暂又被称为“流星”。
射击之星通常出现在顶部,当大市已有一段升幅之后,一旦出现射击之星,往往预示着大市可能反转,准确性较高。射击之星也会出现在底部,主要是投资人的心态不稳定所造成的。因此,射击之星出现在底部是良好的买点,而出现在顶部则是良好的卖点。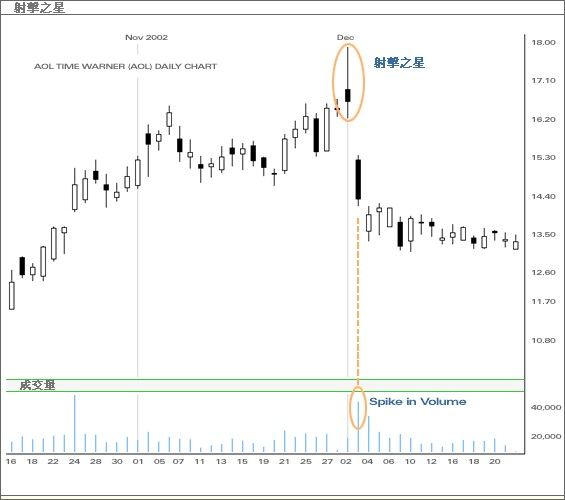 射击之星的形态特征 射击之星的形态特征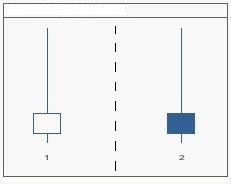 1、此前存在一个明显的上升趋势。 1、此前存在一个明显的上升趋势。
2、在股价上升过程中出现一根带上影线的小实体并向上跳空高开。
3、上影线的长度至少是实体长度的两倍;下影线短到可以认为不存在。
射击之星形态如果在高位出现,行情下跌的可能性较大。  应用法则: 应用法则:
1、 射击之星形态出现在短期的上升趋势,它发出警告信号,表明市场顶部就在眼前。本形态的技术意义不如黄昏星形态强,通常不构成主要反转信号。但常和其它K线组合构成更有研判意义的形态。
2、 如果在射击之星形态出现时,带有巨大成交量,则因短期多头资金短缺,空头将大量筹码抛出,股价先扬后抑,完成了一个由多转空的心理过程,故行情可能短期见顶而走疲。
“射击之星”的技术形态是一根带长长上影线的K线,其位置主要出现在某只个股的顶部,是一种十分明显的见顶信号。从出现射击之星技术形态的个股的连续K线形态可以看到,当这类个股的股价一直向上攀升,达到了一个相对高的位置时,主力往往会在顶部做一次加速向上的突破拉升,但收盘时,股价会回落至原位,这时的K线形态在顶部出现了一根带长上影线的K线。这根K线的实体可以是一根阳线,也可以是一根阴线。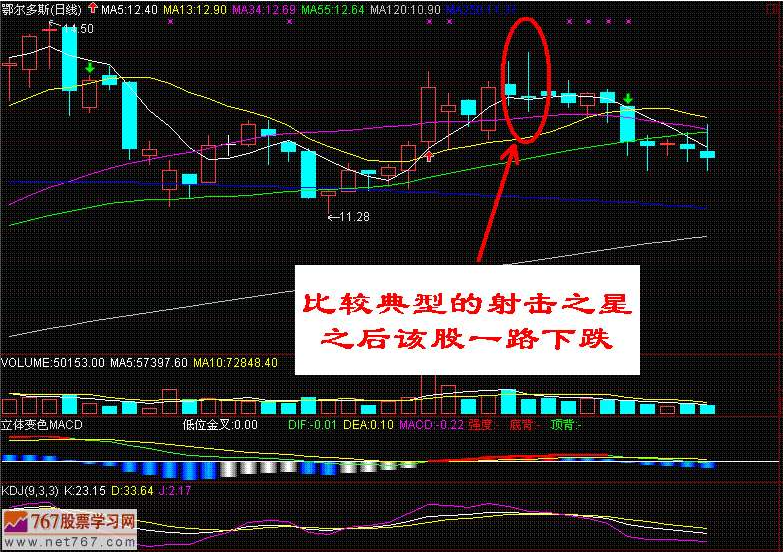 在上升行情中出现上影线长度为实体长度两倍或两倍以上而下影线很短的阳线或阴线,称为射击之星,这是可靠性很高的见顶回落信号。 在上升行情中出现上影线长度为实体长度两倍或两倍以上而下影线很短的阳线或阴线,称为射击之星,这是可靠性很高的见顶回落信号。 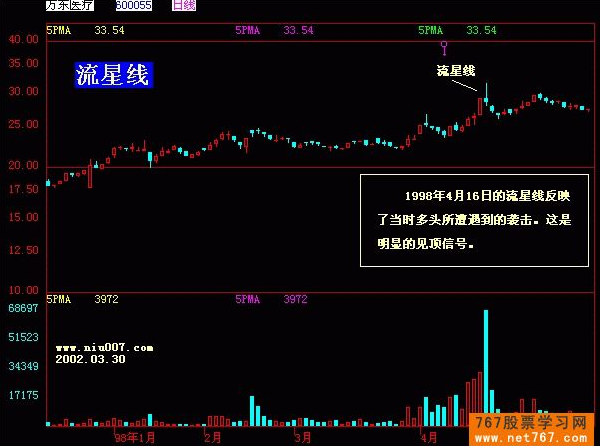 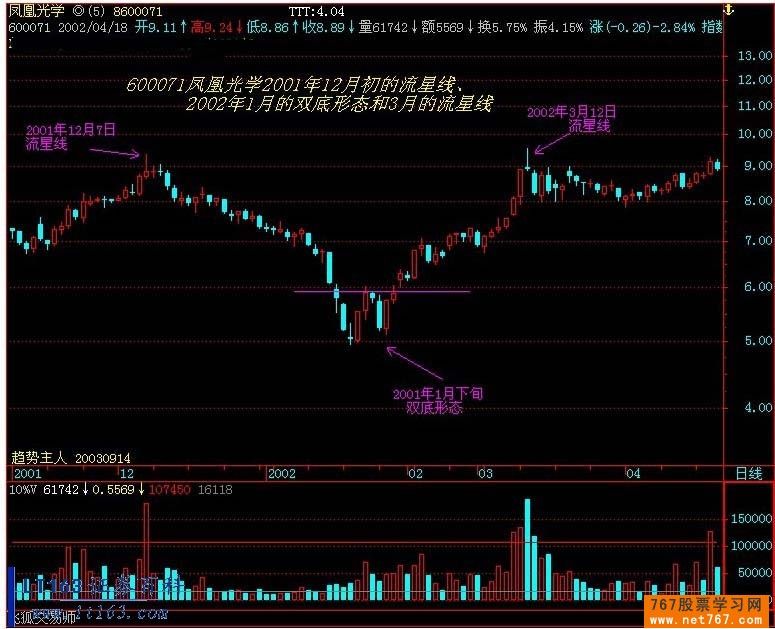 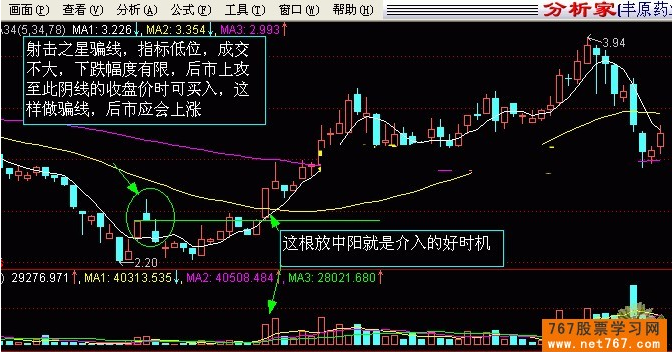
|
|
|
|
Post by zuolun on Jul 1, 2014 10:26:08 GMT 7
Linear Regression ChannelSimilar to the 200-day Moving Average, large institutions often look at long term Linear Regression Channels. A Linear Regression Channel consists of three parts:- Linear Regression Line (直线回归线): A line that best fits all the data points of interest.
- Upper Channel Line: A line that runs parallel to the Linear Regression Line and is usually 1 to 2 standard deviations above the Linear Regression Line.
- Lower Channel Line: This line runs parallel to the Linear Regression Line and is usually 1 to 2 standard deviations below the Linear Regression Line.
The multi-year chart of the S&P 500 exchange traded fund (SPY) shows prices in a steady uptrend and maintaining in a tight 1 standard deviation Linear Regression Channel:  The upper and lower channel lines contain between themselves either 68% of all prices (if 1 standard deviation is used) or 95% of all prices (if 2 standard deviations are used). When prices break outside of the channels, either: 1. Buy or sell opportunities are present. 2. Or the prior trend could be ending. Linear Regression Channel Buy SignalWhen price falls below the lower channel line, a buy signal is usually triggered. Linear Regression Channel Sell SignalAn opportunity for selling occurs when prices break above the upper channel line. Other confirmation signs like prices closing back inside the linear regression channel could be used to initiate buy or sell orders. Also, other technical indicators should be used to confirm. Trend ReversalsWhen price closes outside of the Linear Regression Channel for long periods of time, this is often interpreted as an early signal that the past price trend may be breaking and a significant reversal might be near. Linear Regression Channels are quite useful technical analysis charting tools. In addition to identifying trends and trend direction, the use of standard deviation gives traders ideas as to when prices are becoming overbought or oversold relative to the long term trend. Linear Regression Channel Example: UMS 
|
|
|
|
Post by zuolun on Jul 1, 2014 15:39:35 GMT 7
|
|
|
|
Post by zuolun on Jul 5, 2014 17:06:58 GMT 7
|
|
|
|
Post by zuolun on Jul 8, 2014 8:59:47 GMT 7
Chart pattern recognition: Some stocks that exhibit certain chart patterns (Cup and Handle, Double Bottom and Flat Base) can lead to strong price appreciation when they breakout on strong volume. History repeats itself In technical analysis, history repeats itself. The theory behind chart patters is based on this assumption. The idea is that certain patterns are seen many times, and that these patterns signal a certain high probability move in a stock. Based on the historic trend of a chart pattern setting up a certain price movement, chartists look for these patterns to identify trading opportunities. Cup with Handle (Continuation)- Trend: To qualify as a continuation pattern, a prior trend should exist. Ideally, the trend should be a few months old and not too mature. The more mature the trend, the less chance that the pattern marks a continuation or the less upside potential.
- Cup: The cup should be "U" shaped and resemble a bowl or rounding bottom. A "V" shaped bottom would be considered too sharp of a reversal to qualify. The softer "U" shape ensures that the cup is a consolidation pattern with valid support at the bottom of the "U". The perfect pattern would have equal highs on both sides of the cup, but this is not always the case.
- Cup Depth: Ideally, the depth of the cup should retrace 1/3 or less of the previous advance. However, with volatile markets and over-reactions, the retracement could range from 1/3 to 1/2. In extreme situations, the maximum retracement could be 2/3, which conforms with Dow Theory.
- Handle: After the high forms on the right side of the cup, there is a pullback that forms the handle. Sometimes this handle resembles a flag or pennant that slopes downward, other times it is just a short pullback. The handle represents the final consolidation/pullback before the big breakout and can retrace up to 1/3 of the cup's advance, but usually not more. The smaller the retracement, the more bullish the formation and significant the breakout. Sometimes it is prudent to wait for a break above the resistance line established by the highs of the cup.
- Duration: The cup can extend from 1 to 6 months, sometimes longer on weekly charts. The handle can be from 1 week to many weeks and ideally completes within 1-4 weeks.
- Volume: There should be a substantial increase in volume on the breakout above the handle's resistance.
- Target: The projected advance after breakout can be estimated by measuring the distance from the right peak of the cup to the bottom of the cup.
Wee Hur — Rounding Bottom Breakout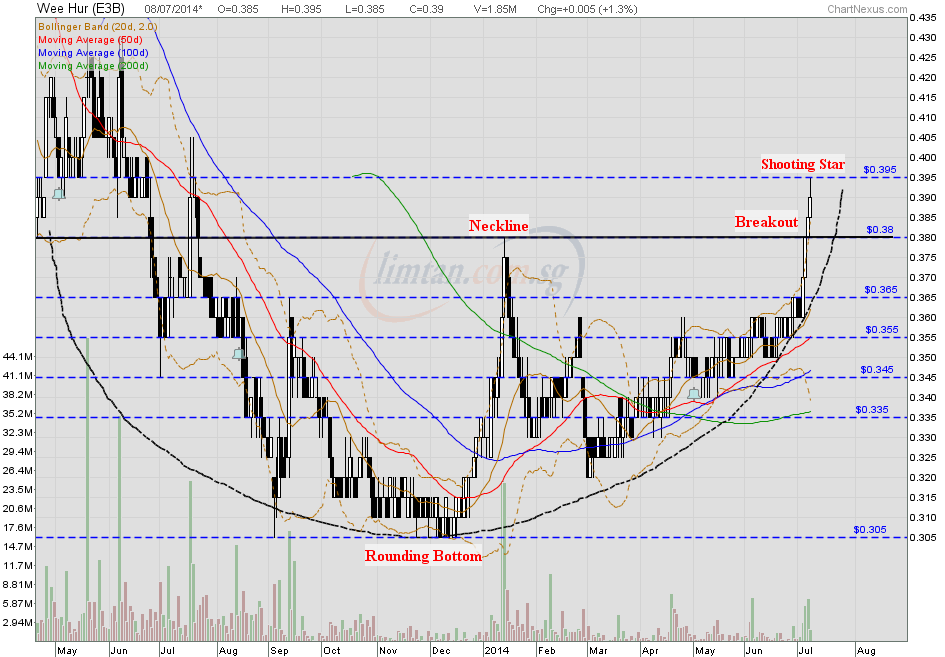
|
|
|
|
Post by zuolun on Jul 9, 2014 6:51:11 GMT 7
|
|
|
|
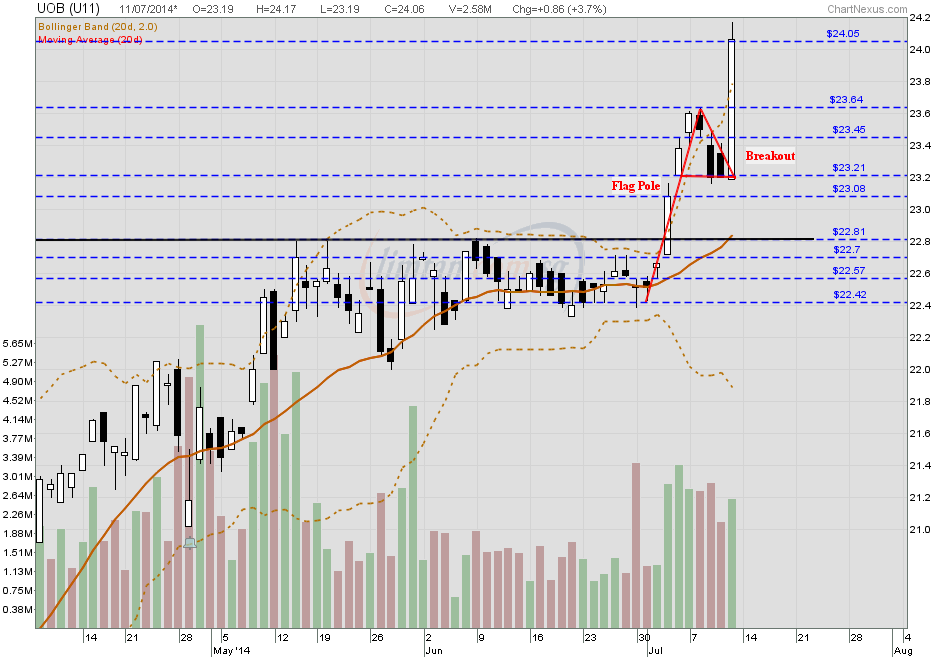
Post by zuolun on Jul 10, 2014 15:26:31 GMT 7
Bearish HaramiThe bearish harami is made up of two candlesticks. The first has a large body and the second a small body that is totally encompassed by the first. There are 4 combinations:- white/black
- black/white
- white/white
- black/black
Whether a bullish reversal or bearish reversal pattern, all harami look the same. Their bullish or bearish nature depends on the preceding trend. Harami are considered potential bearish reversals after an advance and potential bullish reversals after a decline. No matter what the color of the first candlestick, the smaller the body of the second candlestick is, the more likely the reversal. If the small candlestick is a doji, the chances of a reversal increase. In his book, Beyond Candlesticks, Steve Nison asserts that any combination of colors can form a harami, but the most bearish are those that form with a black/white or black/black combination. Because the first candlestick has a large body, it implies that the bearish reversal pattern would be stronger if this body were black. This would indicate a sudden and sustained increase in selling pressure. The small candlestick afterwards indicates consolidation before continuation. After an advance, black/white or black/black bearish harami are not as common as white/black or white/white variations. A white/black or white/white combination can still be regarded as a bearish harami and signal a potential reversal. The first long white candlestick forms in the direction of the trend. It signals that significant buying pressure remains, but could also indicate excessive bullishness. Immediately following, the small candlestick forms with a gap down on the open, indicating a sudden shift towards the sellers and a potential reversal. 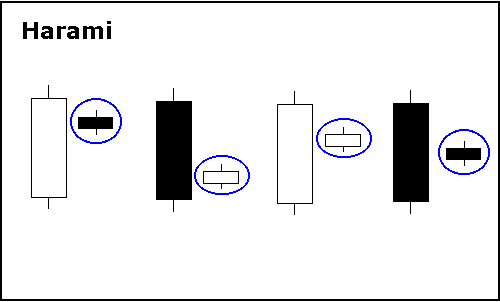 UOB — An example of a Black-Black Harami UOB — An example of a Black-Black Harami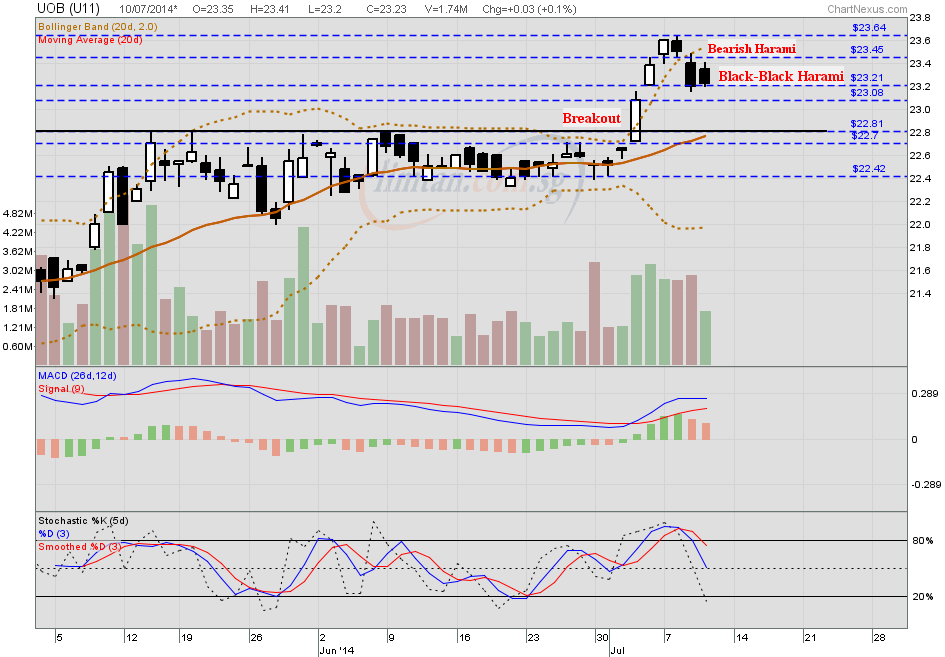
|
|
|
|
Post by zuolun on Jul 11, 2014 12:22:18 GMT 7
|
|
|
|
Post by zuolun on Jul 13, 2014 8:09:34 GMT 7
The Power of the 20d SMAHow to locate and trade an extended moveSometimes stocks will break out or break down in a very sharp and steep angle on the charts. These type of patterns are often referred to as a parabolic move when they surge to the upside. When these patterns occur to the downside they will often be referred to as a falling knife or waterfall decline. The actual name is irrelevant, however, understanding the chart pattern is very important. As a general rule, if you ever put a protractor up to your screen from any pivot low or pivot top and the angle is more than 60 degrees it is usually unsustainable. It does not matter if the stock or commodity is rallying or declining. The technique I will show you here will help to identify when the equity is running out of steam in either direction, and will need to retrace and consolidate some of its move. - Step 1. Scan through stock charts and find a time when a stock was extremely extended from its 20 (SMA) simple moving average.
- Step 2. Determine the distance of where the stock was trading from the 20 moving average. Simply calculate the distance of the stock from the 20 MA and draw a vertical line to reflect it.
- Step 3. Take this distance and place the line on your chart. Follow the 20 SMA with the line; if at any point the stock price exceeds the length of the line from the 20 SMA, this will be your opportunity for a trade. Wait patiently, anytime price gets above or below the distance of the line, go long or short the stock. In this example, we are looking to enter a short position when price exceeds the distance of the line to the upside.
Example: Take a look at the TLT chart below. On February 9, 2011 the TLT traded down to the $88.14 level. If you draw a straight line up to the 20 moving average from that $88.14 level you will see that the distance from that low pivot to the 20 moving average was $2.74. That is the distance that will be used for evaluating a future trade entry. On March 23, 2011 the TLT spiked sharply higher and became extended from the 20 moving average. If you simply copy the $2.74 measurement from the February 9, 2011 extended move and place that line on the 20 moving average of March 23, 2011 you see that it is extended and into resistance. This tells us that the TLT will likely pullback before moving higher. Therefore, if you own the TLT you can take profits on the trade or simply trail the stop loss. Traders that are aggressive and want to short the TLT can do so at the daily chart resistance from the last pivot high which was on December 21, 2010 at $94.70 a share. This technique can be applied to all time frames and used on all types of equities such as stocks, commodities, forex, and futures. Test it out a few times before adding it to your trading arsenal. By locating equities that are extended you will add more probability in favor of your trade succeeding. I am confident that once you start using this technique it will become one of your favorite methods for finding overbought and oversold equities. 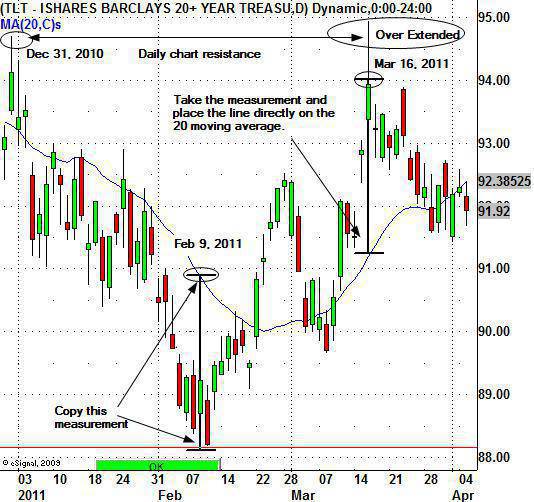
Example:UOB (5 Jun to 14 Aug 2012) — Extremely extended from its 20d SMA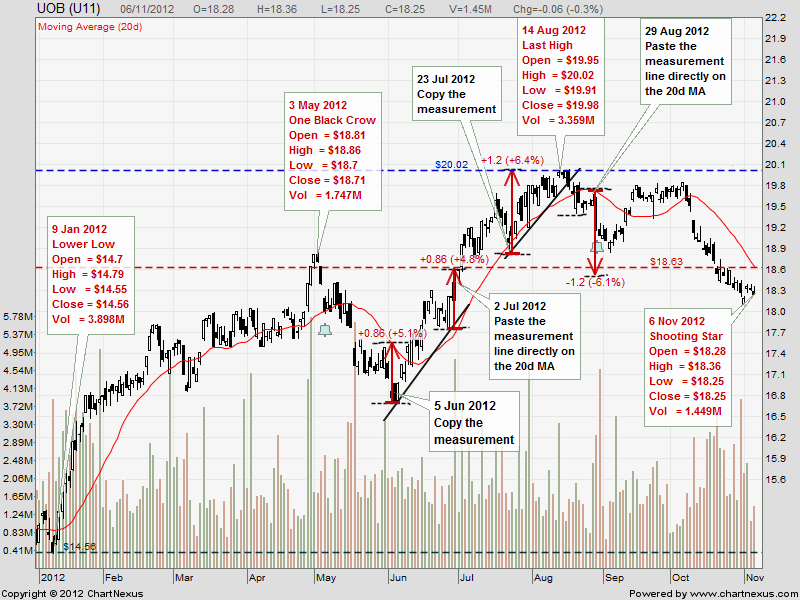 UOB (17 Mar to 11 July 2014, to date) — Extremely extended from its 20d SMA UOB (17 Mar to 11 July 2014, to date) — Extremely extended from its 20d SMA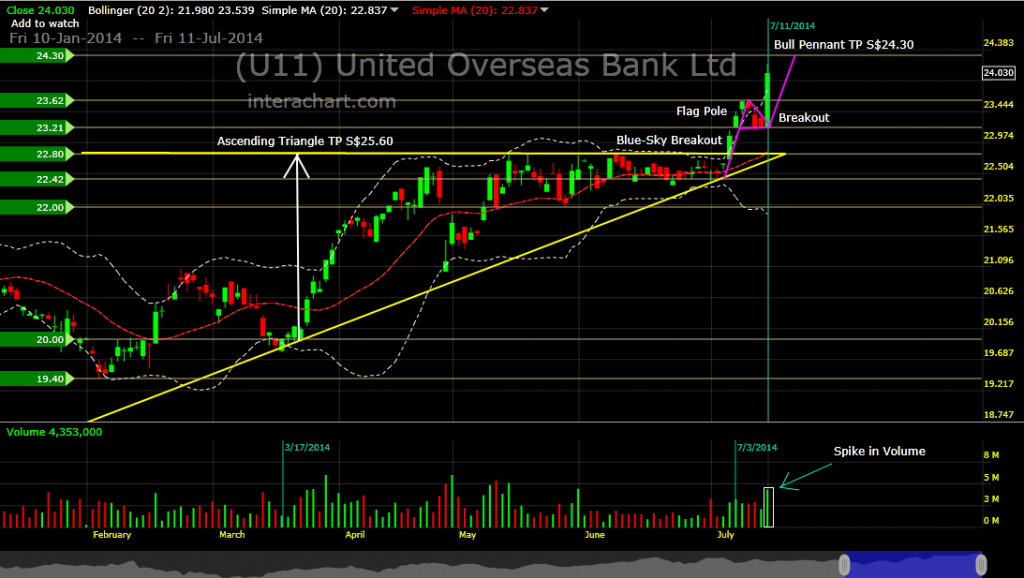
|
|
|
|
Post by zuolun on Jul 13, 2014 8:20:27 GMT 7
The Elliott Wave PatternOne of the Elliott Wave rules stated that Wave-3 cannot be the shortest wave. - Rule 1: Wave 2 cannot retrace more than 100% of Wave 1.
- Rule 2: Wave 3 can never be the shortest of the three impulse waves.
- Rule 3: Wave 4 can never overlap Wave 1.
Usually for commodities, Wave-5 will be the longest wave; while for stocks, Wave-3 will be the longest wave and a minimum target for Wave-5 is 100% of Wave-1. 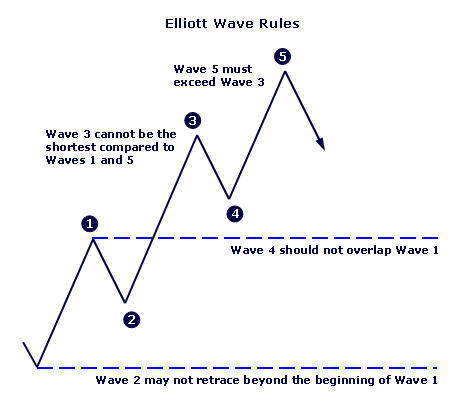 There are also rules for the corrective Wave A-B-C which follows the 5th wave. - Rule 1: The pattern is made of 3 waves.
- Rule 2: Waves A and C are impulses. Wave B is corrective.
- Rule 3: Wave B's retracement is no more than 61.8 percent of Wave A.
- Rule 4: Wave C must extend beyond Wave A.
- Rule 5: Wave C usually is equal to Wave A.
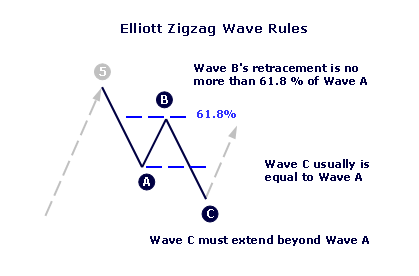 Example of Corrective Wave A-B-C: SMM Example of Corrective Wave A-B-C: SMM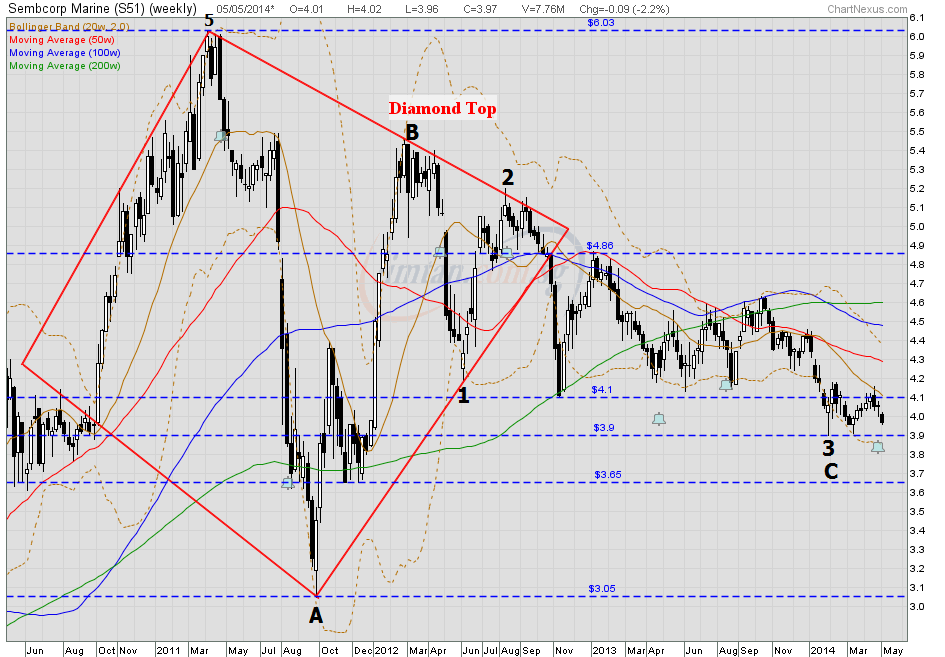
|
|
|
|
Post by zuolun on Jul 17, 2014 17:05:34 GMT 7
Chart pattern recognition: Cup and HandleTrading the Cup and Handle PatternWilliam O’Neal gave us the cup and handle patterns in his 1988 book titled “How to Make Money in Stocks”. Even though this chart pattern was initially developed for the stock market, the forex market can also be traded with chart patterns and so the cup and handle pattern has been successfully applied to the technical analysis of the forex market. The cup and handle pattern is a bullish continuation pattern, made up of two parts: the cup and the handle. The cup and handle pattern indicates a period of price advance following an initial bullish period and a period of consolidation. The initial bullishness is formed after a rounding bottom occurs. This rounding bottom is what forms the cup. Then follows a period of price consolidation (the handle), and at the completion of this handle, the price breaks out and resumes the bullish trend. Tracing the Cup and Handle PatternThe cup and handle pattern is a complex pattern and it is imperative that the trader is able to trace it correctly in order not to make mistakes. What forms the “cup” part of this pattern is actually a rounding bottom pattern, which has been discussed here. The trader should first start from the correct trace of the cup. A cup whose curve is too steep as to form a “V” rather than a lightly curved “U” will not produce a good cup. A good cup should be deep enough but not too flat as to resemble a saucer. The depth of the cup should be equivalent to a 1/3 to 1/2 retracement from the high of the initial trend. The brim of the cup should be formed by a resistance line that cuts across two points on the price action, directly above the cup. Following this is the handle, which is actually a period of consolidation. A handle may resemble a pennant or a flag. Here the price will oscillate between the upper and lower trendline that forms the handle. Once the cup and handle have been identified as the price action of the currency pair evolves, the trader should prepare for a bullish breakout by observing a period when the candlesticks close above the upper trend line of the handle. When this happens, the breakout will occur to the upside. The cup and handle pattern is a bullish pattern, so the only trade possible here is a long trade. Long TradeThe only point at which a BUY should be initiated should be at the break of the upper trend line of the handle aspect of this pattern. Take a look at the chart below for the fine details of the cup and handle pattern:  The exit strategy for this pattern should be to use the pip distance between the brim and the lowest part of the cup, and extrapolate this to the distance between the candle break and the upside. After the first target is reached, the trader can close half the position and apply a trailing stop to chase the price action to its logical conclusion. Ascott Reit — Rounding Bottom Formation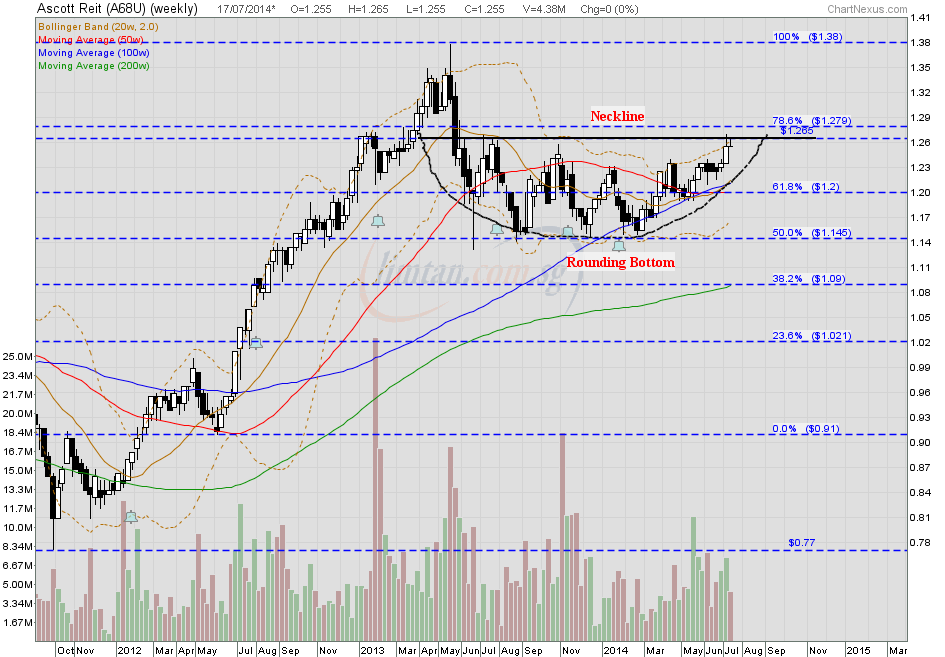
|
|
|
|
Post by zuolun on Jul 22, 2014 17:18:53 GMT 7
 How to Shortsell, Trade Example How to Shortsell, Trade Example |
|
|
|
Post by zuolun on Jul 27, 2014 19:48:07 GMT 7
|
|