|
|
Post by zuolun on Jul 30, 2014 12:41:32 GMT 7
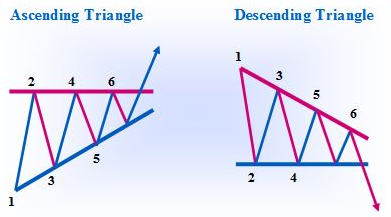
Triangle Chart PatternTriangles come in 3 varieties: Ascending, Symmetrical and Descending. All 3 share the common idea that the price range (High price – low price) of individual price bars is larger at the left side of the chart (called the base) and that the price range progressively becomes smaller as time advances. The right side of the pattern is called the apex and is where the price ranges are the smallest. Understanding Ascending triangle, Symmetrical Triangle and Descending Triangle- An Ascending Triangle is formed by equal highs and higher lows. It is a bullish signal, whether encountered in an uptrend or downtrend. It is most often observed as a continuation pattern in an uptrend but is a strong reversal signal when witnessed in a downtrend.
- A Descending Triangle is a variation of the Symmetrical Triangle. In a downtrend, Descending Triangle is technically bearish as it is a continuation pattern moving in the direction of the prior trend.
  An example of an Ascending Triangle in an uptrend.  An example of a Symmetrical Triangle in a Downtrend (Bearish)  An example of a Symmetrical Triangle in an Uptrend (Bullish). 
|
|
|
|
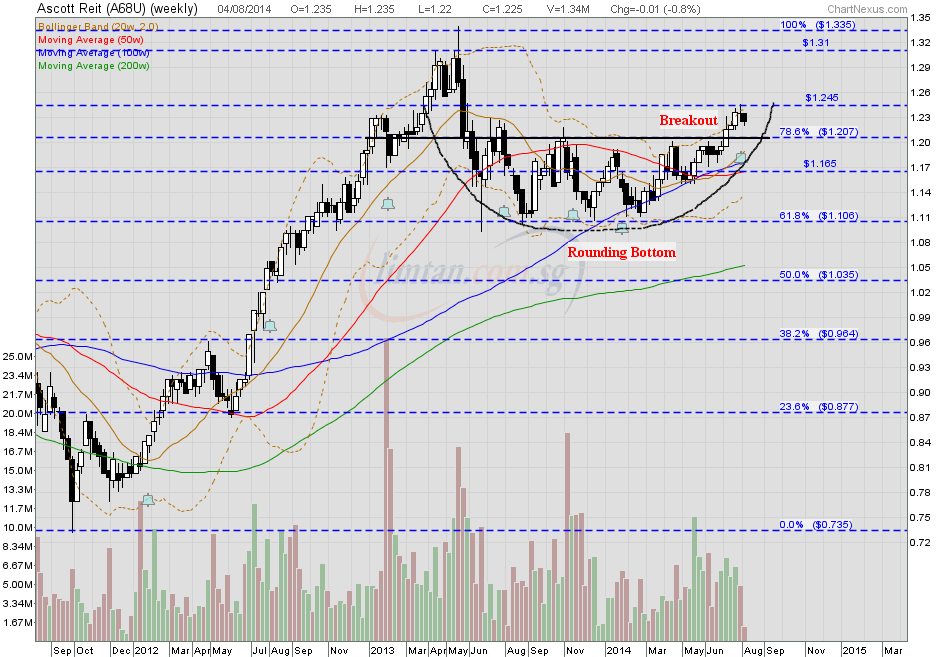
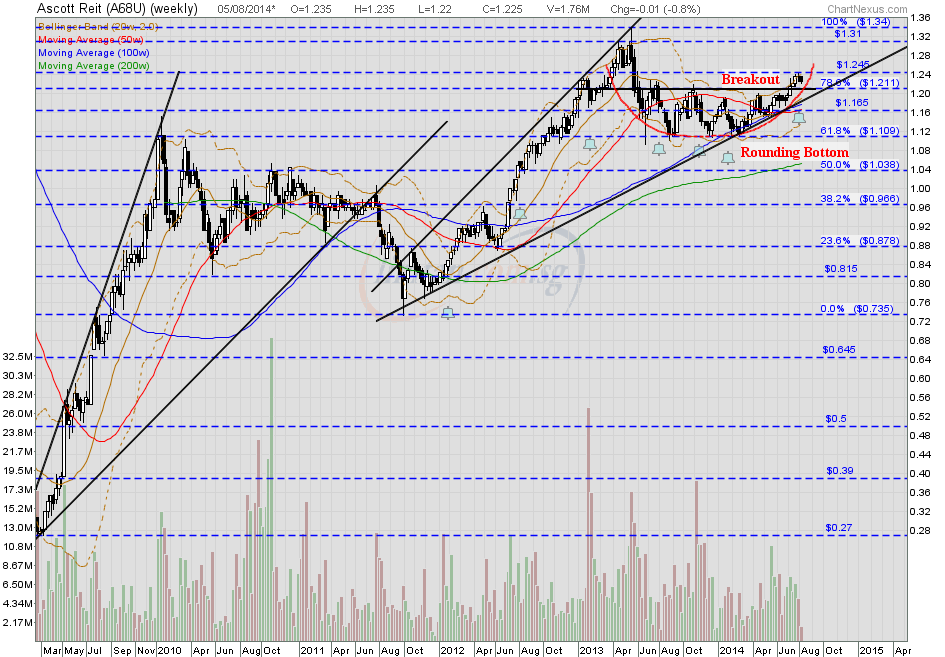
Post by zuolun on Aug 5, 2014 13:07:20 GMT 7
|
|
|
|
Post by zuolun on Aug 5, 2014 13:27:34 GMT 7
Valuetronics — Diamond Top chart pattern forming at the uptrend instead of the downtrend 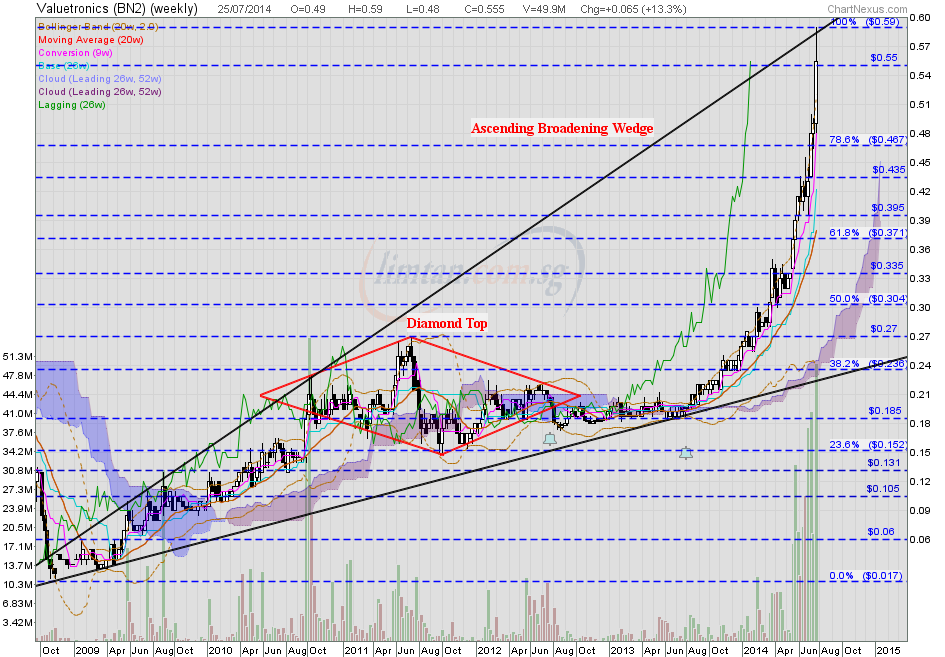 Diamond Tops / Diamond Bottoms Chart Pattern Diamond Tops / Diamond Bottoms Chart PatternHow to set target for diamond (top/bottom) breakout? Read [/a] here. 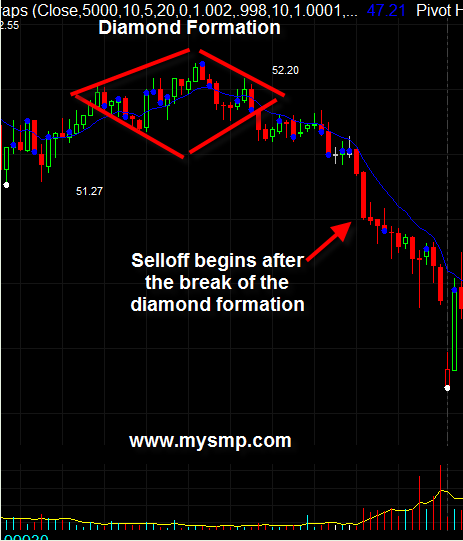 [/b]
|
|
|
|
Post by zuolun on Aug 7, 2014 17:45:34 GMT 7
The Dead Cat BounceA "Dead Cat Bounce" is a period that refers to when an equity rebounds in price after a very sharp drop. It has been used to refer to the stock market when a stock's price has dropped so fast that even "a dead cat could bounce back". The dead-cat bounce is usually referred to while the market is still dropping and continues to drop even after the supposed bottom of the price has been reached. The term was first cited as far back as 1985 when Malaysian and Singaporean markets seemed to drop off a cliff. 
|
|
|
|
Post by zuolun on Aug 8, 2014 5:45:11 GMT 7
|
|
|
|
Post by zuolun on Aug 8, 2014 8:44:21 GMT 7
Rising Wedge Chart PatternA rising wedge is a bearish pattern that signals that the security is likely to head in a downward direction. The trendlines of this pattern converge, with both trendlines slanted in an upward direction. The price movement is bounded by the two converging trendlines. As the price moves towards the apex of the pattern, momentum is weakening. A move below the lower support would be viewed by traders as a reversal in the upward trend. As the strength of the buyers weakens (exhibited by their inability to take the price higher), the sellers start to gain momentum. The pattern is complete, with the sellers taking control of the security, when the price falls below the supporting trendline. Alternatively, if the price moves above the upper (resistance) trendline, the uptrend prevails. How to trade this pattern?1. Go short when the price falls below the lower trendline and place the stop loss above the upper trendline (resistance) line. (continuation pattern). 2. Go long when the price rises above the upper trendline and place the stop loss below the lower trendline (reversal pattern).  Example: CARING (5245) — Bearish Rising Wedge Breakout Example: CARING (5245) — Bearish Rising Wedge Breakout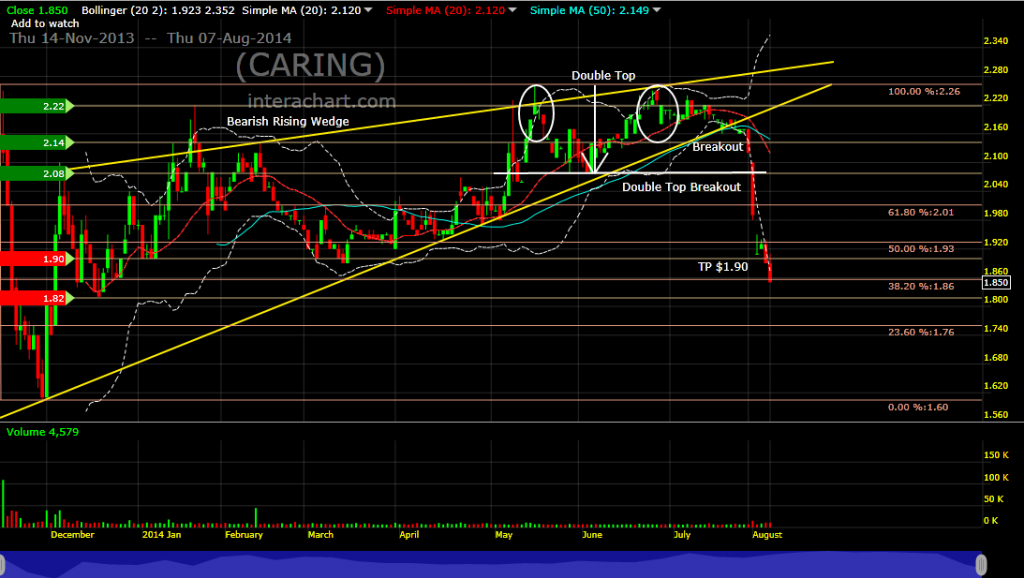
|
|
|
|
Post by zuolun on Aug 9, 2014 4:20:28 GMT 7
AMEDIA — A massive climatic type sell off chart pattern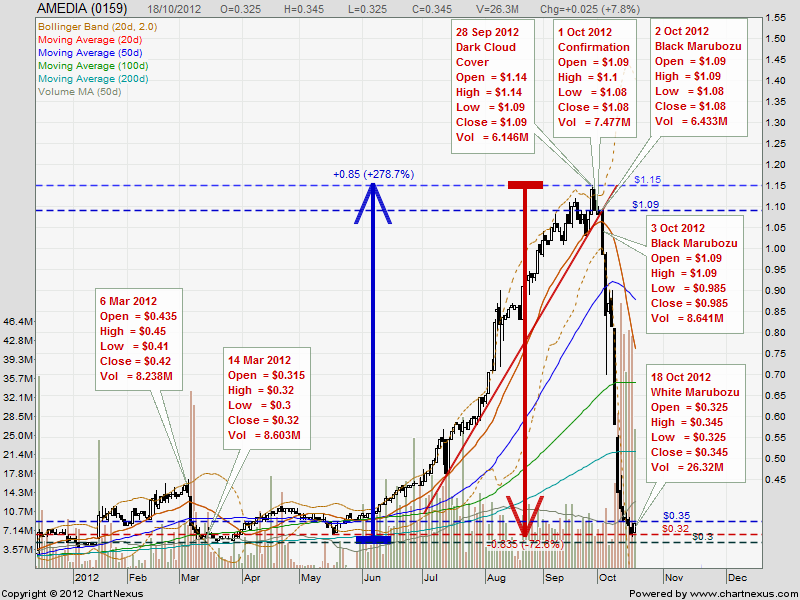
|
|
|
|
Post by zuolun on Aug 14, 2014 13:50:00 GMT 7
One Good TradeTrading is not about making money, said Mr Mr Bellaore. Traders and investors who go in with money on their minds will under-perform. Instead, they should concentrate instead on achieving One Good Trade and doing it repeatedly, improving themselves in the process. Seven fundamental rules to attain that One Good Trade are:- Being a good trader: striving to understand the stock you are trading and the market conditions under which you are trading it.
- Hard work: learning constantly, improving yourself and studying your technique, your stock and the market.
- Patience: once you have calculated the price at which you want to buy a stock, you should wait for it to reach that price and not buy it too soon.
- A detailed trading plan: you should have all the details of your trades, from entry to exit, worked out in advance. “Have everything decided before you make the trade, not in the middle of it,” Mr Bellaore advised.
- Discipline: sticking to your trading plan.
- Communication: it is always best to trade with a team of like-minded people, because more heads can come up with more ideas. Being able to discuss a trade with others also helps you stick to your trading plan.
- Review and improvement: every day, you should review the most important trades you make and examine how they were done, so that you will be able to repeat them again when the opportunity next comes up.
Ultimately, said Mr Bellaore, trading is about one thing: controlling your risk. He mentioned, “New traders try and make money. Experienced traders try and make good risk-reward decisions.”
|
|
|
|
Post by zuolun on Aug 15, 2014 6:45:40 GMT 7
|
|
|
|
Post by zuolun on Aug 29, 2014 7:24:04 GMT 7
|
|
|
|
Post by zuolun on Sept 2, 2014 15:24:05 GMT 7
|
|
|
|
Post by zuolun on Sept 10, 2014 17:26:36 GMT 7
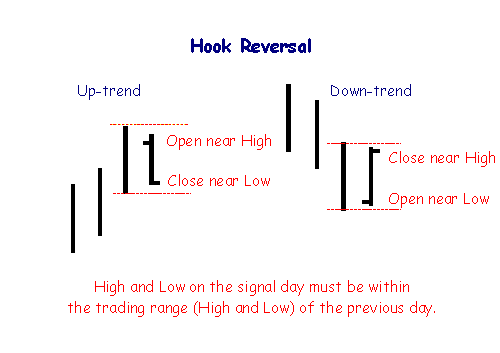
Hook ReversalThe hook reversal has the same bar as the Open-Close and Closing Price reversals, but it is positioned differently in relation to the range of the previous day. The signals are most reliable if they occur after a strong trend. If the trend is weak, so is the signal. After an uptrend:- The Open must be near the High,
- The Close must be near the Low, and
- There is a lower High and higher Low compared to the previous day.
After a downtrend:- The Open must be near the Low,
- The Close must be near the High, and
- There is a lower High and higher Low compared to the previous day.
 Hook Reversal Bar Chart PatternJ-Hook Bullish Chart Pattern Hook Reversal Bar Chart PatternJ-Hook Bullish Chart Pattern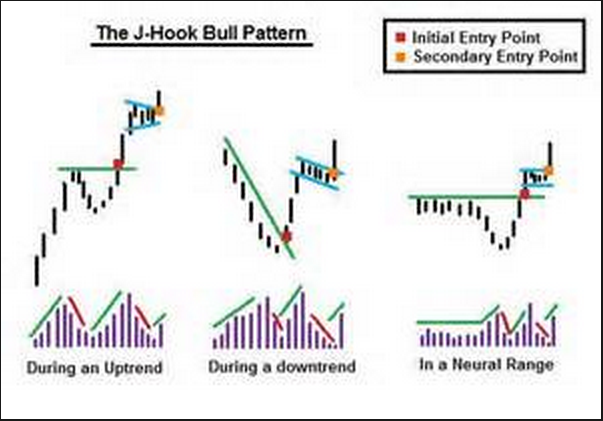
|
|
|
|
Post by zuolun on Sept 14, 2014 12:07:14 GMT 7
|
|
|
|
Post by zuolun on Sept 14, 2014 14:15:48 GMT 7
|
|
|
|
Post by zuolun on Sept 14, 2014 14:24:31 GMT 7
|
|