Post by zuolun on Apr 9, 2015 7:25:30 GMT 7
Moving averages: A powerful yet simple indicator
Oliver Velez: The Power of the 20-day MA
The power of the 200d SMA
Why the 200d SMA is important:
The Simple Moving Average (SMA) is the average price of an asset over a certain period of time. It is calculated by adding up the closing prices over a certain number of time periods, and then dividing by that number of time periods. SMA’s are used to measure momentum. The most watched SMA is the 200 day, it is widely recognized as the dividing line between bull and bear territory. The primary trend is considered to be up as long as the market is trading above its 200-day moving average but this trend turns bearish whenever the market closes below this average.
Oliver Velez: The Mighty 200 MA
How to locate and trade an extended move
Sometimes stocks will break out or break down in a very sharp and steep angle on the charts. These type of patterns are often referred to as a parabolic move when they surge to the upside. When these patterns occur to the downside they will often be referred to as a falling knife or waterfall decline. The actual name is irrelevant, however, understanding the chart pattern is very important. As a general rule, if you ever put a protractor up to your screen from any pivot low or pivot top and the angle is more than 60 degrees it is usually unsustainable. It does not matter if the stock or commodity is rallying or declining. The technique I will show you here will help to identify when the equity is running out of steam in either direction, and will need to retrace and consolidate some of its move.
Example:
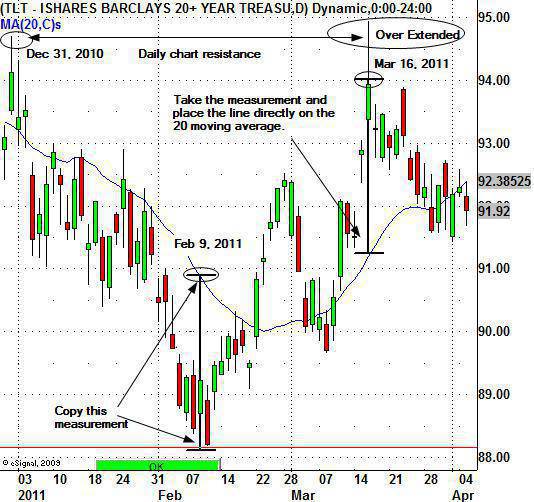
Take a look at the TLT chart below. On February 9, 2011 the TLT traded down to the $88.14 level. If you draw a straight line up to the 20 moving average from that $88.14 level you will see that the distance from that low pivot to the 20 moving average was $2.74. That is the distance that will be used for evaluating a future trade entry.
On March 23, 2011 the TLT spiked sharply higher and became extended from the 20 moving average. If you simply copy the $2.74 measurement from the February 9, 2011 extended move and place that line on the 20 moving average of March 23, 2011 you see that it is extended and into resistance. This tells us that the TLT will likely pullback before moving higher. Therefore, if you own the TLT you can take profits on the trade or simply trail the stop loss. Traders that are aggressive and want to short the TLT can do so at the daily chart resistance from the last pivot high which was on December 21, 2010 at $94.70 a share.
This technique can be applied to all time frames and used on all types of equities such as stocks, commodities, forex, and futures. Test it out a few times before adding it to your trading arsenal. By locating equities that are extended you will add more probability in favor of your trade succeeding. I am confident that once you start using this technique it will become one of your favorite methods for finding overbought and oversold equities.
Example:
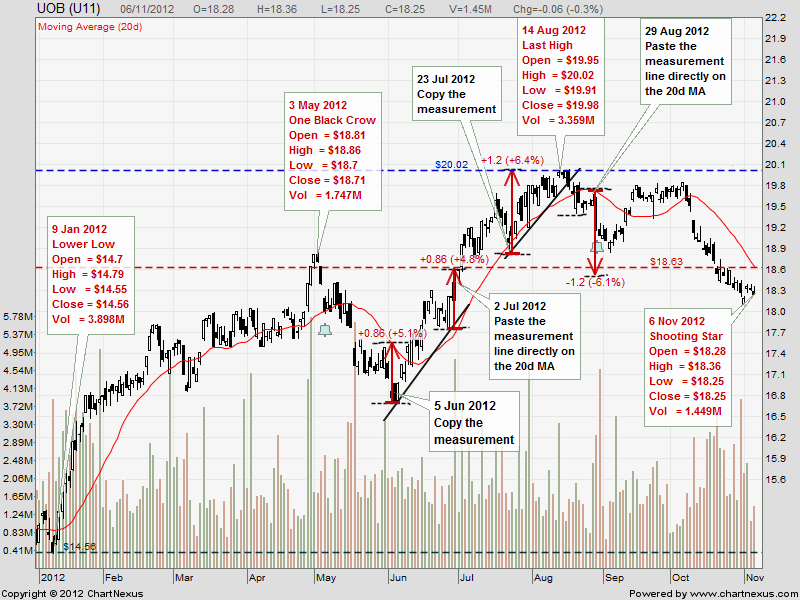
UOB (5 Jun to 14 Aug 2012) — Extremely extended from its 20d SMA
Oliver Velez: The Power of the 20-day MA
The power of the 200d SMA
Why the 200d SMA is important:
The Simple Moving Average (SMA) is the average price of an asset over a certain period of time. It is calculated by adding up the closing prices over a certain number of time periods, and then dividing by that number of time periods. SMA’s are used to measure momentum. The most watched SMA is the 200 day, it is widely recognized as the dividing line between bull and bear territory. The primary trend is considered to be up as long as the market is trading above its 200-day moving average but this trend turns bearish whenever the market closes below this average.
Oliver Velez: The Mighty 200 MA
How to locate and trade an extended move
Sometimes stocks will break out or break down in a very sharp and steep angle on the charts. These type of patterns are often referred to as a parabolic move when they surge to the upside. When these patterns occur to the downside they will often be referred to as a falling knife or waterfall decline. The actual name is irrelevant, however, understanding the chart pattern is very important. As a general rule, if you ever put a protractor up to your screen from any pivot low or pivot top and the angle is more than 60 degrees it is usually unsustainable. It does not matter if the stock or commodity is rallying or declining. The technique I will show you here will help to identify when the equity is running out of steam in either direction, and will need to retrace and consolidate some of its move.
- Step 1. Scan through stock charts and find a time when a stock was extremely extended from its 20 (SMA) simple moving average.
- Step 2. Determine the distance of where the stock was trading from the 20 moving average. Simply calculate the distance of the stock from the 20 MA and draw a vertical line to reflect it.
- Step 3. Take this distance and place the line on your chart. Follow the 20 SMA with the line; if at any point the stock price exceeds the length of the line from the 20 SMA, this will be your opportunity for a trade. Wait patiently, anytime price gets above or below the distance of the line, go long or short the stock. In this example, we are looking to enter a short position when price exceeds the distance of the line to the upside.
Example:
Take a look at the TLT chart below. On February 9, 2011 the TLT traded down to the $88.14 level. If you draw a straight line up to the 20 moving average from that $88.14 level you will see that the distance from that low pivot to the 20 moving average was $2.74. That is the distance that will be used for evaluating a future trade entry.
On March 23, 2011 the TLT spiked sharply higher and became extended from the 20 moving average. If you simply copy the $2.74 measurement from the February 9, 2011 extended move and place that line on the 20 moving average of March 23, 2011 you see that it is extended and into resistance. This tells us that the TLT will likely pullback before moving higher. Therefore, if you own the TLT you can take profits on the trade or simply trail the stop loss. Traders that are aggressive and want to short the TLT can do so at the daily chart resistance from the last pivot high which was on December 21, 2010 at $94.70 a share.
This technique can be applied to all time frames and used on all types of equities such as stocks, commodities, forex, and futures. Test it out a few times before adding it to your trading arsenal. By locating equities that are extended you will add more probability in favor of your trade succeeding. I am confident that once you start using this technique it will become one of your favorite methods for finding overbought and oversold equities.
Example:
UOB (5 Jun to 14 Aug 2012) — Extremely extended from its 20d SMA