|
|
Post by zuolun on Sept 16, 2014 16:55:32 GMT 7
酒田战法32 ~~ 高档五连阴 (Extremely aggressive selling pressure)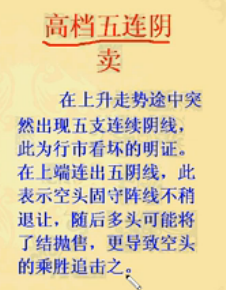
|
|
|
|
Post by zuolun on Sept 18, 2014 9:49:02 GMT 7
|
|
|
|
Post by zuolun on Sept 19, 2014 10:30:23 GMT 7
Beating the street: 25 golden rules of investing — Peter Lynch “Speculation is a hard and trying business, and a speculator must be on the job all the time or he’ll soon have no job to be on”. — Jesse Livermore I knew someone who shorted Cosco at the peak @ $8 in 2007. He held his long short-position for one year and covered @ $1+ in 2008. I only believed him when he showed me the before-and-after screenshots on Cosco. He purchased 3 pte properties for rental income in 2009 (fully paid with cash, no bank loans) from the nett profit he made from Cosco in 2008. There is a story behind every chart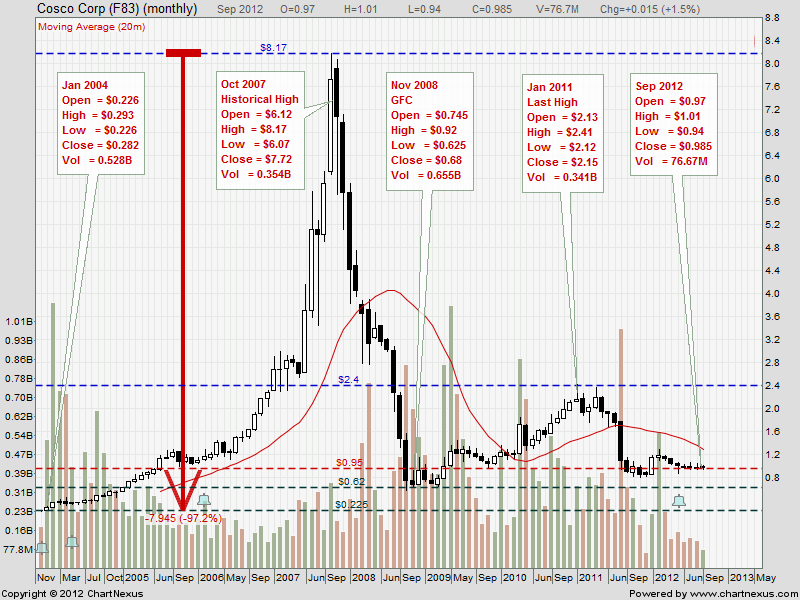
|
|
|
|
Post by zuolun on Oct 5, 2014 15:30:17 GMT 7
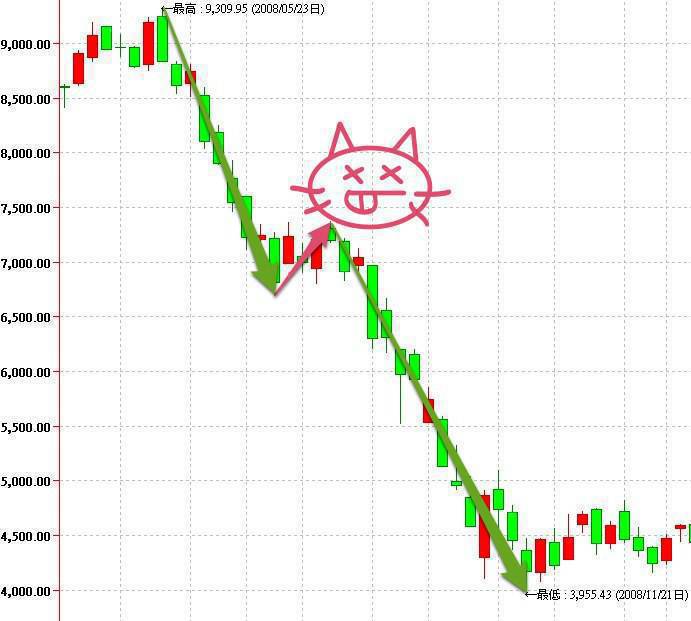
Rounding Top/Rounding Bottom Chart Pattern碗形结构,圆形顶和圆形底的反转形态圆形顶,即碟形顶(saucer top),属于转向形态,显示大跌市即将来临,后市跌势将会很大。
顾名思义,圆形顶的形态特征是倒转半圆形或碟形,成交量在顶部形成后,开始逐步减少。凡确认圆 形顶见顶形态 ,投资者宜尽快沽货离场,以免所持股份变成“蟹货”。
圆形顶的形成,是股价经过一段升势后,升势开始放缓,每次新高位较上一个高位距离不远。由于升 势放缓,部分 先知先觉的投资者便撤退离场,令卖方力量增加。淡友先在圆形顶部与好友势力对抗,其后在好友数 目逐步减少下 ,淡友就得以渐渐控制局面。股价遂持续下滑,直至淡友全面控制局面后,市场需求转为供过于求, 跌势才会较急 。由于形成过程稍长,有时需数月始完成圆形顶。
个别情况下,即使圆形顶形成,股价也不会实时急跌,仅会反复徘徊,横行发展,这徘徊区称为“碟 柄”或“碗柄 ” 。但由于跌势已成,该“碟柄”或“碗柄”一般很快便被突破,股价会转而向下,朝预期中的下跌趋 势而行。
圆形底,又称碟形底(saucer bottom),属于见底形态,显示跌势已逆转,大升市即将来临,后市升势可以很大。其走势及趋向,与圆形 顶刚好相反。
顾名思义,圆形底的形态特征是倒转半圆形或碟形,成交量在底部形成后,开始逐步减少。凡确认圆 形底见底形态 ,投资者宜待圆形底升势转急初期,才追买股票。
圆形底的形成过程如下:当股价经过一段跌势后,跌势开始放缓,沽售(或沽空)股票的成交量开始 减少。每次新 低位较上一个低位距离不远。由于跌势放缓,部分先知先觉者开始趁低吸纳,收集手法普遍是有耐性 地限价收集, 淡友力量因屡攻不下而开始减少,令圆形底部的成交量亦减少。其后好友数目逐步增加,渐控制局面 ,股价才能逐 步上扬。及好友完全控制局面,市场需求转为求过于供,升势方转急。由于形成过程稍久,往往需时 数月始完成圆 形底形态。
个别情况下,即使圆形底形成,股价并不会实时急升,仅会反复横行徘徊,这徘徊区称为“碟柄”或 “碗柄”。但 当升势既成,这“碟柄”或“碗柄”很快会被突破,股价转而向上,朝预期的上升趋势而行。Technical Analysis: Chart PatternsA chart pattern is a distinct formation on a stock chart that creates a trading signal, or a sign of future price movements. Chartists use these patterns to identify current trends and trend reversals and to trigger buy and sell signals. In the first section of this tutorial, we talked about the three assumptions of technical analysis, the third of which was that in technical analysis, history repeats itself. The theory behind chart patters is based on this assumption. The idea is that certain patterns are seen many times, and that these patterns signal a certain high probability move in a stock. Based on the historic trend of a chart pattern setting up a certain price movement, chartists look for these patterns to identify trading opportunities. While there are general ideas and components to every chart pattern, there is no chart pattern that will tell you with 100% certainty where a security is headed. This creates some leeway and debate as to what a good pattern looks like, and is a major reason why charting is often seen as more of an art than a science. There are two types of patterns within this area of technical analysis, reversal and continuation. A reversal pattern signals that a prior trend will reverse upon completion of the pattern. A continuation pattern, on the other hand, signals that a trend will continue once the pattern is complete. These patterns can be found over charts of any timeframe. In this section, we will review some of the more popular chart patterns. Read more...Examples of Rounding Top Chart Pattern:1. Osim 2. VARD 3. Tat Hong 4. TROP 5. Yanlord  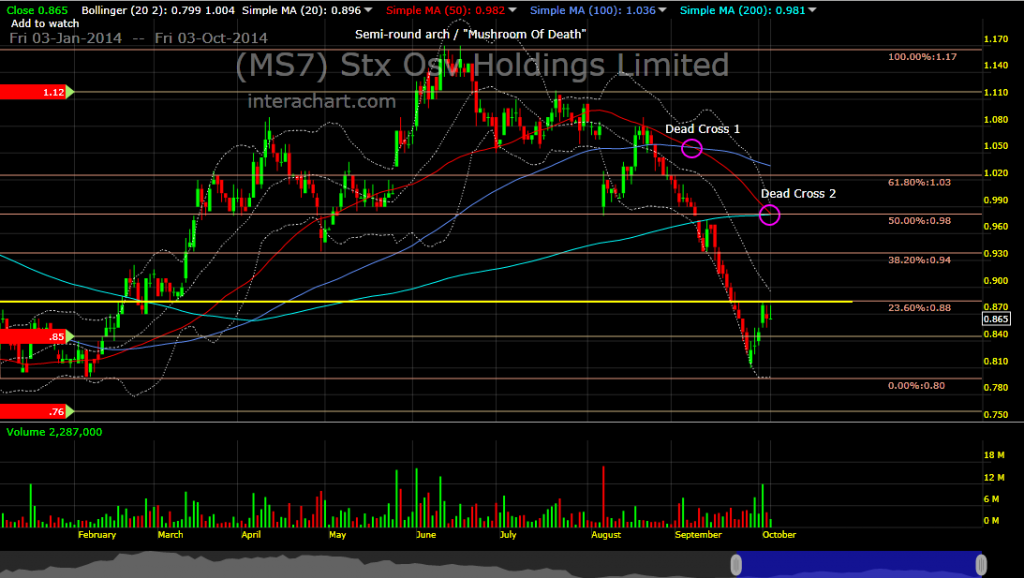 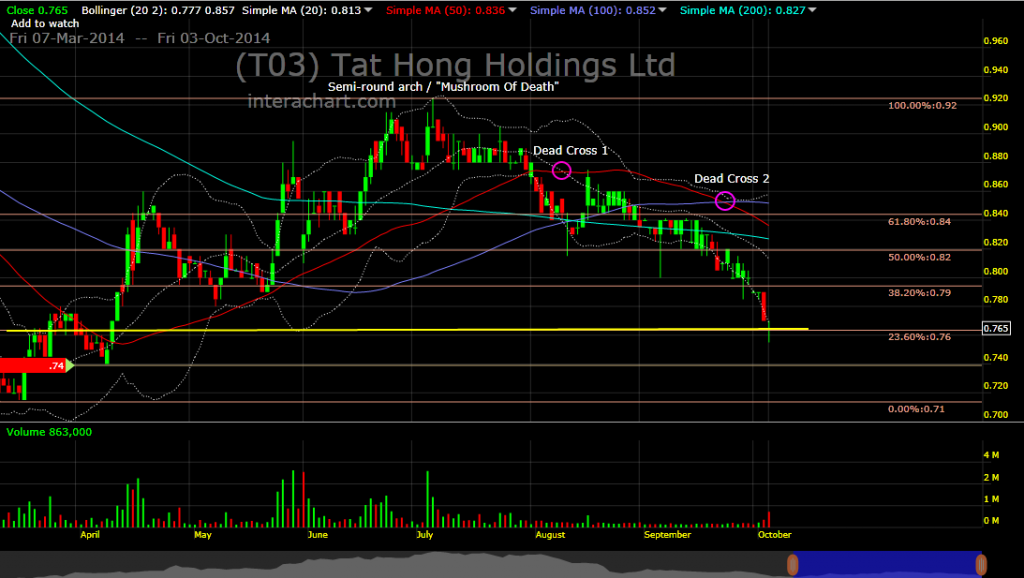 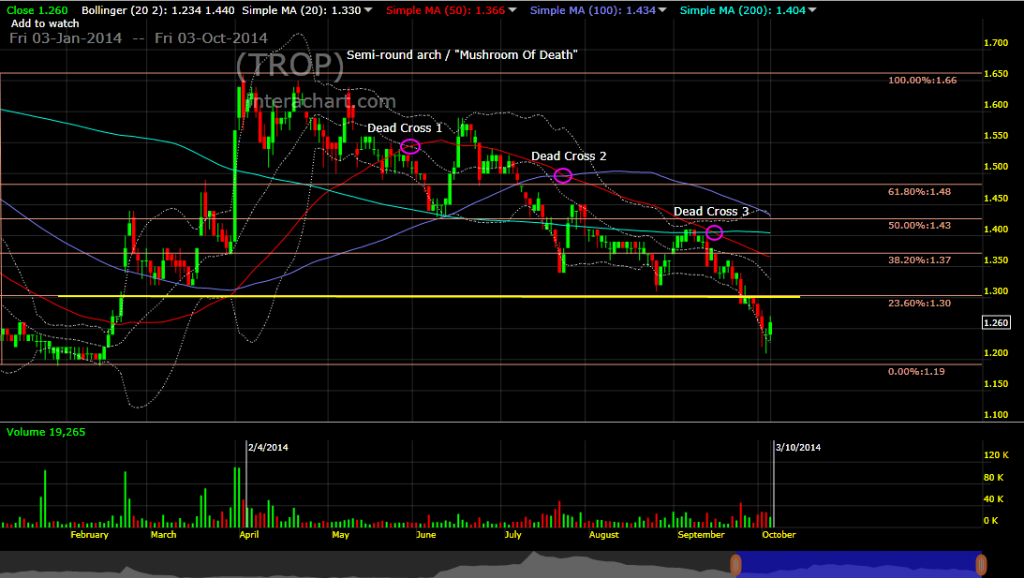 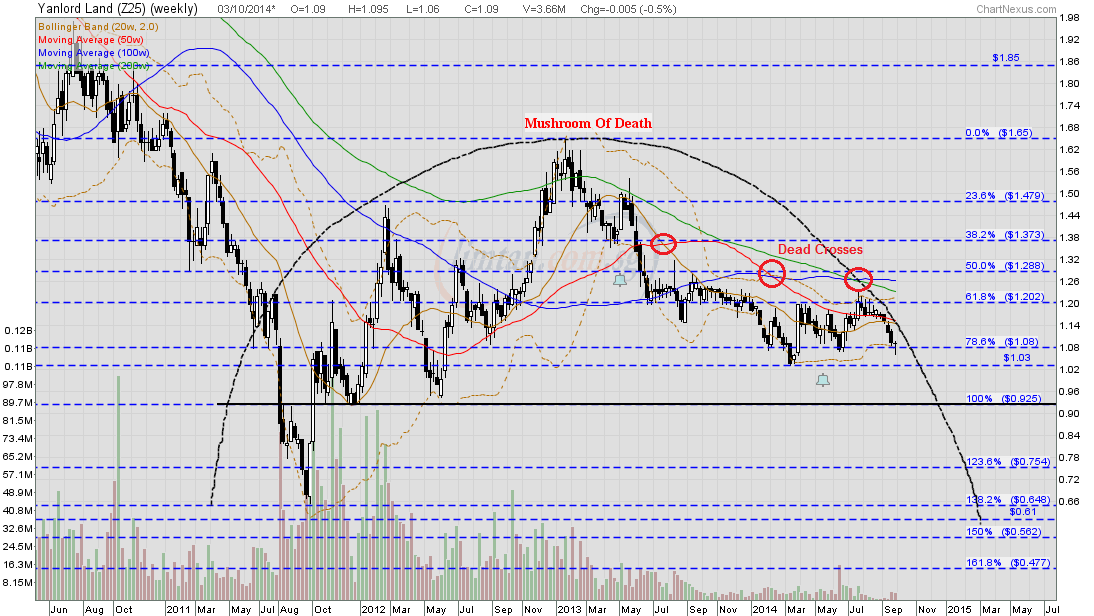
|
|
|
|
Post by zuolun on Oct 6, 2014 1:05:20 GMT 7
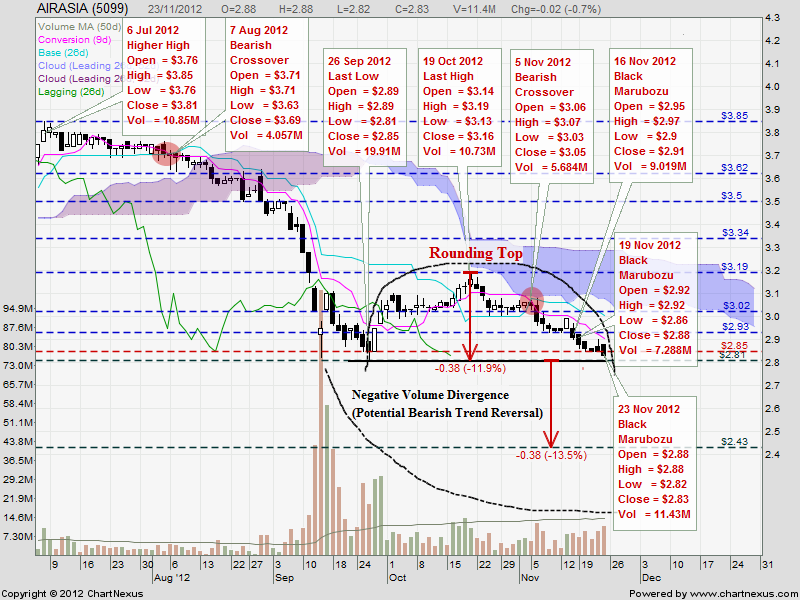
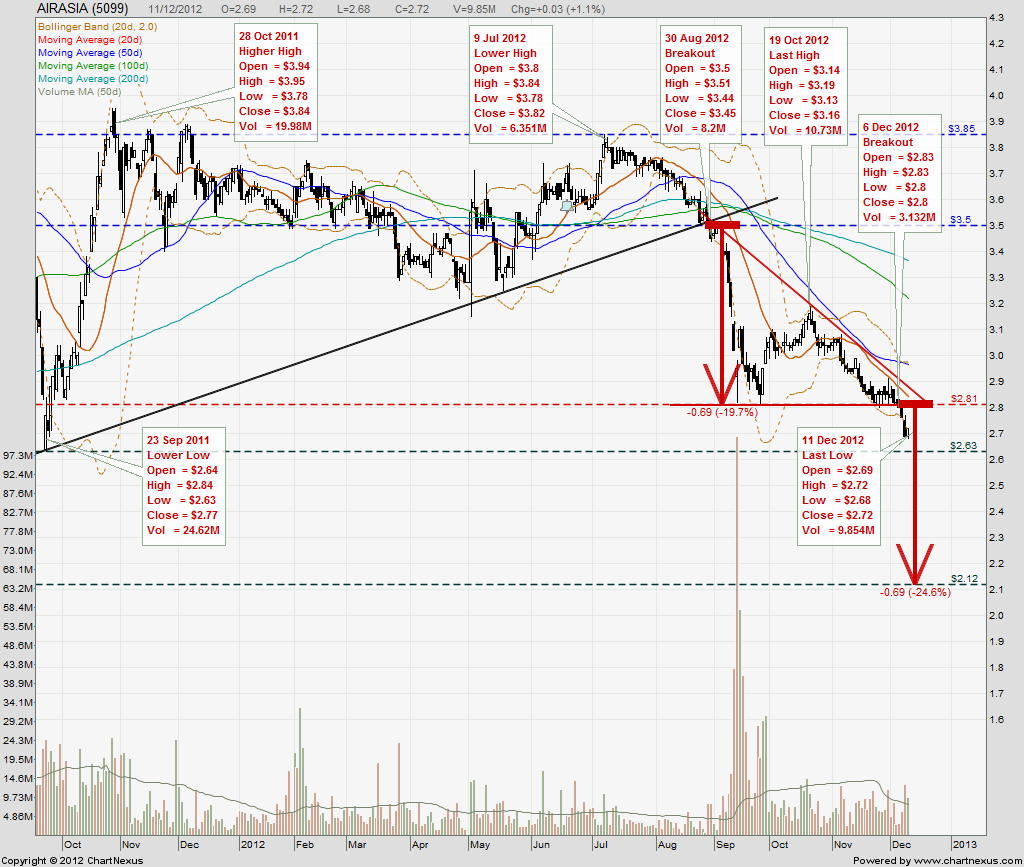
AirAsia — A good example of a bearish Rounding Top breakout- AirAsia was forming a semi-round arch / "mushroom of death" chart pattern from 26 Sep 2012 to 23 Nov 2012.
- Price action coupled with negative volume divergence (potential bearish trend reversal) suggested that target projection was @ 2.43 based on a bearish Rounding Top breakout @ 2.81 as at 23 Nov 2012.
- However, a downside move to low of 2.68 with decreasing volume suggested that the share price could hit much lower to 2.12 based on a bearish Descending Triangle breakout @ 2.81 as at 11 Dec 2012.
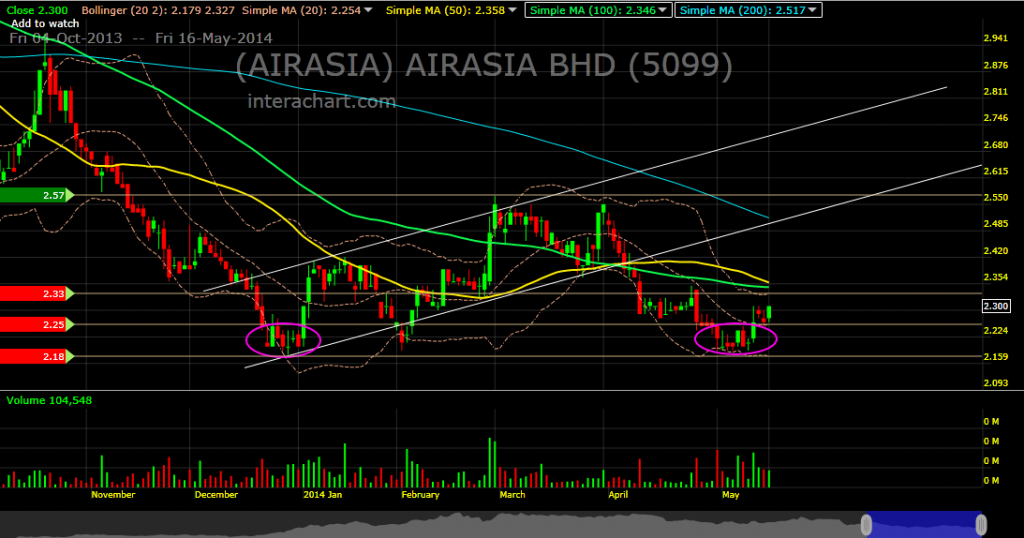
- AirAsia took approx. 4 qtrs or one year's timeframe to collapse from breakout point @ 2.81 to 2.18 (from early-Dec 2012 to end-Dec 2013) and the share price has been trading range bound bet. 2.40 to 2.50, to date.
|
|
|
|
Post by zuolun on Oct 13, 2014 14:38:37 GMT 7
I can't comprehend TA, incl all these "mushroom of death" and what seem like extremely bearish technical drawings. I suppose i could equally draw a "cup of coffee" shape (haha) and extrapolate some extremely bullish lines too. At the end of the day, i feel like what truly matters is the company's fundamentals. Looking at the company's shareholding structure, it also appears that some high-net worth individuals and fund are shareholders too. Note i didn't make the assumption that they are "smart"/"intelligent". Perhaps they could now be looking at this mushroom of death (good grief, death?) shape and bearish signals and be persuaded to all liquidate their holdings ... Cheers!  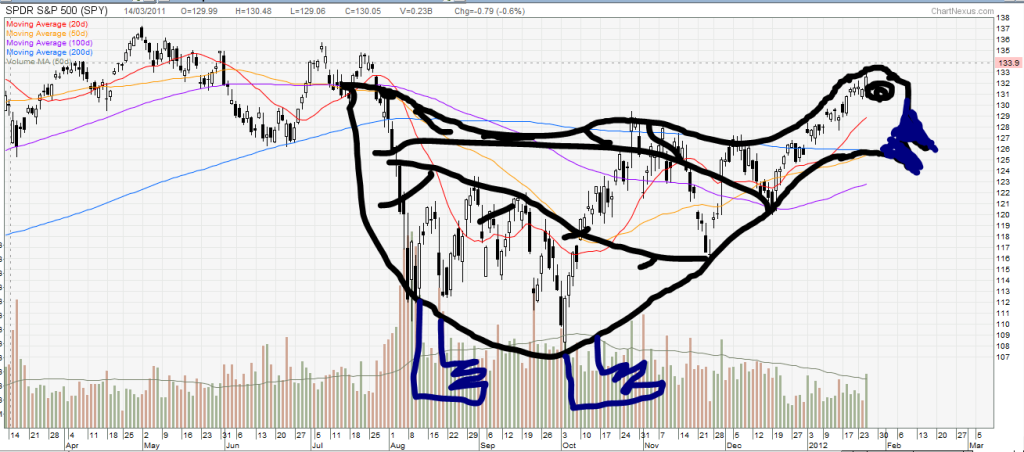 |
|
|
|
Post by zuolun on Jan 7, 2015 12:41:54 GMT 7
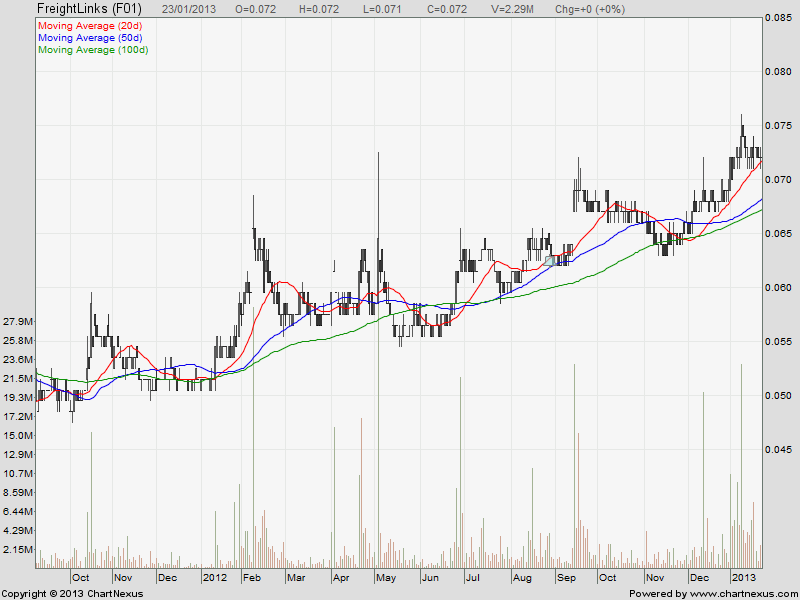
Cup and Handle Pattern in Forex Market — 2 Jan 2013  I can't comprehend TA, incl all these "mushroom of death" and what seem like extremely bearish technical drawings. I suppose i could equally draw a "cup of coffee" shape (haha) and extrapolate some extremely bullish lines too. At the end of the day, i feel like what truly matters is the company's fundamentals. Looking at the company's shareholding structure, it also appears that some high-net worth individuals and fund are shareholders too. Note i didn't make the assumption that they are "smart"/"intelligent". Perhaps they could now be looking at this mushroom of death (good grief, death?) shape and bearish signals and be persuaded to all liquidate their holdings ... Cheers!
|
|
|
|
Post by zuolun on Jan 12, 2015 4:43:29 GMT 7
|
|
|
|
Post by zuolun on Jan 16, 2015 1:43:32 GMT 7
|
|
|
|
Post by zuolun on Jan 22, 2015 10:45:37 GMT 7
Rules for trading a bottom reversal:- A bottom reversal is only possible AFTER a downtrend.
- Most of the patterns need a confirmation.
- A confirmation must appear one up to three candles after the pattern.
- This confirmation is a big white candle, high volume with the new up-move, a rising window, or breaking a resistance.
- A reversal pattern during price reaction must be considered a continuation pattern.
- For the best result, combine candlestick chart patterns with technical indicators and overlays.
- An unconfirmed pattern has no further meaning.
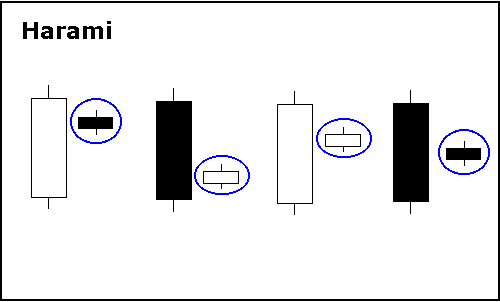
Candlestick Chart Patterns1. Bullish Engulfing 2. Bullish Piercing Line 3. Bullish Counterattack 4. Bullish Harami 5. Bullish Harami Cross 6. Morning Star 7. Morning Doji Star 8. Abandoned Baby 9. Hammer 10. Inverted Hammer 11. Tweezer Bottoms 12. Fry Pan Bottom 13. Three River Bottom 14. Three White Soldiers
|
|
|
|
Post by zuolun on Feb 8, 2015 7:05:59 GMT 7
The Complex Bottom / Complex Inverted Head and Shoulder Pattern The complex bottom is a broad group of relatively irregular price patterns that don’t really fit in any other category and are mirror images of the complex top patterns. When these patterns occur after a market downtrend and precede an uptrend, they are referred to as complex bottoms. 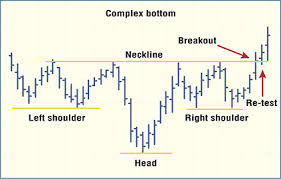 COMPLEX BOTTOM. COMPLEX BOTTOM. A complex head-and-shoulders bottom formation is one of the patterns belonging to this relatively rare group. It is the most common and symmetrical pattern of the group, with the multiple-shoulder variety illustrated here. Once prices break the neckline to the upside, the pattern is considered complete. Prices may retest the neckline, but usually find support at the neckline. As a whole, the group occurs less frequently than some of the more common patterns, but within the group, the complex head-and-shoulders bottom is the most common. It is also the most symmetrical of the group. This pattern consists of multiple heads and/or multiple shoulders and is just as, if not more, reliable than the standard variety of head and shoulders. The complex head and multiple shoulders bottom occurs more frequently than the multiple-head variety, and they usually have the same number of shoulders per side. The figure shows a complex head-and-shoulders bottom with one head and two shoulders on each side. The shoulders usually form at about the same level, and the neckline is relatively horizontal. However, this describes the typical pattern, and exceptions do occur. The shoulders might form at slightly different levels, or the neckline might slope from one side to the other. In any case, the pattern is completed when prices break out above the neckline and start a new uptrend. On occasion, prices will retest the neckline but find support and continue to rally. The pattern is said to have failed if the price breaks back below the neckline. Like the complex top, the complex bottom has no consistently repeated volume pattern of significant predictive use. The Failed Complex Bottom / Complex Inverted Head and Shoulder Pattern Even if the pattern goes ahead as described with a decisive breakout above the neckline, it may be a ‘falsebreak’, i.e. no follow-through on the positive change of trend with the price pulling back below the neckline hitting key supports and goes much further down, below the last low. This should not happen as once the neckline is convincingly broken, is a sign that the bullish trend reversal pattern is negated and the prevailing trend will resume.
|
|
|
|
Post by zuolun on Mar 5, 2015 16:28:09 GMT 7
TA Handbook by Merrill LynchWesterndidi, thank you for your kind comments. My TA is rather basic and I will be embarrassed with my TA knowledge in front of Zuolun. zuolun, any recommendation for TA books? Hi Oldman, I've Finished reading "Your First Million". It's awesome!  Can you recommend any good read for technical analysis? Thank you
|
|
|
|
Post by sptl123 on Mar 5, 2015 22:10:22 GMT 7
TA Handbook by Merrill LynchWesterndidi, thank you for your kind comments. My TA is rather basic and I will be embarrassed with my TA knowledge in front of Zuolun. zuolun, any recommendation for TA books? Swee ! A good reference read and it is free. I like ! Bro Zuolun is a man of few words, full of wisdom and plenty of tools in his pocket  . |
|
|
|
Post by zuolun on Mar 22, 2015 10:12:33 GMT 7
|
|
|
|
Post by sptl123 on Mar 22, 2015 16:31:24 GMT 7
Bro Zuolun, RE: MFI You previously said that MFI is a leading indicator. I understand then but I could not really appreciate the application of it until today. I read your post about AirAsia just now while pondering another post of your: How to use divergences as leading indicators, I plot the following and were very enlighten with MFI. Not limited to the buy-sell signal; there were many example from that historical chart why MFI is a leading indicator and a powerful one ! Huat Ah  Really appreciate your sharing of knowledge all this while. 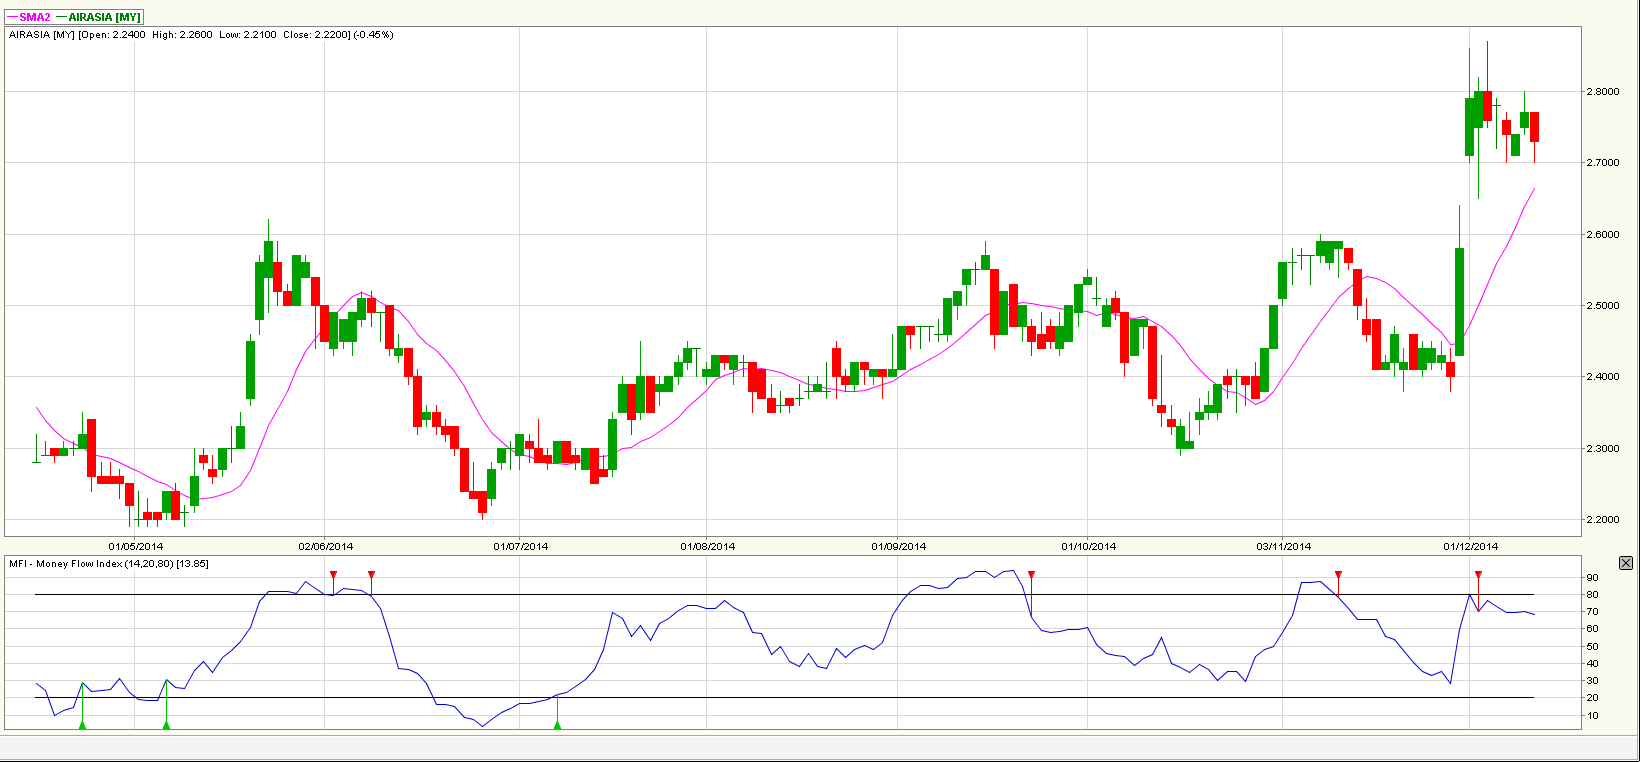 |
|


 .
.