|
|
Post by sptl123 on Jun 23, 2015 22:59:33 GMT 7
Bro Zuolun, I am still unclear about Gartley Pattern. During the past months, one moment I thought I understand them but the next moment I am confused.  Have been going round and round and it seems that the more I know the more I don't know.  Please could you help me with the following Q1 to Q7: 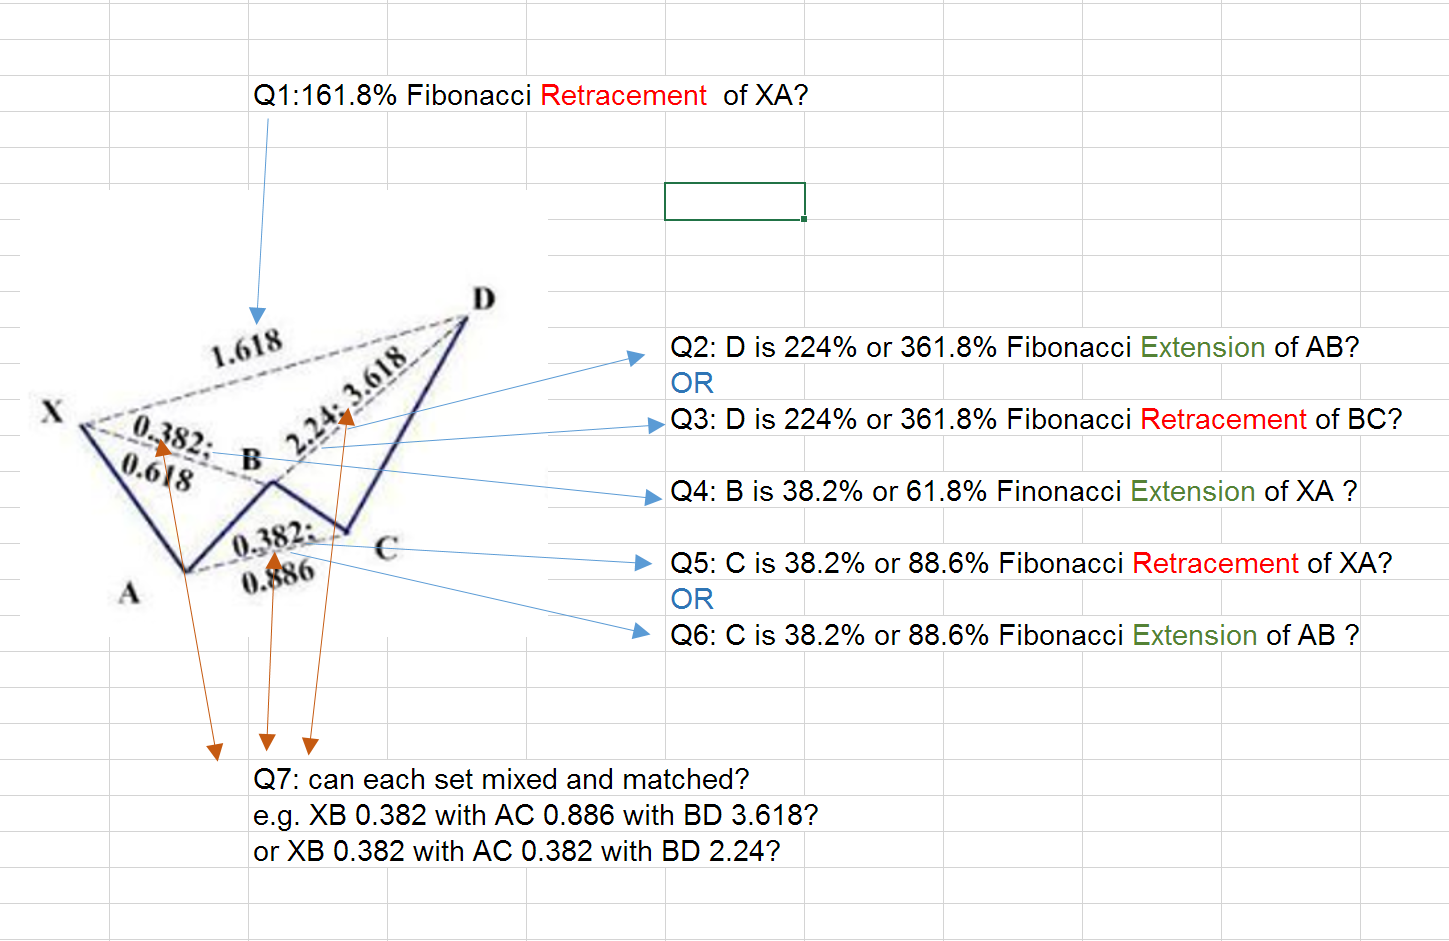 |
|
|
|
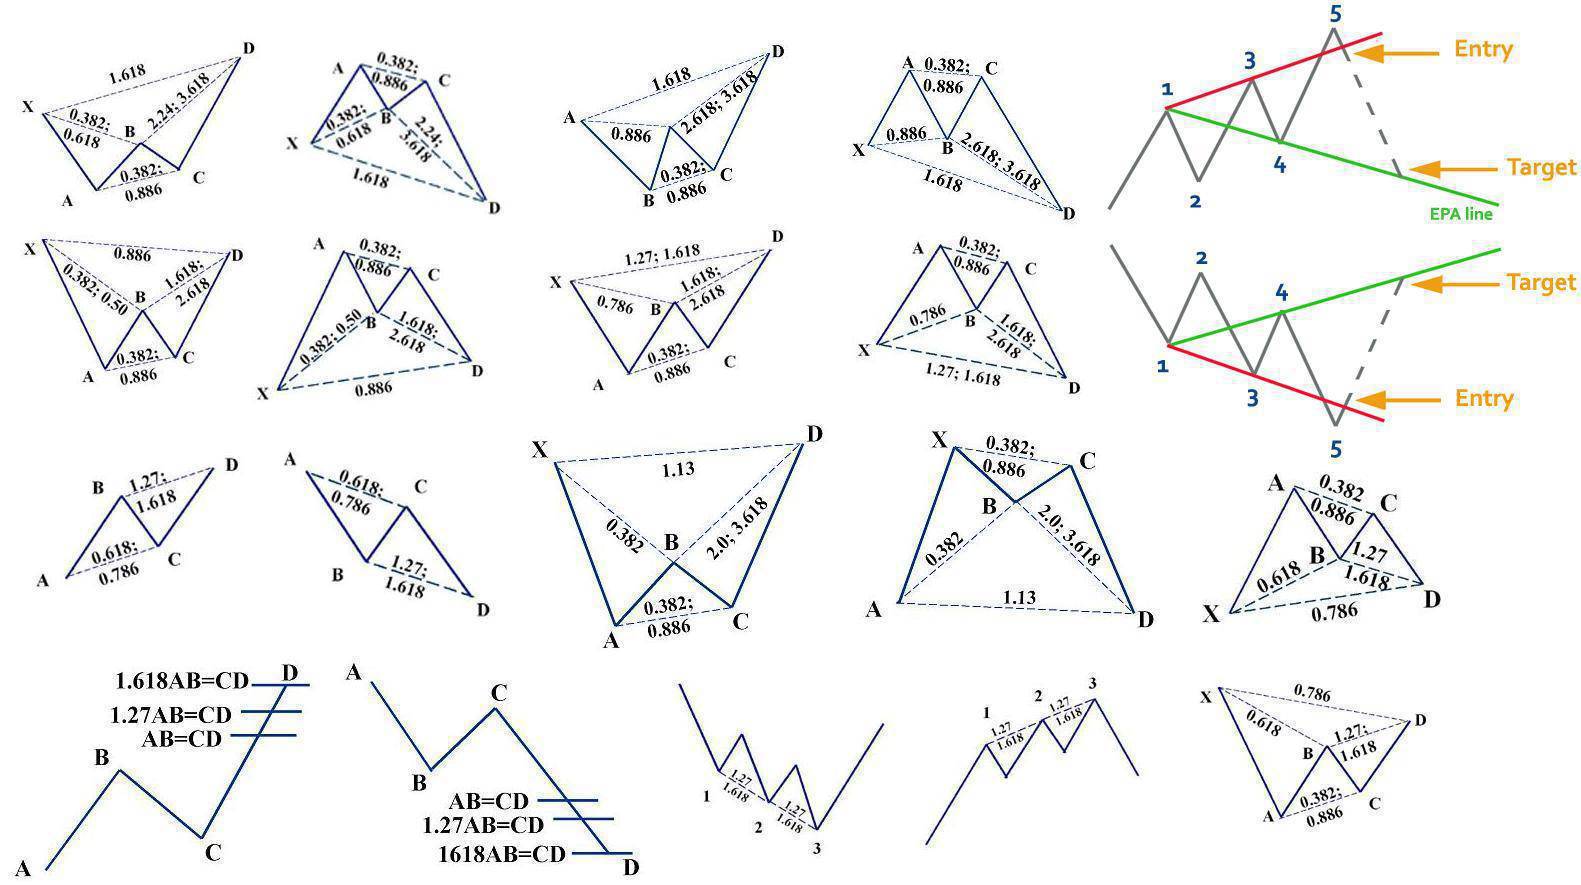
Post by zuolun on Jun 23, 2015 23:56:46 GMT 7
Bro Zuolun, I am still unclear about Gartley Pattern. During the past months, one moment I thought I understand them but the next moment I am confused. Have been going round and round and it seems that the more I know the more I don't know. Please could you help me with the following Q1 to Q7: , You get confused because the ratio is different for butterfly, bat and crab gartley pattern. A picture is worth a thousand words.   |
|
|
|
Post by sptl123 on Jun 24, 2015 0:03:33 GMT 7
Bro Zuolun, I am still unclear about Gartley Pattern. During the past months, one moment I thought I understand them but the next moment I am confused. Have been going round and round and it seems that the more I know the more I don't know. Please could you help me with the following Q1 to Q7: , You get confused because the ratio is different for butterfly, bat and crab gartley pattern. A picture is worth a thousand words. Thank you bro Zuolun. You are excellent! |
|
|
|
Post by zuolun on Jun 30, 2015 8:01:46 GMT 7
 Hammer: Hammer:The Hammer is a bullish reversal candlestick. Hammer candlesticks occur when price moves significantly lower after the open, but rebounds to close well above the low. In a perfect hammer, this tail is twice the length of the body and the candlestick will have no upper shadow or wick. The smaller the body and the longer the tail, the more significant the hammer is as a bullish indicator. Hammers form at trend bottoms.  Bro Zuolun, wu-teo bo? Starhub trade at S$3.85 ( -0.12, -3.02%) with 3.64 million done at 11.53HR on 29th June 2015. I opened a position at $3.85 to test water. , 虎口偷金,重点是先减少无谓的亏损,进攻反而是其次。 Starhub ~ Bearish Head and Shoulders Breakout, interim TP S$3.61Starhub closed with a long-tailed hammer @ S$3.89 (-0.08, -2%) with extremely high volume done at 6.59m shares on 29 Jun 2015. Immediate support @ S$3.70, immediate resistance @ S$3.92.  Starhub (weekly) ~ Double Top formation Starhub (weekly) ~ Double Top formation |
|
|
|
Post by sptl123 on Jul 4, 2015 20:28:20 GMT 7
Bro Zuolun, A) Double Bottom works for TT International. B) The latest price actions of TT International meet the perfect ration of an IDEAL Bullish AB=CD Pattern. C) After the completion of such pattern, price suppose to trend up. However, Bro Zuolun, have you ever seen a failed or false break out of such pattern after it has emerged and completed then price continue to go down? A) Double Bottom  B) AB=CD   |
|
|
|
Post by sptl123 on Aug 7, 2015 14:08:15 GMT 7
Thank you Bro zuolun for sharing your TA knowledge and skills with us all this while. " 已有的事,后必再有。已行的事,后必再行。日光之下并无新事。"
" 上楼爬楼梯,下楼坐电梯."  A Gartley Butterfly at work one hour ago. China A50 Index~ 7th August 2015. A bearish Gartley Butterfly start to emerge at 1027HR and completed at 1318HR. For short trade upon the completion of this perfect bearish Butterfly pattern, when strike at 11040 and close at 10830 (both RSI and CCI has +ve divergence at this point and that indicate the trend may be reversing up). 180 points yield profit of S$ 180X1.355 = S$ 243.90 per contract. If 10 contracts S$ 2,439.00 not bad for a National Day Holiday.  Not vested at the time of posting.  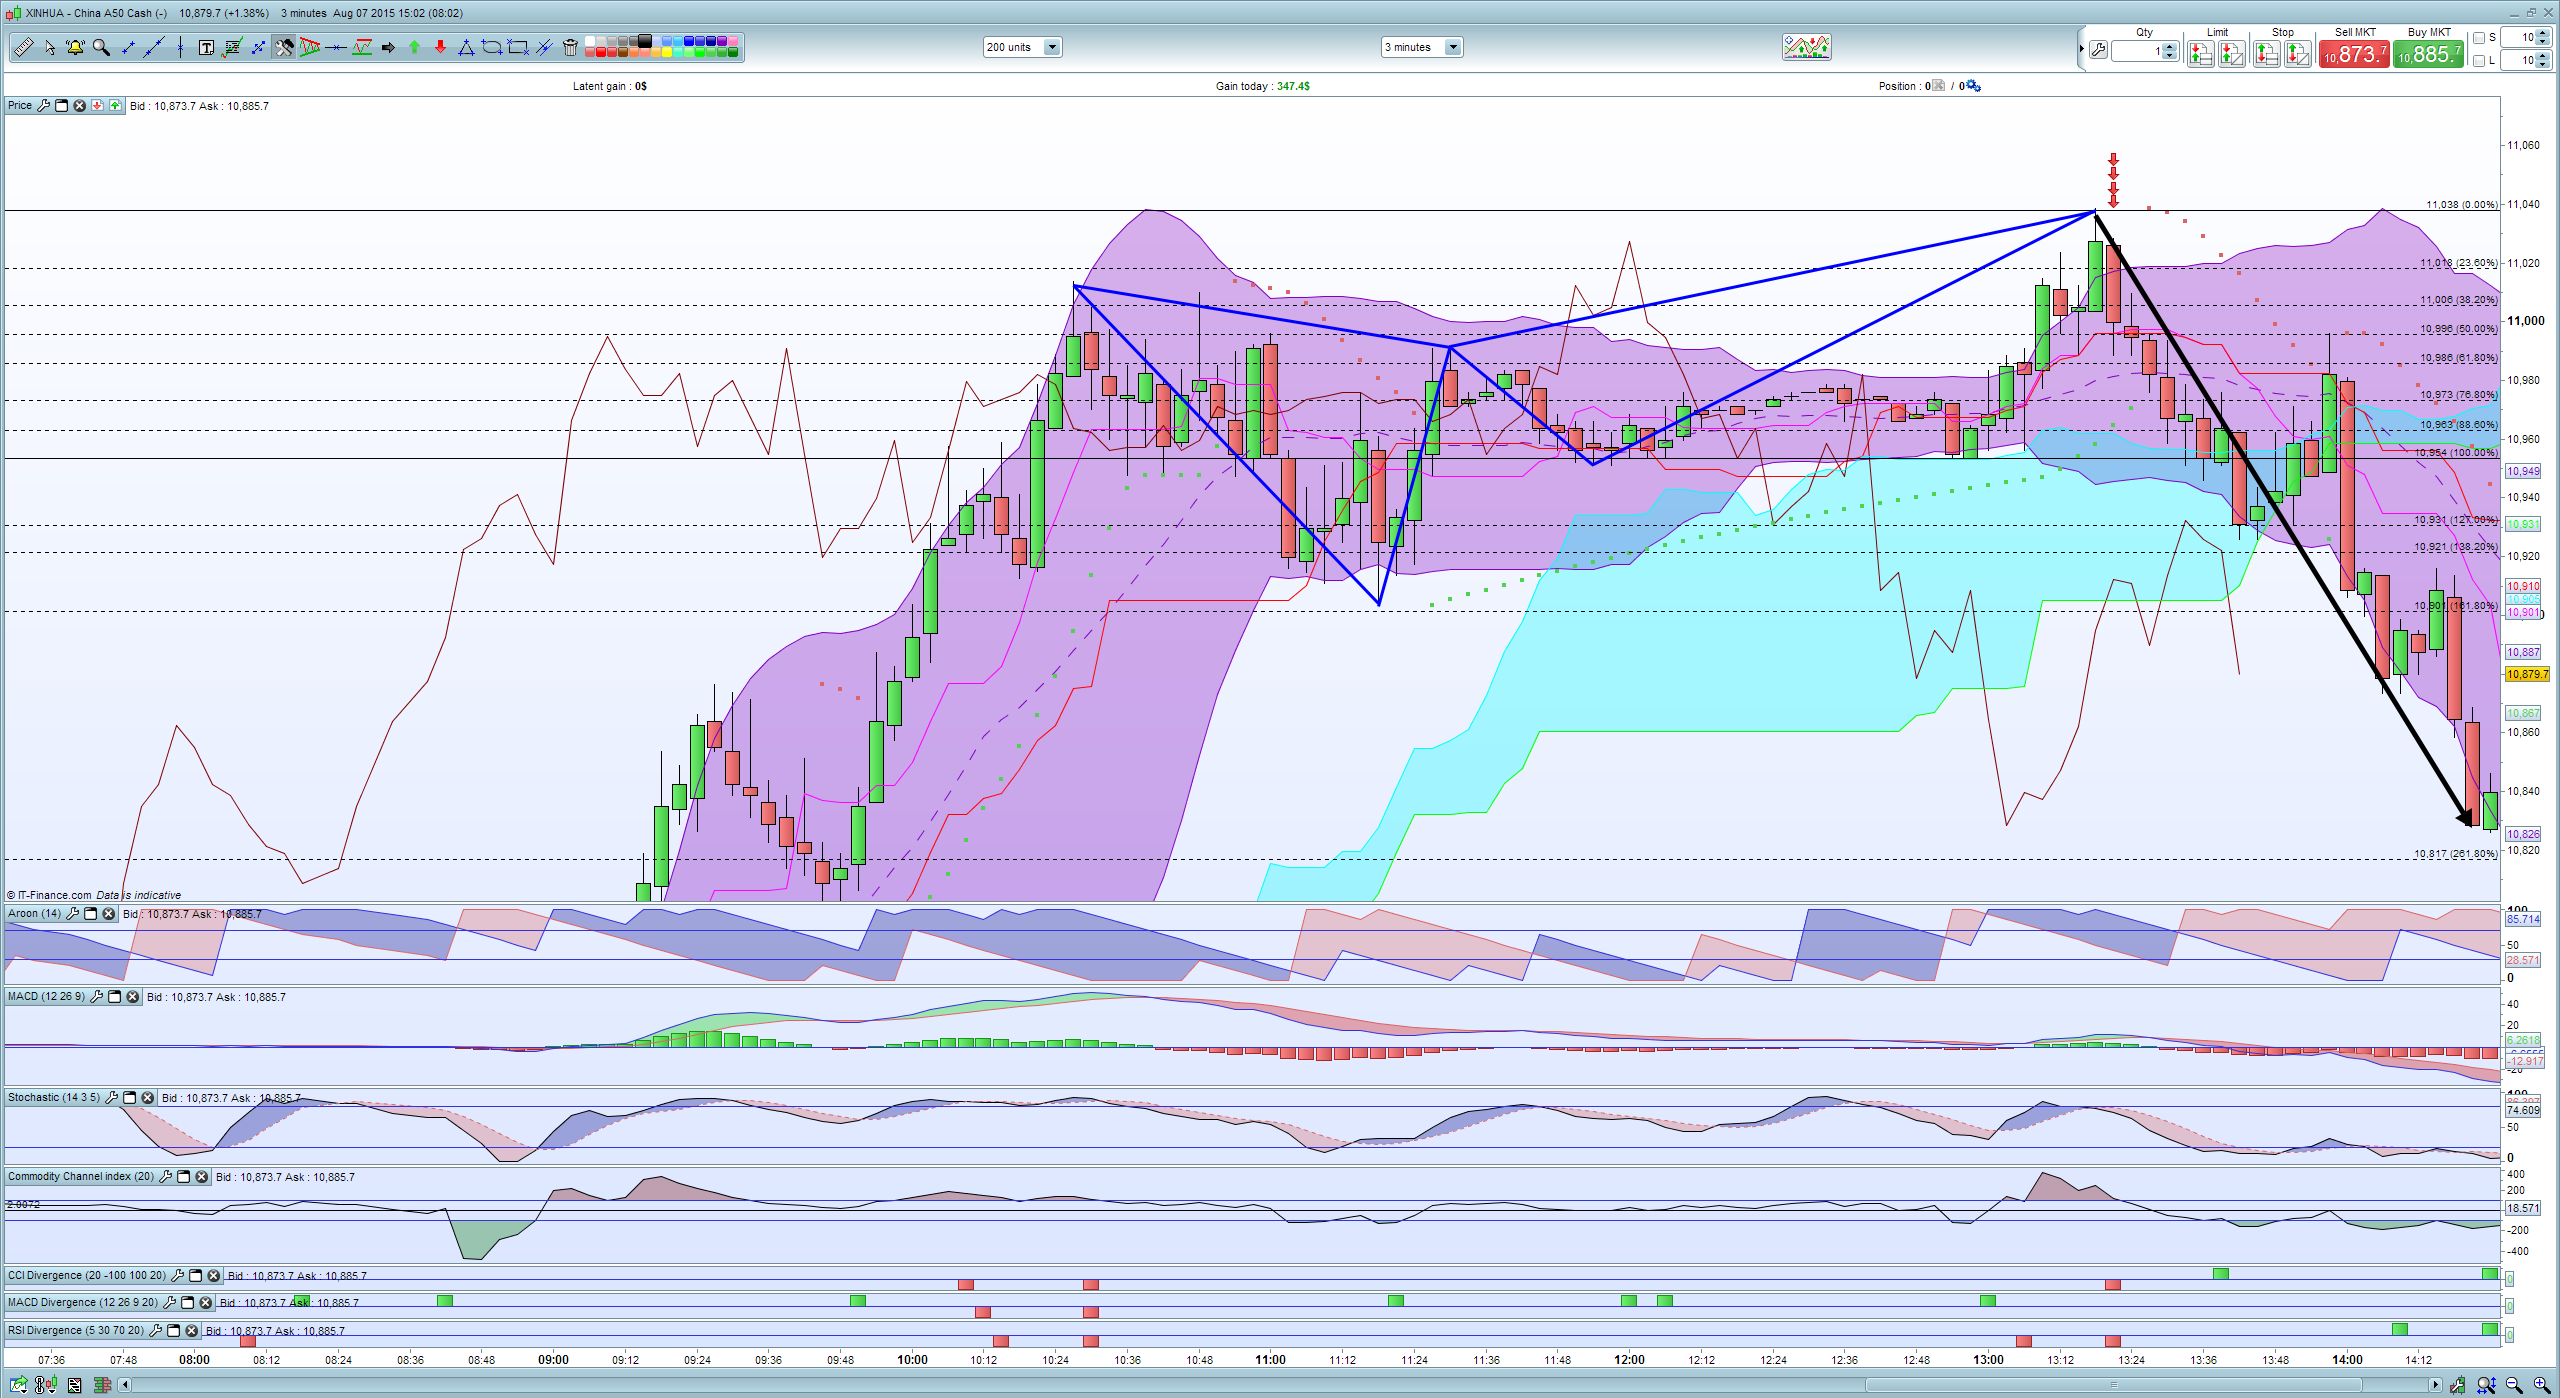 ![]() |
|
|
|
Post by sptl123 on Aug 16, 2015 23:44:54 GMT 7
Once again thank you Bro zuolun for sharing your TA knowledge and skills with us all this while. My broker keep asking me to buy Trek 2000. However due to prevailing market condition, I have not done so. Looking at the harmonic ratio of the chart, it is a perfect Bullish Gartley Bat. Bro zuolun, upon a completion of a bullish Gartley Pattern, how often or what is the probability that the price action goes against the expected movement? Bro Zuolun, go or no-go for Trek 2000? 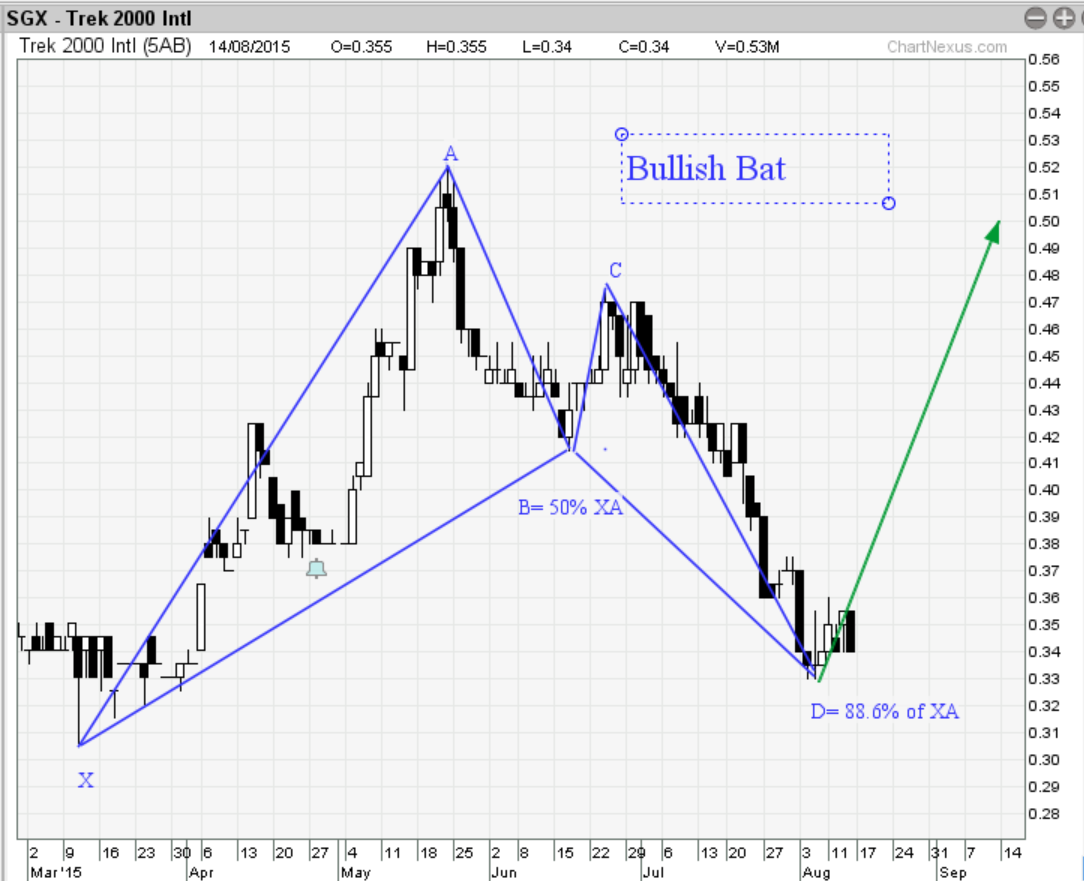 |
|
|
|
Post by zuolun on Aug 17, 2015 6:18:45 GMT 7
sptl123, Agreed, Trek 2000 has a bullish set-up. Yes, it's a go for Trek 2000 (a white marubozu @ S$0.35 or above is preferable for a bullish confirmation). The probability of the share price going against the expected movement is always there. Learn how to manage the downside risk by setting a cut-loss level according to your risk appetite. For me, I will place my stop-loss level @ S$0.31, if the bullish gartley pattern is negated. Once again thank you Bro zuolun for sharing your TA knowledge and skills with us all this while. My broker keep asking me to buy Trek 2000. However due to prevailing market condition, I have not done so. Looking at the harmonic ratio of the chart, it is a perfect Bullish Gartley Bat. Bro zuolun, upon a completion of a bullish Gartley Pattern, how often or what is the probability that the price action goes against the expected movement? Bro Zuolun, go or no-go for Trek 2000?
|
|
|
|
Post by sptl123 on Aug 31, 2015 0:40:17 GMT 7
Bro zuolun, Hope you are well. I am glad that the renovation and shifting to my new home is more or less completed! Harmonic Pattern; I am convinced..... In the span of last 24 hours, DAX 15 minutes chart ; 4 Harmonic Patterns; 4++ trading opportunities. 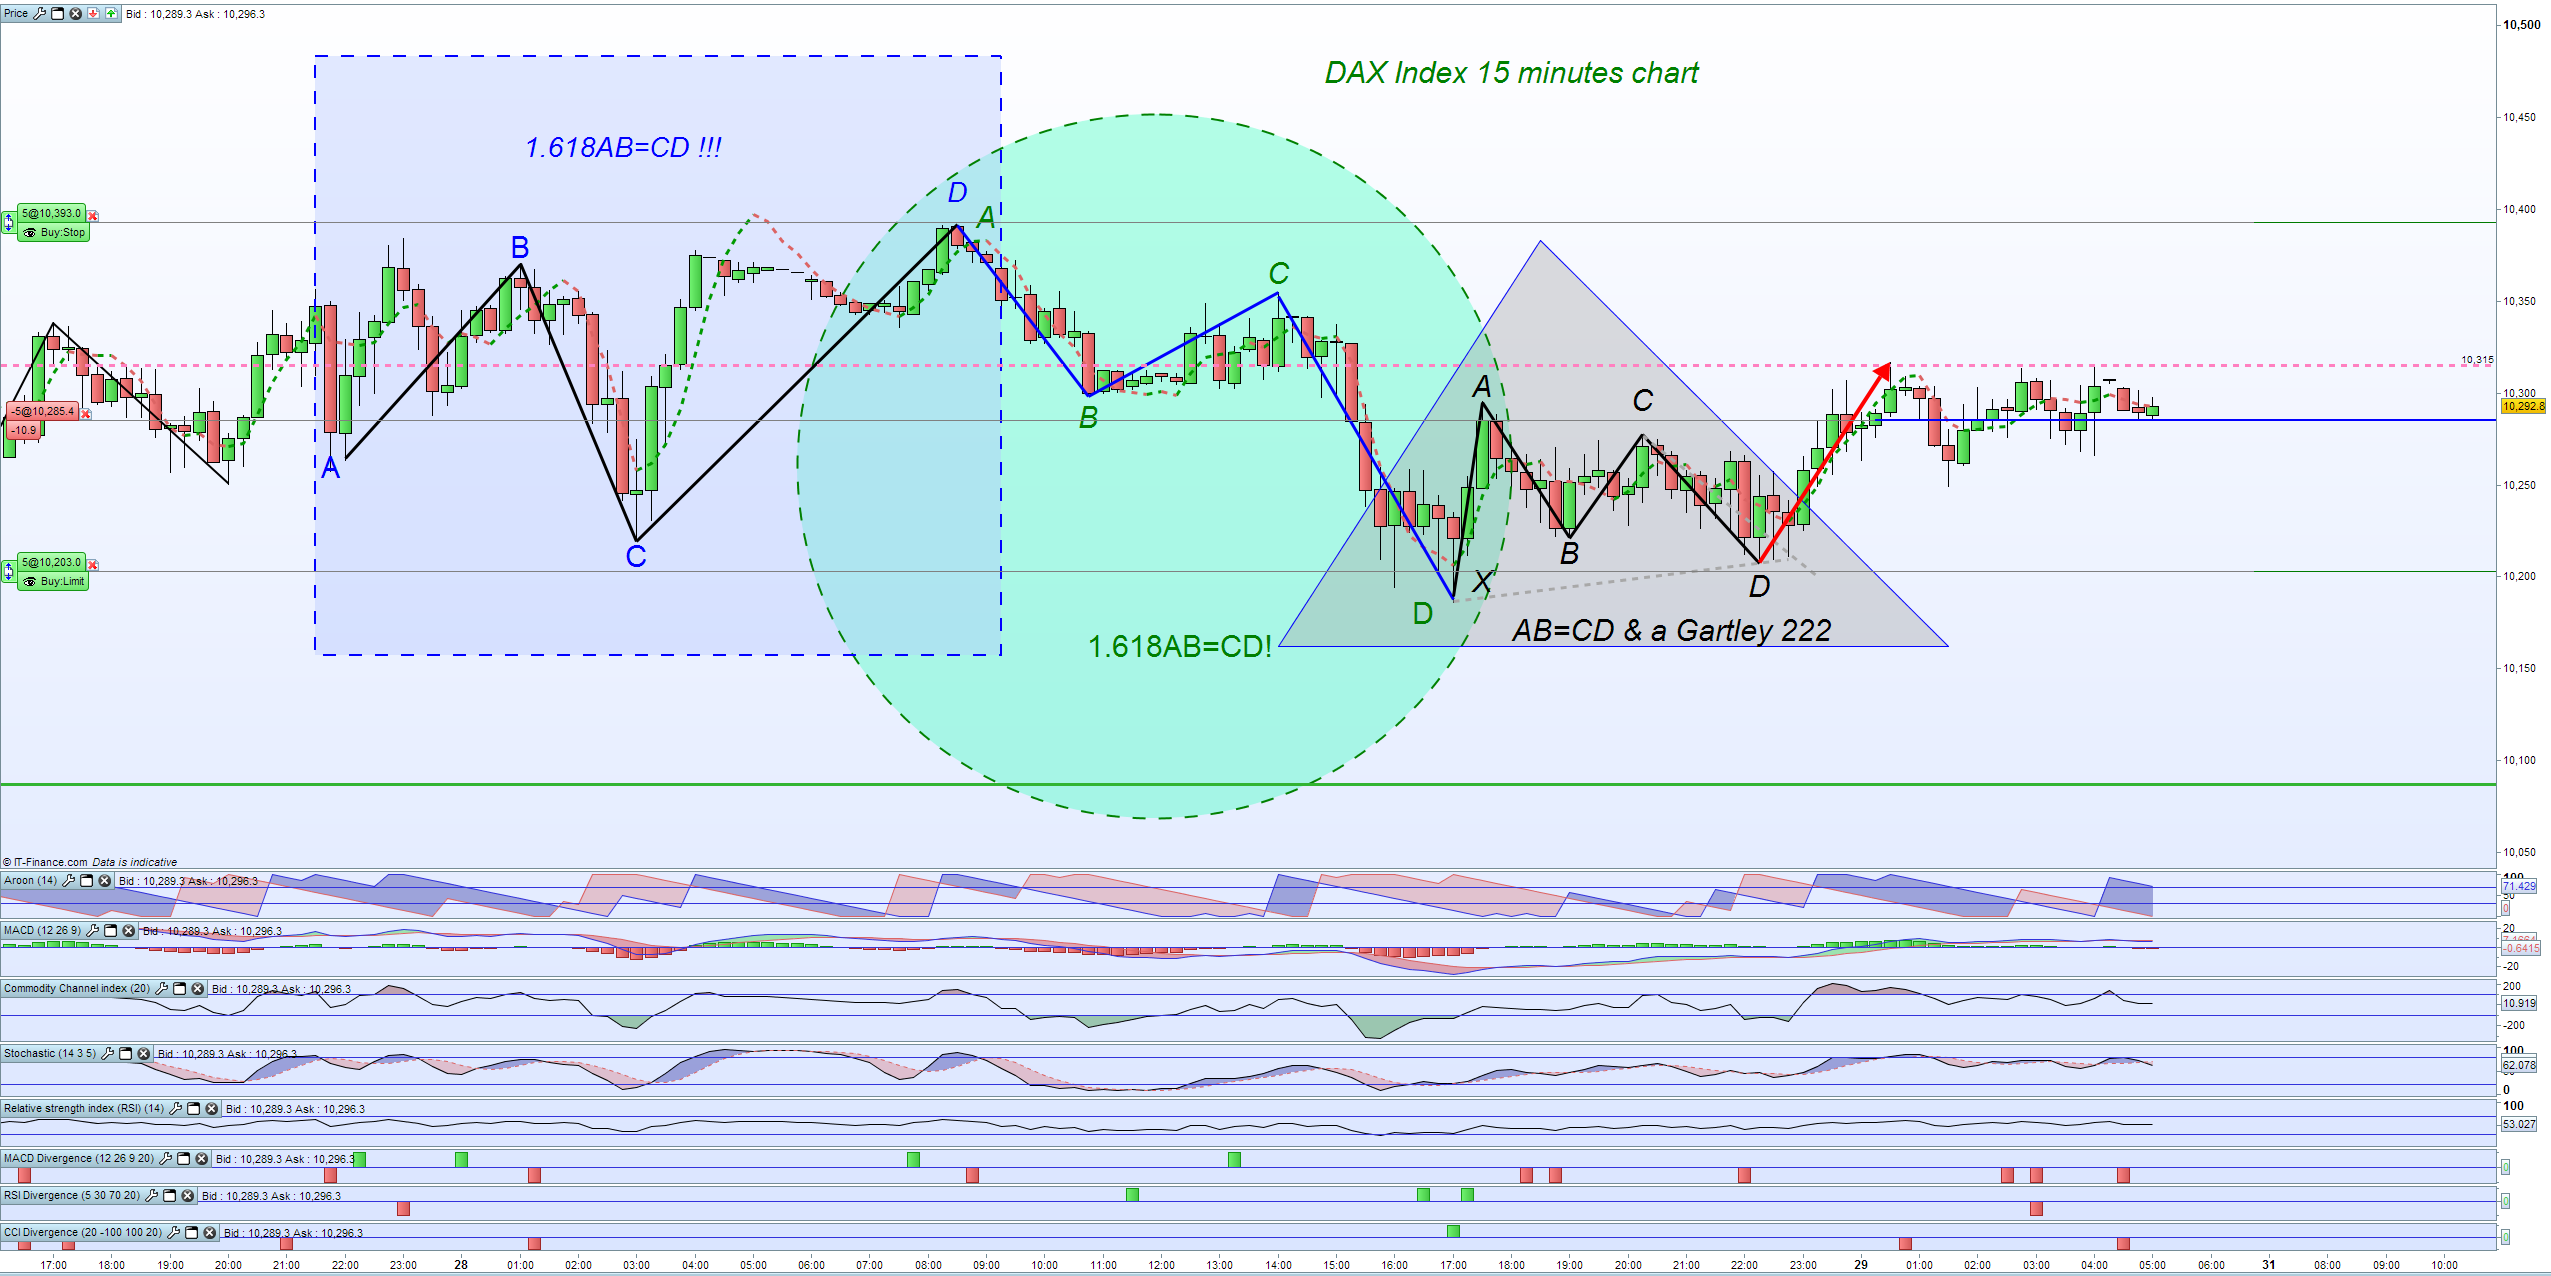 |
|
|
|
Post by zuolun on Mar 8, 2016 12:22:02 GMT 7
|
|