|
|
Post by zuolun on Jun 9, 2015 18:15:59 GMT 7
STI ~ Broke the 200d SMA, watch the support @ 3200 STI closed at day's low with a long black marubozu @ 3295.13 (-25.2, -0.8%) on 9 Jun 2015. Immediate support @ 3291, immediate resistance @ 3322. 
|
|
|
|
Post by zuolun on Jun 11, 2015 22:40:52 GMT 7
STI ~ Broke the 200d SMA, watch the support @ 3200STI closed with an inverted hammer @ 3347.67 (+21.9, +0.7%) on 11 Jun 2015. Immediate support @ 3322, immediate resistance @ 3360.  STI (weekly) ~ Uptrend intact STI (weekly) ~ Uptrend intact
|
|
|
|
Post by zuolun on Jun 16, 2015 12:42:57 GMT 7
STI ~ Broke the 200d SMA, watch the support @ 3200 STI had a long black marubozu @ 3.296.74 (-26.39, -0.8%) on 16 Jun 2015 at 0135 hrs. Immediate support @ 3291, immediate resistance @ 3322. 
|
|
|
|
Post by zuolun on Jun 28, 2015 21:40:42 GMT 7
Bro zuolun, RE: STI INDEX1) Is the Elliot Wave drawn correctly? 2) Is the Corrective wave for STI completed? I read that there are two different/conflicting guide line of corrective wave: One states that Wave C should end around Wave 4 and the other say that Wave A would end around Wave 4.Bro Zuolun, which one is more correct? , Based on your new chart, I've edited your latest STI Elliott Wave chart pattern dated 26 Jun 2015. STI ~ Broke the 200d SMA, watch the critical support @ 3200STI closed with a long black marubozu @ 3320.89 (-28.97, -0.9%) on 26 Jun 2015. Immediate support @ 3291, immediate resistance @ 3346.  STI (weekly) as at 26 Jun 2016 STI (weekly) as at 26 Jun 2016 STI ~ The Elliott Wave pattern as at 26 Jun 2015 STI ~ The Elliott Wave pattern as at 26 Jun 2015The STI had hit a new high @ 3549 points on 16 Apr 2015 suppressing the last high @ 3464 points (+85 points, +2.5%) scored on 22 May 2013 — it means the STI's uptrend is still intact. However, if the STI breaks the critical support @ 3200 and collapses sharply to 2841 points or lower, then it is considered entering into a bear market territory.Alternative Wave-3:- The current pullback (-7.3% or -258 points) from the last high @ 3549 points is a healthy correction if the last low @ 3291 points holds.
- If the STI resumes its uptrend (after the current correction is done) suppressing 3549 points and forms a higher high @ 3596 points or 123.6% Fibonacci extension level, then the alternative Wave-3 would be in place. Wave-3 is typically the longest of the 3 impulsive waves, if it goes even higher to 3692 points or 161.8% Fibonacci extension level, then the alternative Wave-4 should be @ 3346 points.
- If one is bullish that the STI has great potential to retest the historical all time high at 3906 points scored on 10th Oct 2007, then the STI's uptrend is far from over. From the last closing of the STI at 3320 points on 26 Jun 2015 to the historical all time high of the STI at 3906 points; the difference is 586 points.
 STI (10 Oct 2007 to 28 Oct 2008) — The Elliott Wave pattern (Corrective Wave A-B-C) STI (10 Oct 2007 to 28 Oct 2008) — The Elliott Wave pattern (Corrective Wave A-B-C)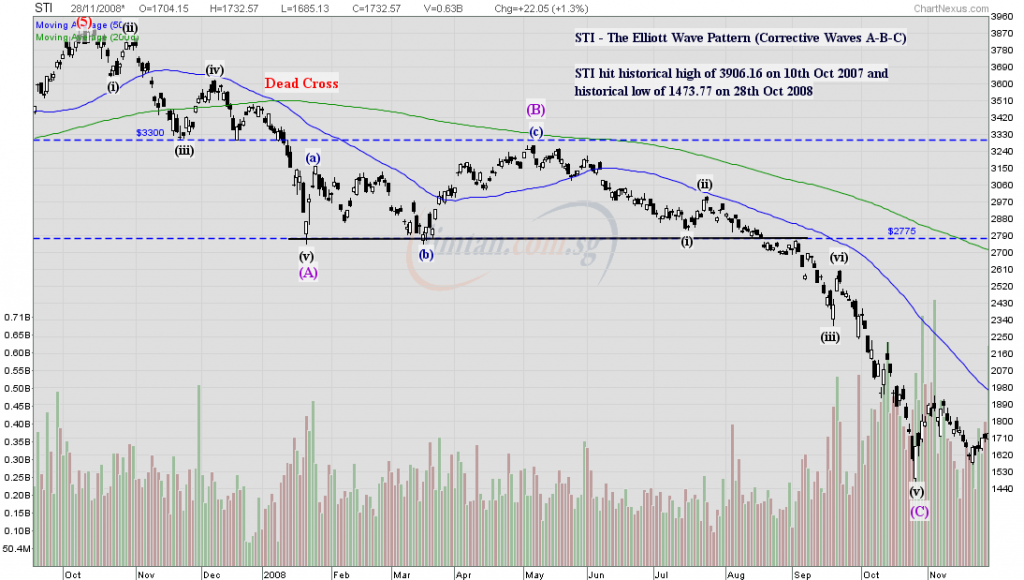 |
|
|
|
Post by zuolun on Aug 5, 2015 6:08:55 GMT 7
STI ~ Major bearish trend reversal with 5-wave down, expect a dead cat bounceSTI closed with a hammer @ 3191.04 (-1.75, -0.1%) on 4 Aug 2015. Crucial support @ 3151, immediate resistance @ 3200.  STI ~ Broke the 200d SMA, watch the support @ 3200 STI closed at day's low with a long black marubozu @ 3295.13 (-25.2, -0.8%) on 9 Jun 2015. Immediate support @ 3291, immediate resistance @ 3322.
|
|
|
|
Post by zuolun on Aug 8, 2015 15:34:27 GMT 7
The Singapore MSCI Futures is designed for investors to hedge against their existing long positions on the ST Index stocks with short-trades. Singapore MSCI Futures closed @ 353.40 (-1.5, -0.42%) on 7 Aug 2015. Singapore MSCI Futures closed @ 376.95 (-1.15, -0.3%) on 5 Sep 2014. Singapore MSCI Futures closed @ 376.95 (-1.15, -0.3%) on 5 Sep 2014.

STI ~ Major bearish trend reversal with 5-wave down, expect a dead cat bounceSTI closed with a hammer @ 3191.04 (-1.75, -0.1%) on 4 Aug 2015. Crucial support @ 3151, immediate resistance @ 3200. |
|
|
|
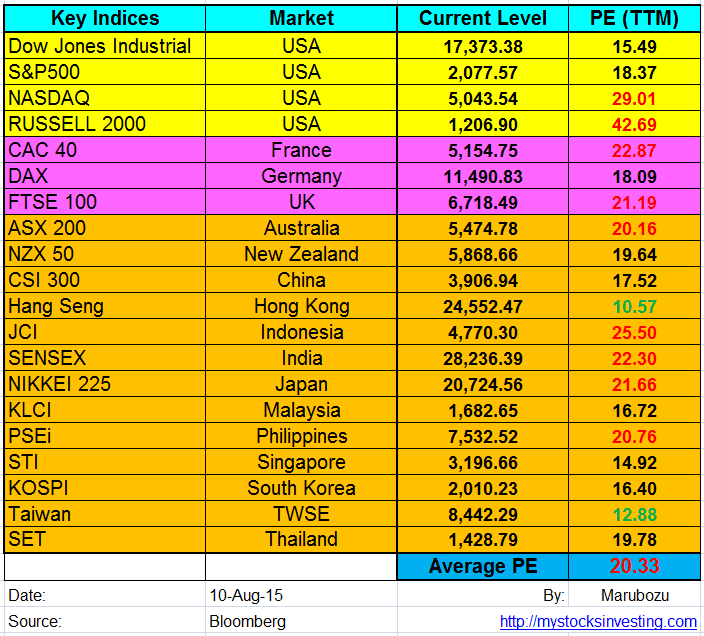
Post by zuolun on Aug 10, 2015 12:41:20 GMT 7
|
|
|
|
Post by zuolun on Aug 25, 2015 8:49:49 GMT 7
STI ~ The Elliott Wave pattern as at 26 Jun 2015The STI had hit a new high @ 3549 points on 16 Apr 2015 suppressing the last high @ 3464 points (+85 points, +2.5%) scored on 22 May 2013 — it means the STI's uptrend is still intact. However, if the STI breaks the critical support @ 3200 and collapses sharply to 2841 points or lower, then it is considered entering into a bear market territory. STI gapped down and closed with a long black marubozu @ 2843.39 (-127.62, -4.3%) on 24 Aug 2015. Immediate support @ 2812, immediate resistance @ 2918.  |
|
|
|
Post by zuolun on Aug 27, 2015 11:28:59 GMT 7
|
|
|
|
Post by zuolun on Aug 31, 2015 6:05:02 GMT 7
|
|
|
|
Post by odie on Sept 4, 2015 21:59:46 GMT 7
UOL, Yangzijiang and SATS to become STI constituent stocks
The move follows a semi-annual review of the index when new liquidity rules take effect.
POSTED: 04 Sep 2015 08:54
SINGAPORE: UOL Group, Yangzijiang Shipbuilding Holdings and SATS will become constituent stocks in Singapore's benchmark Straits Times Index (STI) from Sep 21, replacing Jardine Matheson Holdings, Jardine Strategic Holdings and Olam International.
This follows a semi-annual review of the index when new liquidity rules take effect, Singapore Press Holdings, Singapore Exchange and FTSE Russell said in a statement on Thursday (Sep 3).
Shares of companies that make up the STI tend to be more actively traded, as some fund managers follow indexes closely.
|
|
|
|
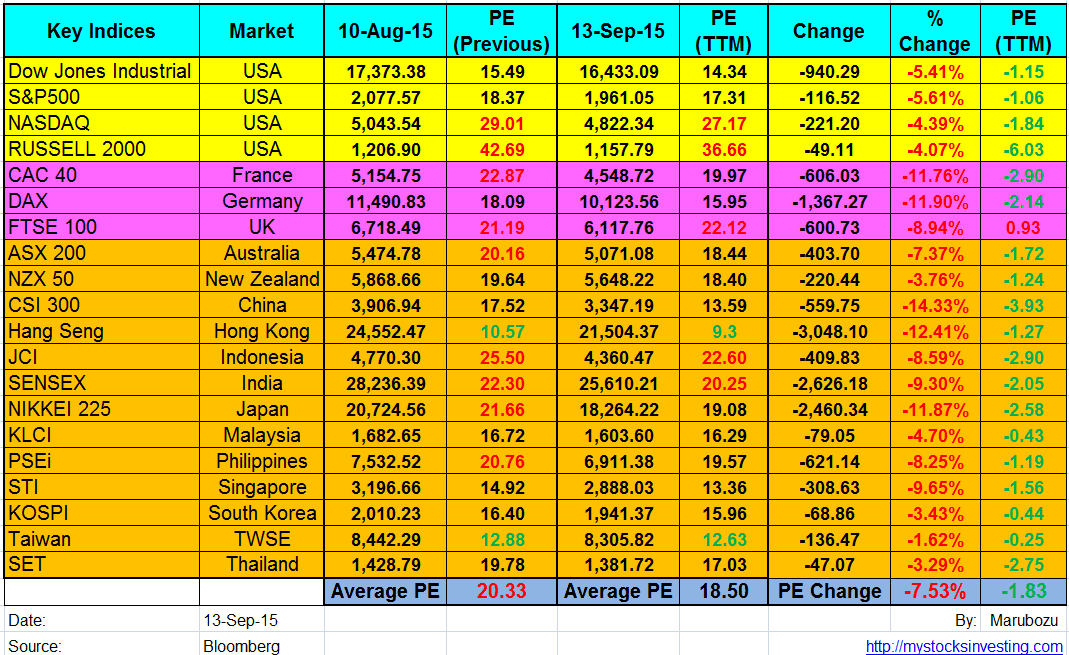
Post by zuolun on Sept 16, 2015 9:13:56 GMT 7
|
|
|
|
Post by zuolun on Sept 16, 2015 14:28:38 GMT 7
|
|
|
|
Post by zuolun on Sept 28, 2015 16:42:35 GMT 7
STI ~ Major bearish trend reversal with 5-wave down, interim TP 2700, next TP 2255STI closed with a black marubozu @ 2791.92 (-40.72, -1.4%) on 28 Sep 2015. Immediate support @ 2775, immediate resistance @ 2845. 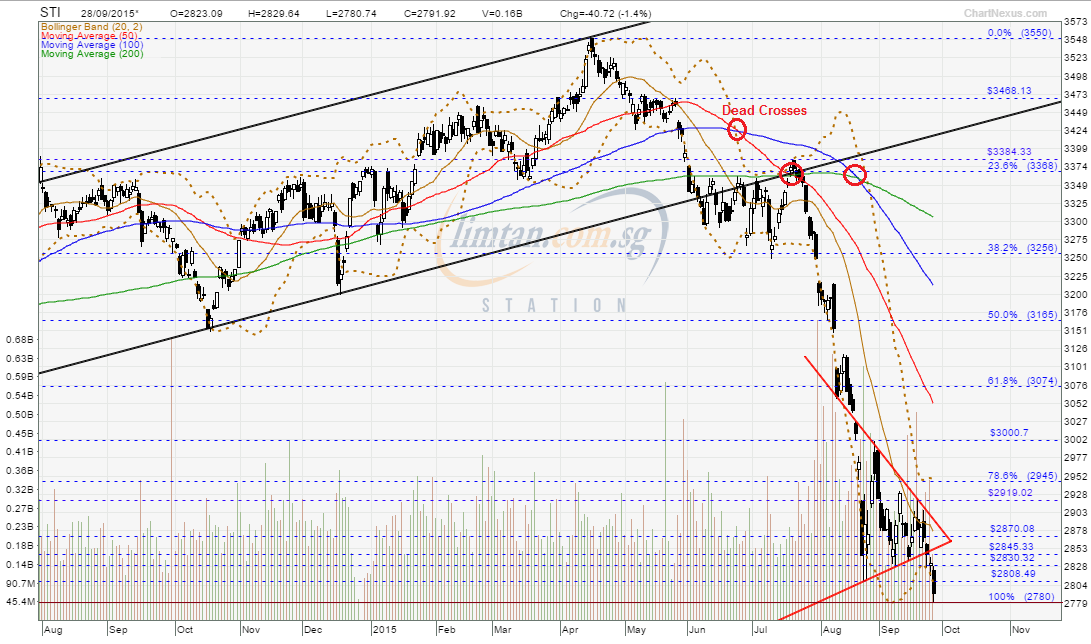 Singapore MSCI Futures @ 310.75 (-5.45, -1.72%) on 28 Sep 2015 at 13:56 hrs Singapore MSCI Futures @ 310.75 (-5.45, -1.72%) on 28 Sep 2015 at 13:56 hrs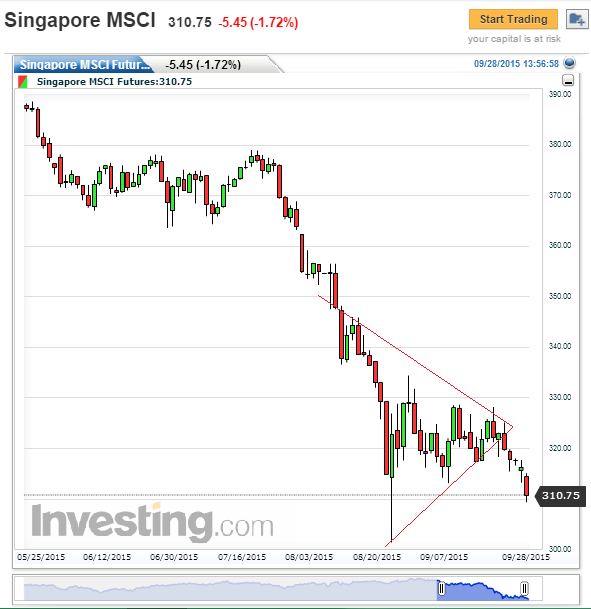 STI (weekly) ~ Major bearish trend reversal, interim TP 2700, next TP 2255 STI (weekly) ~ Major bearish trend reversal, interim TP 2700, next TP 2255 End-of-day Insights: Investors had mixed sentiments as STI breaks 2,800 level End-of-day Insights: Investors had mixed sentiments as STI breaks 2,800 level28 Sep 15 The STI broke the 2,800 support level on Monday, falling 1.4% after returning from the weekend. Investors then had mixed views and bought into both calls and puts. Call warrant STI 3000 MB ECW151231 (BFWW, -17%) saw buying for 630K while the put warrant STI 2950 MB EPW151231 (BEBW, +10.4%) had investors buying into 500K warrants. In the put with a lower strike STI 2800 MB EPW151231 (BFVW), investors exited with gains after the warrant ended the day 11.3% higher. SingTel was leading the decline on Monday, tumbling 3.3% and investors bought 745K of call warrant SINGTEL MB ECW160111 (AMCW, strike $3.70, -23.2%). In other blue-chip counters, they bought into OCBC and Keppel Corp calls while exiting from DBS and SGX calls. DBS had the strongest performance as compared to the other two local banks and investors bought into OCBC calls while selling out of DBS calls. OCBC call warrant OCBC BK MB ECW160111 (BFPW, strike $9, -15.7%) saw investors take home 520K warrants while DBS call warrant DBS MB ECW160201 (BFLW, strike $18.60, -12.9%) had them exit from 460K warrants. In other financial counters, SGX ended the day 1% lower and investors sold out of 920K of call warrant SINGAPORE EXCHANGEMBECW160105 (ANOW, strike $8, -12.9%). Keppel Corp investors had mixed sentiments and bought into both calls and puts. They bought 360K of call warrant KEPCORP MB ECW160201 (BDHW, strike $7.80, -12.1%) and another 540K of put warrant KEPCORP MB EPW160201 (BDIW, strike $7, +6.4%).
|
|
|
|
Post by zuolun on Sept 30, 2015 9:57:50 GMT 7
STI ~ The Elliott Wave pattern as at 26 Jun 2015The STI had hit a new high @ 3549 points on 16 Apr 2015 suppressing the last high @ 3464 points (+85 points, +2.5%) scored on 22 May 2013 — it means the STI's uptrend is still intact. However, if the STI breaks the critical support @ 3200 and collapses sharply to 2841 points or lower, then it is considered entering into a bear market territory. STI closed @ 2,787.94 (-3.98, -0.14%) on 29 Sep 2015. Singapore’s Straits Times Index slips into bear territory ~ 29 Sep 2015 A tale of two cities29 Sep 2015 The two cities see each other as rivals. Singapore markets itself as the gateway to Asia, notably Southeast Asia, while Hong Kong has benefited from its status as the gateway to China. A comparison can be made of their two indices as well. The investable Hong Kong market, as represented by its index, is about five-and- a-half times as big as the Singapore market. Both have declined significantly since the beginning of the year, and even when compared to five years ago. Sector-wise, the Hang Seng Index (HSI) is skewed towards financials, with almost half the index made up of banks and insurance companies. Singapore's Straits Times Index (STI), meanwhile, is about one-third banks. A full tenth of the HSI is also dominated by a single Internet company - Tencent - while telco Singtel also takes up almost 12 per cent of the STI. In terms of valuation, the HSI trades at a lower price-to-earnings multiple than the STI in absolute terms. The HSI at nine times earnings is at the lower range of where it has traded in the last few years, of between nine and 11 times. The STI, at 13 times earnings, is down from a peak of 16 times earlier this year, and trading roughly at where it has been for the last few years. In terms of price-to-book ratios, however, both indices are trading at multi-year lows. HSI companies seem to be valued more cheaply than STI companies when their cash flows are taken into account. However, they also have significantly more debt relative to their net assets. To sum up, Hong Kong looks like a cheaper market than Singapore, with higher profitability to boot. However, the market could be pricing in higher risks, especially from higher debt levels. 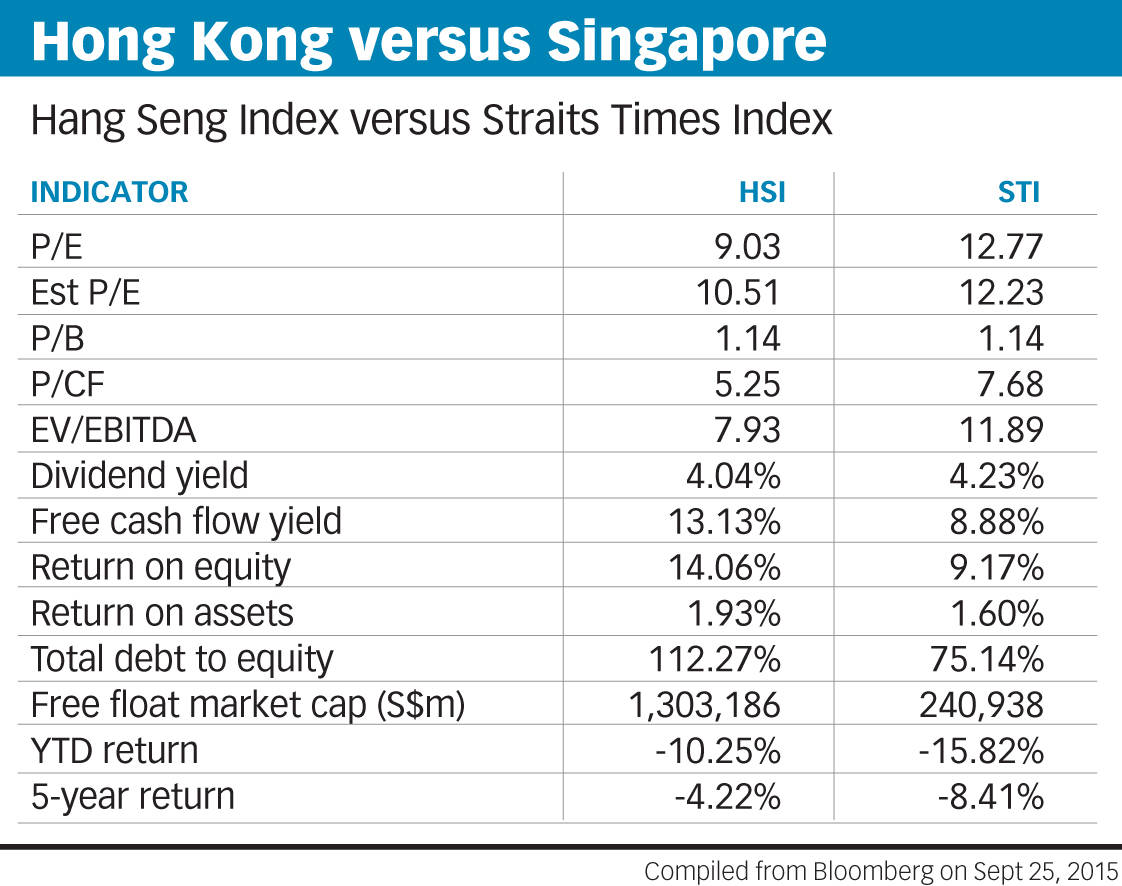 |
|