|
|
Post by stockpicker on May 21, 2014 5:05:18 GMT 7
DOW shed about 137 point or 0.83% to close at 16374. The selling was caused by comments from Philadelphia Fed President Charles Plosser, who said that Fed might need to act sooner rather than later should the economy accelerate. From now on, it may likely that good and bad news will be taken as bad news until Fed office make another comment. The bear market is about to start. Technically, DOW broke the intermediate trend line and found another support at the final trend line at around 16375. That support is also the base line of the ichimoku curve and hopefully, a stronger support. However, DOW is very weak at the moment but the bulls has not taken much advantage and needed help for example from FED's comment. Yesterday's break down of the trendline was without the commitment of trade volume. It would interesting to see how DOW would develop today and if DOW's bear camp would be able to take control of the market.  |
|
|
|
Post by zuolun on May 21, 2014 9:59:17 GMT 7
 DJ — Bearish Major Short-Term Trend Reversal; expect a nasty sell-off DJ — Bearish Major Short-Term Trend Reversal; expect a nasty sell-offDJ broke the 50d SMA and closed with a hammer @ 16,374.31 (-137.55, -0.83%) on 20 May 2014. Immediate resistance @ 16,401, the 50d SMA (support-turned-resistance), immediate 38.2% FIBO support @ 16,202.  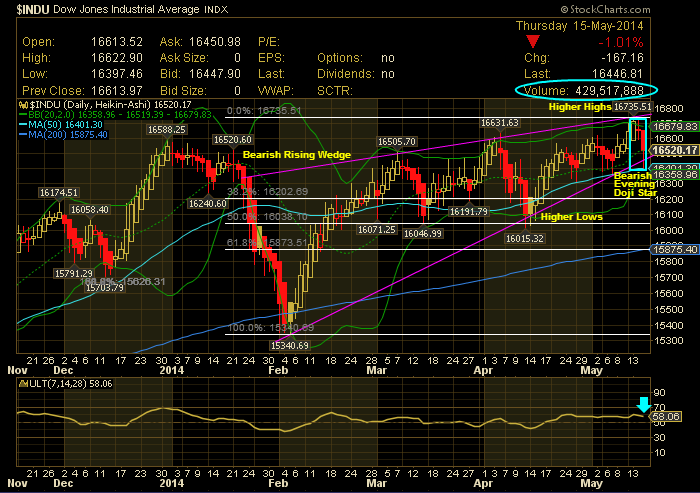 |
|
|
|
Post by stockpicker on May 23, 2014 5:47:46 GMT 7
The soft economy data on jobless claims and existing home sale last night slowed down the rally which started on Wednesday where we saw DOW jump more than 0.9%, outshining the bears who have taken DOW to hit the lower trend line support. Would the bulls be able to take DOW to hit its next target point A as shown in the attached chart? The chart suggested that it could be a difficult task as the trend is against it. Firstly there is not enough volume support; secondly, it is against the bear trend. Comparing the 2 situations as circled in the chart where both scenarios have the base-lines (brown) of ichimoku chart lifted to higher "grounds" but the conditions are not quite the same, the bears have a slight advantage at present. Unless and until FED can come out with something concrete affirming no interest rate hike or no more stimulate cuts ahead, whatever said or propagated by the FED or its officers would appear to be just a temporary blip on the chart and would not help DOW to reach target point A.  |
|
|
|
Post by stockpicker on May 23, 2014 7:32:18 GMT 7
Nothing is complete without analyzing the weekly chart. DOW's weekly is not looking as healthy as its daily chart. It is now showing the toppy which must be overcome before it can go higher. The weekly chart is clearly FED's stimulus driven although it does not seem obvious that the cut in stimulus has immediate effect in the market trend. One thing for sure, whatever said and whatever we read about the US economy will be useless about US market going up without FED coming with a firm statement indicating that it will not cut stimulus and will continue with its money easing policy.  |
|
|
|
Post by zuolun on May 24, 2014 16:53:43 GMT 7
The US investors are making a mockery out of the stock markets. The US stock markets are now almost at all time high, yet look at the CNNmoney's fear and greed indicator.. it has a reading of 44.. right in where it shows the market is in fear.. this must be some kind of a joke that the US investors are cracking or may be, the CNNmoney's fear and greed indicator is an utterly nonsense. money.cnn.com/data/fear-and-greed/?iid=EL — 23 May 2014 The VIX closed on at 11.36, its lowest level since Mar 2013. That means investors see less risk ahead, particularly with the S&P 500 ending at a record high again on Friday 23 May 2014. VIX — Falling Wedge Formation |
|
|
|
Post by stockpicker on May 29, 2014 6:13:56 GMT 7
US stocks have their rest day when the market was relatively quiet with indexes retreating after S&P hitting its highs on Tuesday. The intraday S&P was at another record high of 1914 but dropped back to close 1910 which indicated a weakness. All US major indexes, DOW, S&P and Nasdaq are showing the same result with the formation of bearish Harami, which might indicate a fall or correction is in the making and this short bull run is almost coming to an end. On DOW, one could identify that this bearish Harami is quite a strong one in which the bottom tail is quite short. It does mean that the bears have tested the low and the bulls were unable to pull it back as much because there wasn't enough bulls as was shown in the volume. It would look like a weak bull situation and the bears may want to take a "killing" in the coming days ahead, unless the economy and market conditions changed for the better. Take care.  |
|
|
|
Post by stockpicker on May 30, 2014 7:41:57 GMT 7
US stock market prefers to go sideways waiting for economic data..
The volume going lower and lower with index going higher or sideways indicating that this rally is not quite a healthy one.
|
|
|
|
Post by zuolun on May 30, 2014 7:55:44 GMT 7
|
|
|
|
Post by stockpicker on May 30, 2014 8:39:08 GMT 7
Thanks for sharing.. It should be known by now that the US economy data like GDP, unemployment rates, Consumer Price Index etc etc are just "decoration" or if one likes, "pretty dresses" to make a doll looking pretty. Not quite sure about GDP (quite sure they are hanky panky too), the unemployment rate for example exclude those who have given up looking for jobs and the Consumer Price index looks only at core CPI that do away with food and energy items which hit everyone's pocket. I would be more keen to look at the trade volumes of a bourse or a stock. This will be where they will have to put their money in their mouth. If the economy data is good, everyone will start buying. Only trick is to know when BBs are tradings and if they are moving singly or in a group, it will also push up and down the volume and these cunning foxes are so tricky that it is not always successful using trade volume to buy a particular stock. But one BB trade that has never quite change over the years is the "zombie sale" due to margin calls that has no feeling about losses; many small retailers are catching these falling knives now as we are seeing quite a lot of them recently in a lot of SGX stocks.. and some of them were good too in catching these knives.. whether it is really wise to do it every time is another matter. |
|
|
|
Post by stockpicker on May 30, 2014 9:24:24 GMT 7
Someone in some forum said that the World's financial fiasco is cooling down by reading the US 10-year treasury yield that has dropped from over 3% few months ago to the present 2.46%. Is that the scenario? This monthly chart has a story.. The yield after hitting 1.46% in Jan 2012 has risen to 3% in 2 years and now rests on the support of 2.466.. waiting. This yield has broken the trend line that have enclosed it since 2007, which is about 7 years ago. It may test the 2.224 support and if it reflects from these supports, beware of the consequences ahead..  |
|
|
|
Post by stockpicker on May 31, 2014 7:32:08 GMT 7
The Commerce Department said on Friday that the consumer spending dipped 0.1 percent, which was the first decline since April 2013. The details also reflected that the inflation has finally crept up in the US. A separate report showed consumer sentiment slipped also in May as households worried about the income. However, these are all treated as temporary events by the traders as the US dipped in early hours of the trade and slowly picked up steam with DOW ending the Friday session at an all time high of 16717 or 18 points up. However, technically, it is not too good a picture. DOW formed a hangman pattern while it is near the top of the Bollinger band indicating some degree of over-bought. This bring up the possibility that the bears are beginning to doubt that this rally can continue. They sent DOW down 50 points at the start but the bulls could only pull it back slowly over the day until it closed 18 points above Thursday's close. As usual, candlestick pattern cannot always be interpreted with just one candle. The trend can only be confirmed if there is a down candle the next trading day. Better if a series of downward candles breaching the open price of Thursday's candle at 16,637.  |
|
|
|
Post by stockpicker on Jun 4, 2014 7:59:51 GMT 7
Another day, another hanging man pattern appears. This one slightly different. It is coupled with a harami which could make it a double whammy. But again, this will have to be confirmed.. DOW was up last few days because Draghi continuingly spoke about having the notion to cut interest rate further to support the growth in Euro Area. However, the US inflation rate has approached 2.0% last month and yielded the expectation that US interest rate will rise sooner or less unless they can arrest the further rise in the inflation rate.  |
|
|
|
Post by stockpicker on Jun 4, 2014 9:43:14 GMT 7
The weekly DOW chart has showed little sign of unrest when it broke the resistance and now put DOW in the path of a rising channel as shown in the attached. The only weakness is shown in the trading volume where volume has been falling with respect to the rising price. However, it has always been the case before and many a time, a weak volume supports a rising trend. It is good to see how DOW would develop in the coming weeks.  |
|
|
|
Post by stockpicker on Jun 6, 2014 6:05:57 GMT 7
ECB cut its interest rate yesterday. This monetary easing at work again pushed US indexes to make yet another high last night with DOW reaching another record and remarkable high to close at 16,836. This is despite of the lower expectation that the payroll report will not be exceptionally good and the unemployment rate may tick up come Friday. Again, it tells that "opium" is always a wonderful and amazing drug. finance.yahoo.com/news/wall-street-opens-ecb-rate-133817050.html?l=1 |
|
|
|
Post by zuolun on Jun 6, 2014 7:46:42 GMT 7
|
|