|
|
Post by stockpicker on May 1, 2014 6:04:58 GMT 7
Yellen cut stimulus the 4th time by another $10b, now to only $45b per month and the market... surprise surprise.. DOW broke all time high to 16,580 and the fear and greed indicator? Go lower from 55 yesterday to now 53, indicating the market has more fear now than before. stockcharts.com/h-sc/ui?s=$INDU&p=D&yr=0&mn=6&dy=0&id=p21663103360money.cnn.com/data/fear-and-greed/Yellen was convinced that the US economy is in the mend as the economy shakes off the winter doldrums. This announcement was made despite of the poor GDP growth of 0.1% which is much less than expected. Technically, DOW still look bullish although last night's break of all time high was done at low volume which does not show its determination to cross the resistance. With the fear and greed indicator not showing much support, it is doubtful if this rally will last.. but who knows, it may just spring a surprise on everyone.. this is how market works especially when the volume is low.. |
|
|
|
Post by zuolun on May 1, 2014 10:58:16 GMT 7
The DJ is running on autopilot without emotions; after hitting every record high with a slight pullback, the default setting will trigger a higher high. DJ — A potential blue-sky breakout; TP 17,500DJ closed with an inverted hammer @ 16,580.84 (+45.47, + 0.27%) on 30 Apr 2014. Immediate resistance @ 16,588, strong resistance @ 16,631, immediate support @ 16,324, strong support @ 16,240. 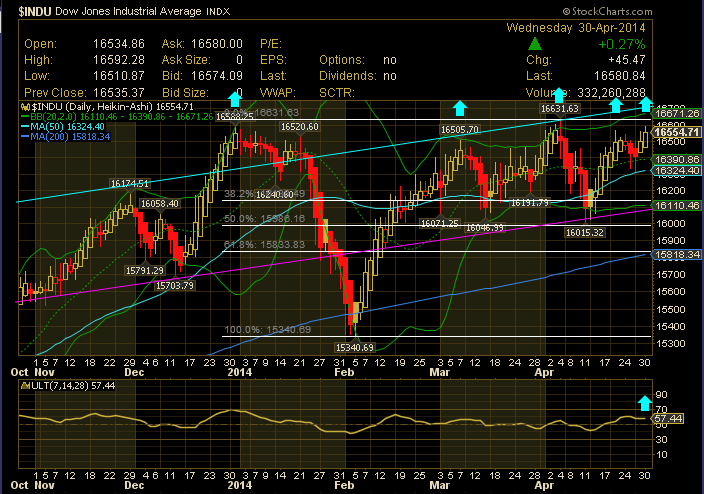 DOW Industrials DIA ETF Pushing Up To Highs DOW Industrials DIA ETF Pushing Up To Highs — 29 Apr 2014. |
|
|
|
Post by stockpicker on May 2, 2014 23:16:49 GMT 7
The US has a good employment report. The unemployment now has gone down to 6.3% from 6.6% in March. The payroll increase was 288K, much better than expected. Before we start celebrating that the US economy has finally recovered, lets examine one more report, that is US's labor participation rate.. and this rate has gone down from 66% to 63% in April. This is 35 years low. What does all these mean. Should the market be celebrating?
The answer is no.. The unemployment rate actually accounted those who are out of work but are still seeking jobs and labor participation rate does the opposite. It discounts them as they are not working...
Now which is more important? From the market point of view, the unemployment rate is more important because it has the element of "hope" and market has always been working based on "hope". These "unemployed" seeking jobs would have "hopes" to rejoin the market force. But is the US economy going to get better? Judging from the constant falling of labor participation rate, there is a cause of alarm that the new job created are not enough to fill up those who have left the labor forces. Will the labor participation rate improve in future? Yes, it will when there is enough new jobs created. The other way is to import more foreign labors and US is now seriously thinking about it. But one thing for sure, those existings who cannot find a job will never be able to join the work force again. The citizens will grumble like we have grumbled before in Singapore. Is this good for the country? This, we can argue until kingdom come and Singapore is now facing the dilemma. May be US can learn it from us. LOL
|
|
|
|
Post by stockpicker on May 4, 2014 20:34:40 GMT 7
It is good to track from now the NYSE's debt margin which shows a sudden decline of $15bil from $465bil to $450 bil for the Month of March 2014. www.nyxdata.com/nysedata/asp/factbook/viewer_edition.asp?mode=table&key=3153&category=8Margin debt is aka a "loan" borrowed from stockbrokers to buy stocks.. when stock price go below certain margin level, the investors will be asked to top up a difference in the margins. On the event that investors failed, the brokers will "force sell" the stocks and recover the "loan". This margin debt will spike when the investors are greedy and starts buying stock using margins and will fall sharply when there are margin calls and investor cannot top up the margin differences Recently, this margin debt in NYSE has spiked again like it were in 2000, the dot.com bubble and in 2007, the credit crisis. The market is now speculating a spike detected in Jan/Feb 2014 is signaling another market crisis to come. However, whether this crisis will come or not is still unknown. The market is presently at its all time high. The investors appear to suffer little stress as the market did not show any sign except for fear shown in CNBC's fear and greed indicator which is now 28, a record low. 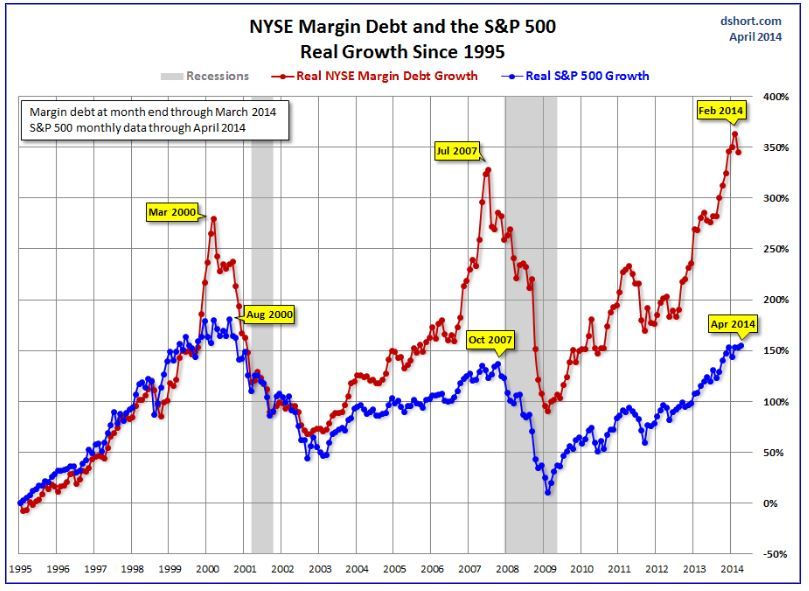 |
|
|
|
Post by stockpicker on May 9, 2014 16:50:26 GMT 7
Last night, DOW rallied and broke all time high when the jobless claims turned better and Yellen came out to testify about US economy was looking good. At one stage, DOW went up to 16,623.. but this conquering of the new high was defeated soon by fear as bad news started to emerge.. It was reported that U.S.-based mutual funds pulled $3.9 billion out of stock funds in the week ended April 30 and this outflows from stock funds were the biggest since investors pulled $4.9 billion out of the funds roughly a year earlier over the week ended May 1, 2013. Also, bond funds attracted $931 million in inflows over the latest week raising fear that market is not as bullish as it looks. Chartwise, though DOW did not form any pattern that one can predict where it would go next, the pull back formed a long tail short candlestick which signified fears in the market. The CNBC fear and greed indicator showed 29, which is not looking good money.cnn.com/data/fear-and-greed/The next few days would be the trying days where DOW will test the supports and when they fail to hold, we might see some catastrophic movements from DOW. 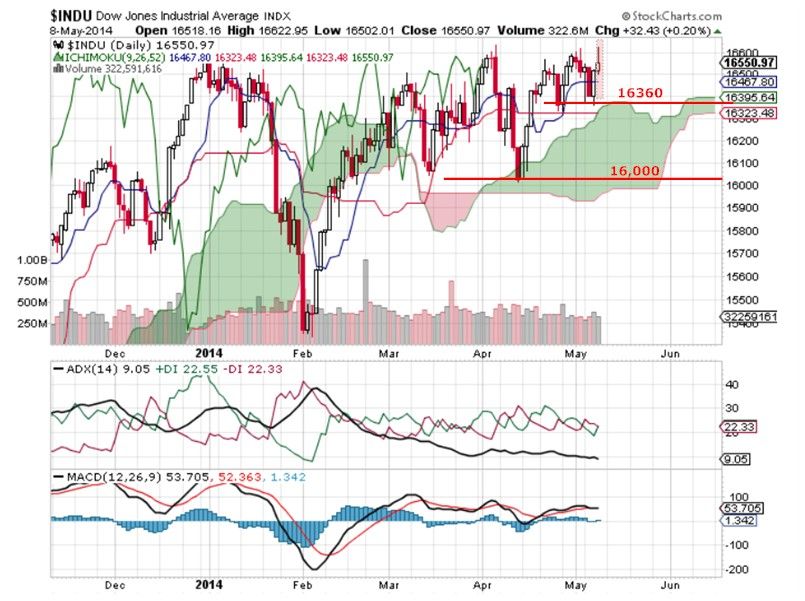 |
|
|
|
Post by zuolun on May 9, 2014 17:17:31 GMT 7
The DJ is running on autopilot without emotions; after hitting every record high with a slight pullback, the default setting will trigger a higher high. On 8 May 2014, it was the 6th attempt the DJ tried poking the strong resistance @ 16,631 to hit record high of 16,693.39 but closed lower at 16,550.97. The DJ is well-supported by the 50d SMA and it has been trading at the upper bollinger bands indicating bullishness; the only -ve signal is that, the extremely thin trading volume is not convincing. DJ — A potential blue-sky breakout; TP 17,500DJ closed with an inverted hammer @ 16,550.97 (+32.43, + 0.2%) on 8 May 2014. Immediate resistance @ 16,588, strong resistance @ 16,631, immediate support @ 16,367, strong support @ 16,240. 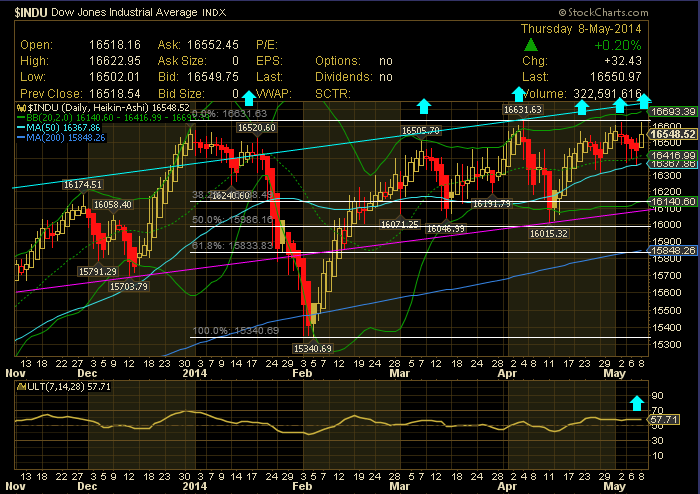 |
|
|
|
Post by zuolun on May 10, 2014 7:41:52 GMT 7
DJ — A potential blue-sky breakout; TP 17,500DJ closed with an inverted hammer @ 16,583.34 (+32.37, + 0.2%) on 9 May 2014. Immediate resistance @ 16,588, strong resistance @ 16,631, immediate support @ 16,374, strong support @ 16,240. 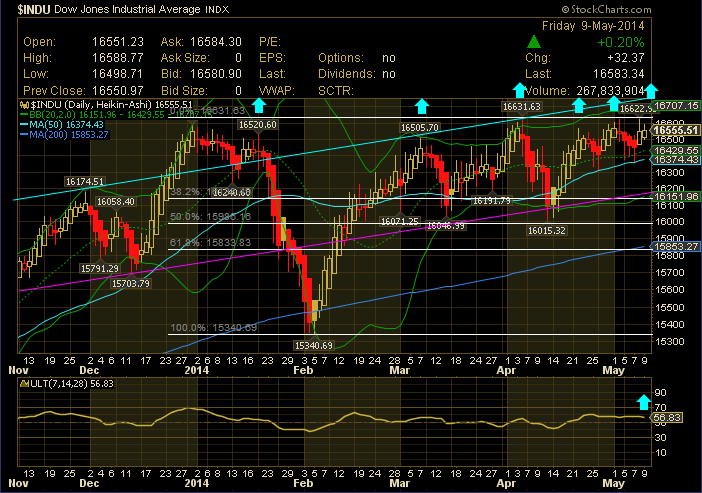
|
|
|
|
Post by stockpicker on May 10, 2014 8:09:21 GMT 7
From this superimposed chart of DOW and CNBC's fear and greed indicator, one can see that there is a clear divergence developing between the 2 indicators which has never experienced before. This divergence trend started in mid-2013 with the investors fearing and the market kept going up. This is definitely not a very healthy sign. Marc Faber, the publisher of The Gloom, Boom & Doom, recently said in a CNBC interview that he feared this financial crisis, developing in second half of 2014, is going to be worst than 2008. www.realclear.com/markets/2014/05/08/faber_im_worried_about_a_crisis_bigger_than_2008_6926.htmlOn the hand, Roubini is expecting a war to break out between Russia and Ukraine with a probability of 7 in a scale between 1 to 10 that the situation will escalate. www.realclear.com/markets/2014/04/28/roubini_whats_worrying_me_6775.html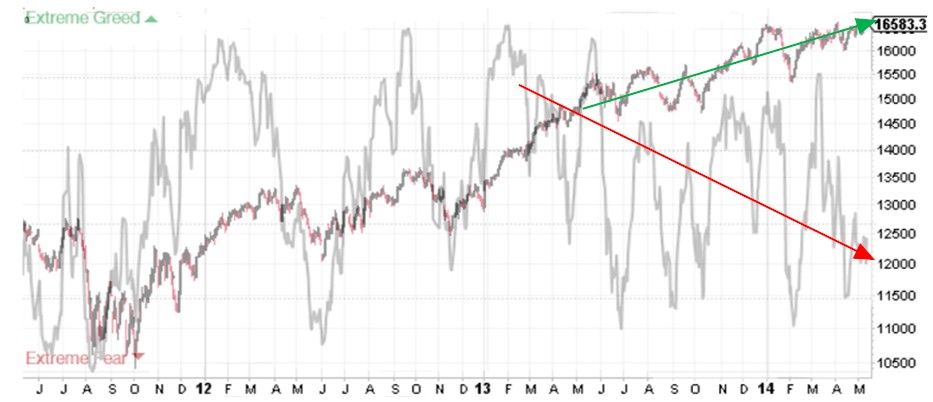 |
|
|
|
Post by zuolun on May 13, 2014 8:21:45 GMT 7
 The DJ is running on autopilot without emotions; after hitting every record high with a slight pullback, the default setting will trigger a higher high. On 12 May 2014, the DJ broke the last high @ 16,631 and closed at fresh record high @ 16,695.47. The DJ is well-supported by the 50d SMA and trading at the upper bollinger bands indicating bullishness. However, the extremely strong up-move has not been accompanied by strong trading volume and it's forming a bearish rising wedge pattern with higher highs and higher lows. This bearish price volume divergence is a clear -ve signal indicating that the up-move is a bull trap set up, expect a nasty sell-off. DJ — A potential blue-sky breakout; TP 17,500DJ closed with an inverted hammer @ 16,695.47 (+112.13, +0.68%) on 12 May 2014. Immediate resistance @ 16,703, immediate support @ 16,381. 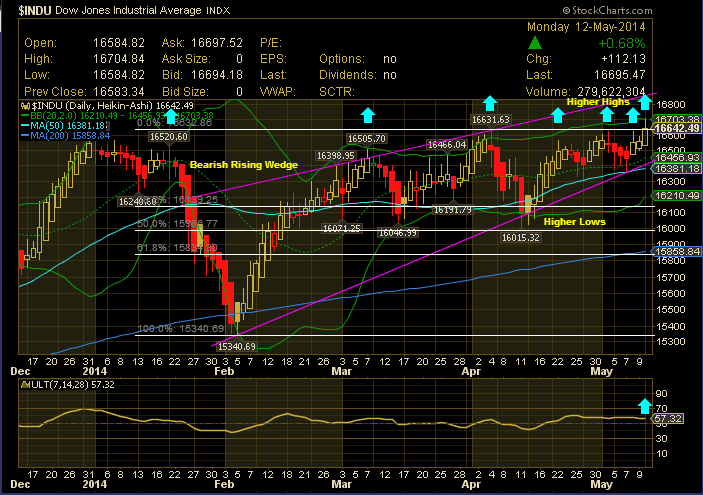 |
|
|
|
Post by zuolun on May 13, 2014 17:08:00 GMT 7
|
|
|
|
Post by zuolun on May 15, 2014 8:35:04 GMT 7
 The DJ is running on autopilot without emotions; after hitting every record high with a slight pullback, the default setting will trigger a higher high. On 13 May 2014, the DJ hit new record high @ 16,735.51. The DJ is well-supported by the 50d SMA and trading at the upper bollinger bands indicating bullishness. However, the extremely strong up-move has not been accompanied by strong trading volume and it's forming a bearish rising wedge pattern with higher highs and higher lows. This bearish price volume divergence is a clear -ve signal indicating that the up-move is a bull trap set up, expect a nasty sell-off. DJ — A potential blue-sky breakout; TP 17,500DJ closed with a bearish harami cross @ 16,613.97 (-101.47, -0.61%) on 14 May 2014. Immediate resistance @ 16,703, immediate support @ 16,398. 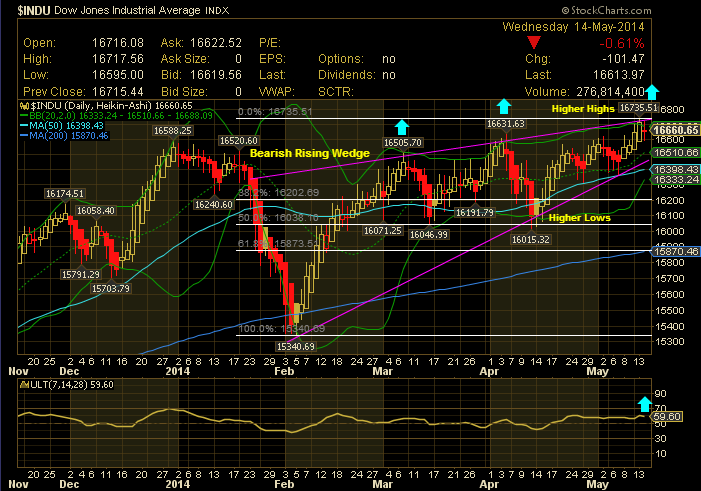 [/quote] |
|
|
|
Post by stockpicker on May 16, 2014 6:21:41 GMT 7
A beautiful set of economic figure haven't seen for a long time with jobless claim down, consumer spending up and manufacturers' sale up but the market wasn't smiling because Wal-Mart, the biggest store, announced earlier with dismayed profits.. the market took the plunge when the market opened and slashed about 167 points or just over 1.0 %. Technically, DOW sought a support at a intermediate trendline within a rising wedge where DOW is almost at the tip of the wedge. All indicators are not looking as rosy and DOW will face a sell down if DOW could not find support at the bottom of the rising wedge which is about 70 points away. Judging from what was happening today with market plunged when economical figures were looking good, it would appear that there was a certain fear either because FED might further cut and pull out its stimulus by the end of this year or the market has been overly stretched, requiring some corrections. The fear would be subsided soon if DOW could rebounce when it hit the bottom of the rising wedge. 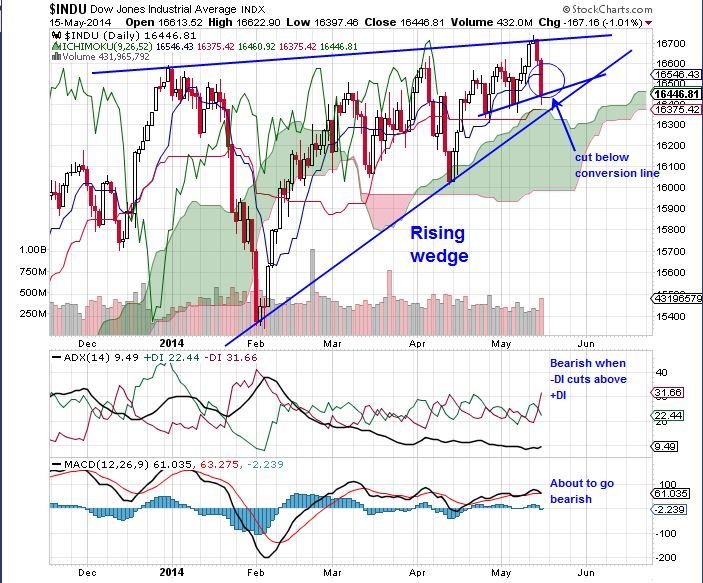 |
|
|
|
Post by zuolun on May 16, 2014 6:51:06 GMT 7
 DJ — Bearish Major Short-Term Trend Reversal; expect a nasty sell-off DJ — Bearish Major Short-Term Trend Reversal; expect a nasty sell-offDJ closed with a bearish evening doji star @ 16,446.81 (-167.16, -1.01%) with a sudden spike in trading volume on 15 May 2014. Immediate resistance @ 16,520, critical support @ 16,401, the 50d SMA. 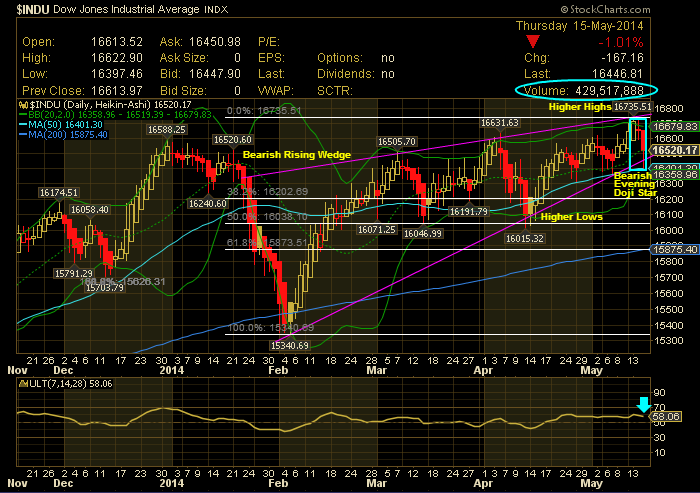 |
|
|
|
Post by stockpicker on May 17, 2014 6:45:34 GMT 7
There were no significant change in the news apart from a drop in consumer confidence which most investors do not pay much attention. May be encouraged by the better housing start etc, DOW closed up 44 points or about 0.27% flat and the Treasury's panic buying has stopped. Technically, DOW rebounced from the lower intermediate trendline that it had found support on Thursday. With that rebounce, it formed a bullish harami which signifies a rebounce is at sight particular when it was done at a volume higher than the average as some investors, who shorted on Thursday, could have covered their shorts. However, at this height, a rebounce cannot be ensured as there were still plenty of fear abounding and the bears have just raised their heads; in other words, this rebounce might be just a temporary reaction, especially when it was formed at the bottom of the last candlestick. The rebounce would need to be confirmed by either a long white or a series of short candlesticks that will close above the last long red candlestick. 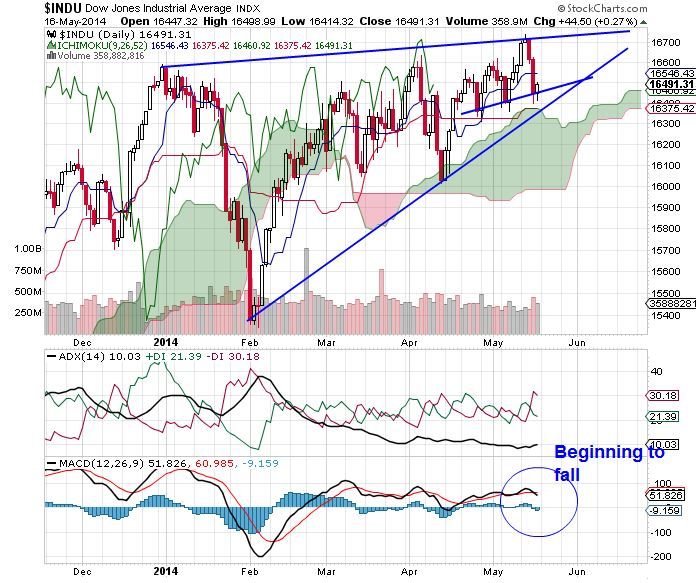 |
|
|
|
Post by zuolun on May 17, 2014 19:57:18 GMT 7
|
|


