|
|
Post by zuolun on Jan 15, 2014 14:47:49 GMT 7
|
|
|
|
Post by stockpicker on Jan 18, 2014 6:37:05 GMT 7
|
|
|
|
Post by candy188 on Jan 18, 2014 9:28:48 GMT 7
This sounds scary.  However, we need to recognise that it is part of a natural stock market process that what go up will ultimately come down one day.  Oldman summed up the strategy one should consider: "Now, there is a real risk of a market collapse just beyond the horizon. No one knows when this will happen but we know that it will surely happen. I think the big money will prevent this from happening anytime soon. Hence, I think we still have a year or two before we see the collapse of the stock market.
During this period, we have to be nimble and we should try to set aside as much cash as we can. This cash can then be used in the next cycle... as the best picks are in the early part of the cycle and this is where we can make the most money. This is also the time when most folks will not have much money and there will be lots of good bargains to be found. But, you need money to buy stocks during this sale period.
Hence, it is important to Start SAVING EARLY for this mother of all sales."
pertama.freeforums.net/thread/82/investment-clock#ixzz2qiEf5Pf9 |
|
|
|
Post by zuolun on Jan 19, 2014 11:05:05 GMT 7
|
|
|
|
Post by zuolun on Jan 19, 2014 12:36:09 GMT 7
|
|
|
|
Post by zuolun on Jan 19, 2014 12:51:38 GMT 7
|
|
|
|
Post by zuolun on Jan 20, 2014 14:32:56 GMT 7
JIM ROGERS - When Will They STOP PRINTING FIAT CURRENCY? — 18 Jan 2014
The World in Chaos by Tim Rifat — 15 Jan 2014
|
|
|
|
Post by stockpicker on Jan 22, 2014 14:16:33 GMT 7
As expected, DOW has been going sideways since early Jan 2014 after the initial drop. It will continue to do so because VIX's 20-day just reflected from the 200-day as shown in the attached chart. The 50-day is also heading down which indicate a bullish US market; however, the market indexes did not take off because there was not enough "escape velocity" as many analysts put it that way. It would appear that this "bullishness" is numbered now that the -IDX of VIX is about to cross above +IDX, indicating a bullish VIX to come which means a bearish US stock market in near future. It is not known how bullish VIX will be until VIX started to cross above the trendline that has been suppressing it so far. There is still no sign of any significant movement in US markets. 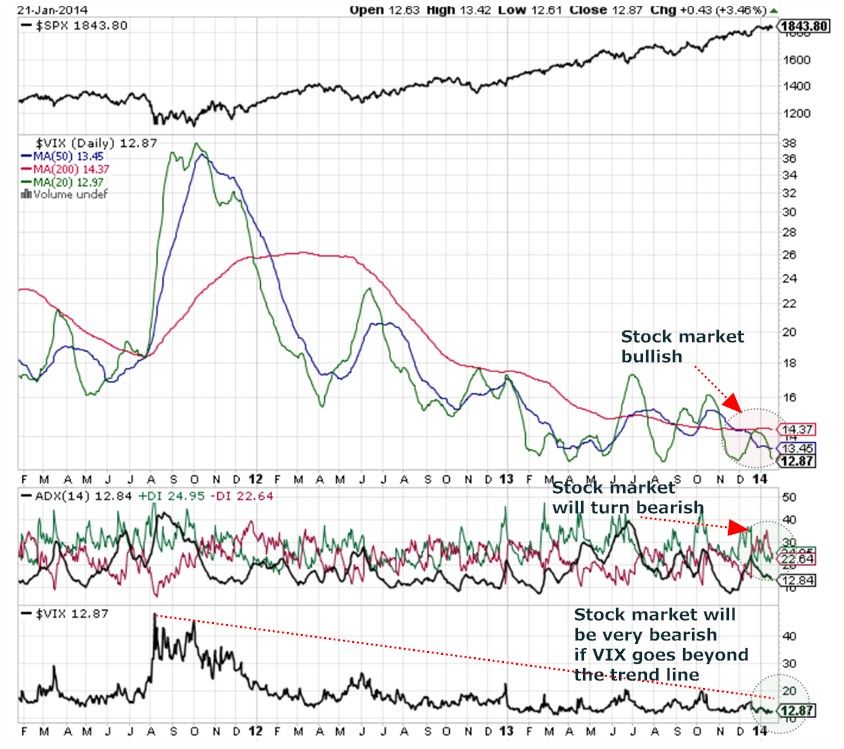 |
|
|
|
Post by zuolun on Jan 23, 2014 8:28:14 GMT 7
|
|
|
|
Post by zuolun on Jan 23, 2014 17:18:46 GMT 7
Summary of Taleb's Black Swan
Nassim Nicholas Taleb - The Black Swan: The Impact of the Highly Improbable
|
|
|
|
Post by stockpicker on Jan 24, 2014 8:15:05 GMT 7
BDI is always very volatile, it can go up as high as 6,000 and gets below 500 all in a matter of months. Once it is bearish, it will continue so until years later. This is because there is a lead time of about 2 years to construct a ship. By the time they found that there is a shortage of shipping supply, it would take easily about 1.5 years to ease the situation and vice versa. Unlike building properties where one can build and hold, ship rots and depreciates quickly. The present BDI looks very bad and will remain so until many months later..This particular chart showed a double top and a rebounce from 200 MA which is interesting.. may be due to speculation or something.. just like stocks 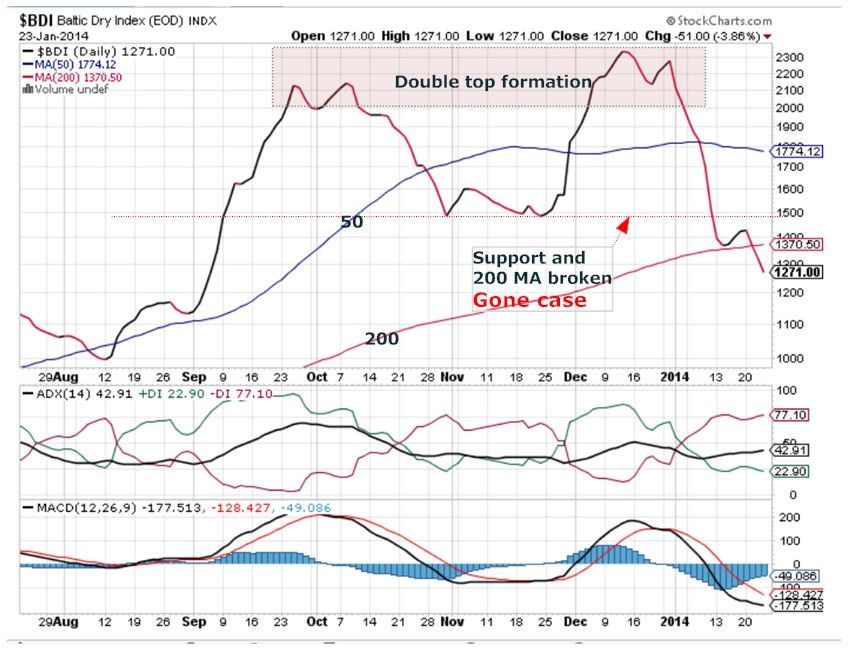 |
|
|
|
Post by zuolun on Jan 26, 2014 0:12:56 GMT 7
|
|
|
|
Post by om on Jan 26, 2014 12:57:23 GMT 7
|
|
|
|
Post by stockpicker on Jan 27, 2014 11:06:29 GMT 7
|
|
|
|
Post by stockpicker on Jan 27, 2014 16:39:05 GMT 7
Take note of the divergences between DOW's transportation and the commodity indexes. It will have to converge one day or another. When that day comes, either the commodity index will rise or the transportation index will fall to meet each other. We shall see a lot of things happening that will include big changes in DJI and other World Indexes.
|
|


