|
|
Post by zuolun on Jul 26, 2014 23:33:18 GMT 7
Forterra and Interra: Chart Pattern — The impulsive 5-Wave up is completed, riding on the corrective 3-Wave down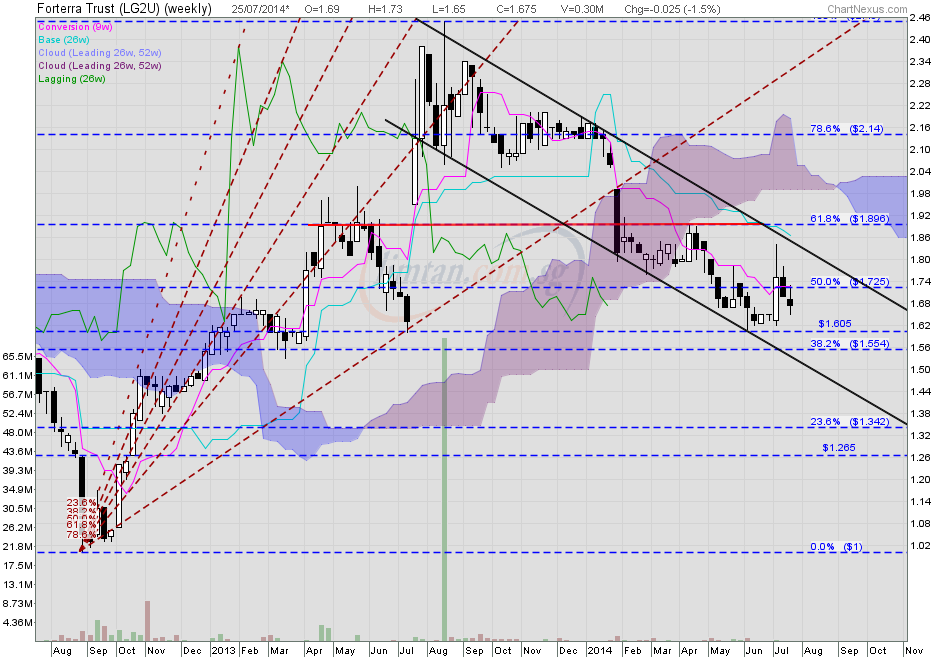 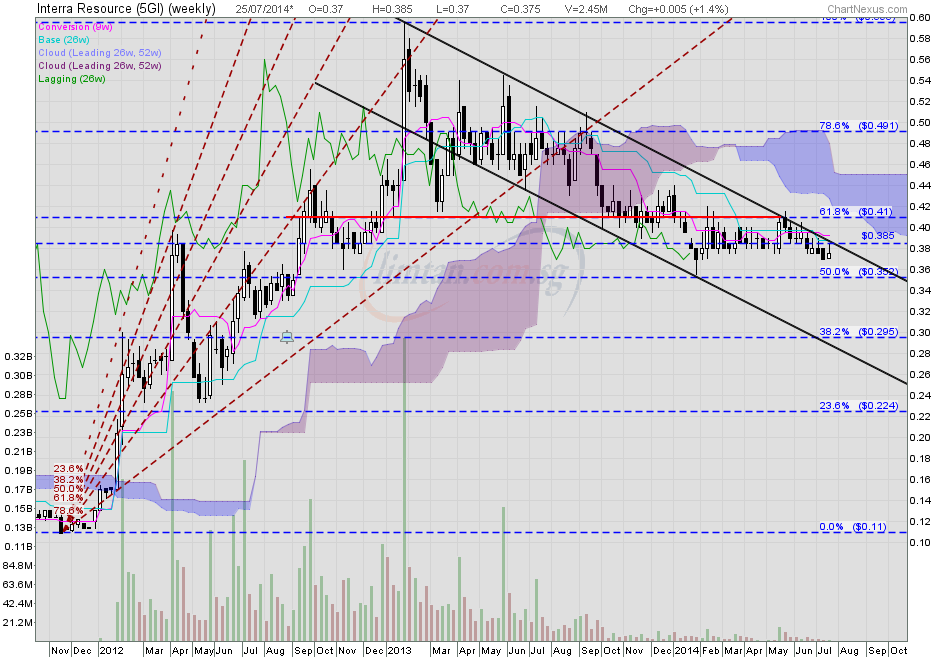
|
|
|
|
Post by zuolun on Jul 31, 2014 10:18:42 GMT 7
MTQ and Oxley: Chart Pattern — Hit Key support level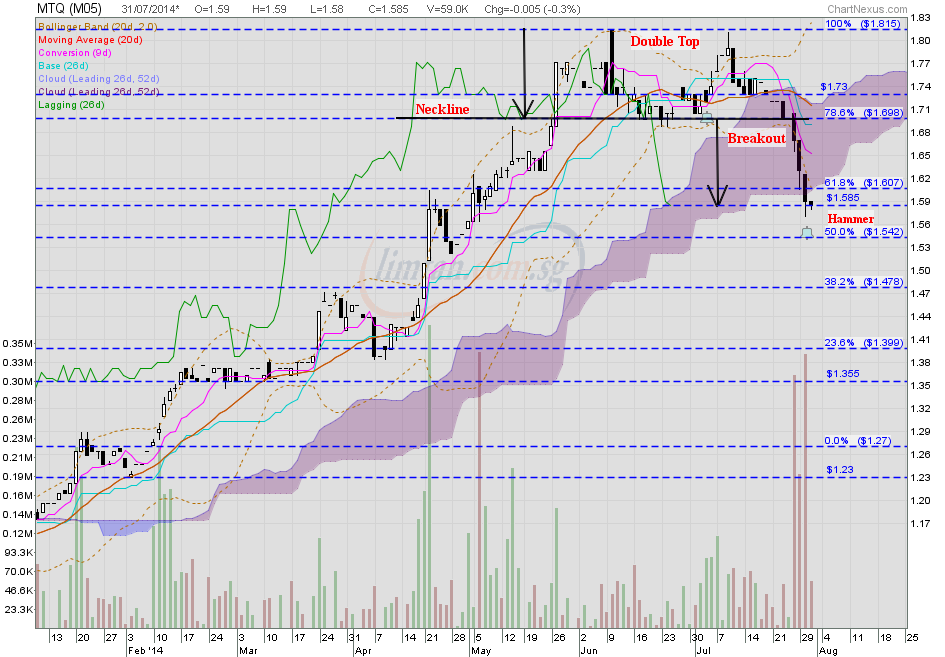 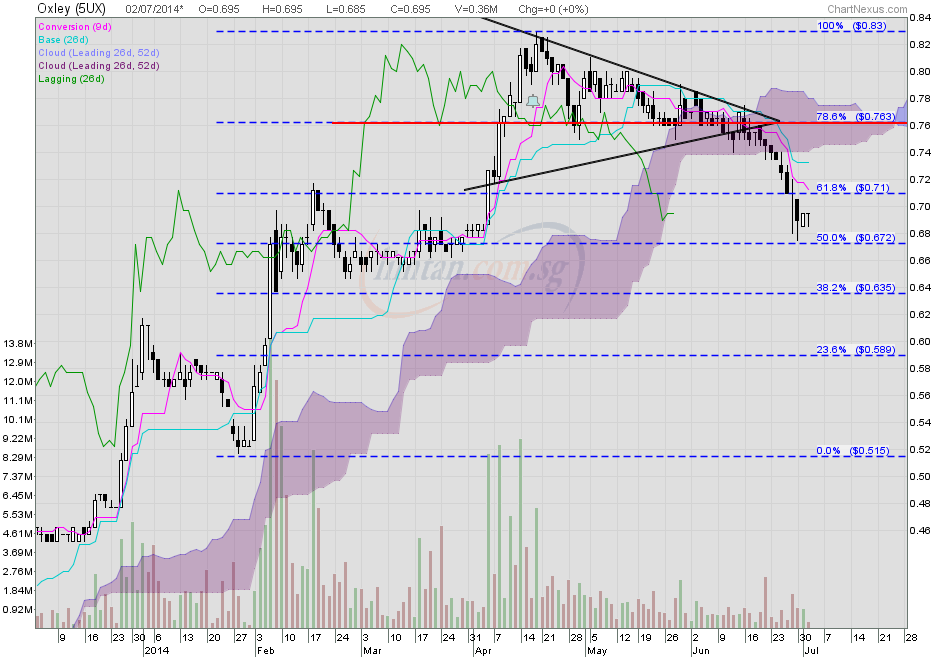
|
|
|
|
Post by zuolun on Jul 31, 2014 10:29:04 GMT 7
One of the Elliott Wave rules stated that Wave-3 cannot be the shortest wave. - Rule 1: Wave 2 cannot retrace more than 100% of Wave 1.
- Rule 2: Wave 3 can never be the shortest of the three impulse waves.
- Rule 3: Wave 4 can never overlap Wave 1.
Usually for commodities, Wave-5 will be the longest wave; while for stocks, Wave-3 will be the longest wave and a minimum target for Wave-5 is 100% of Wave-1.  MTQ and SuperGroup: Chart Pattern — Completed the 5-wave impulsive up, riding on the 3-wave corrective down MTQ and SuperGroup: Chart Pattern — Completed the 5-wave impulsive up, riding on the 3-wave corrective down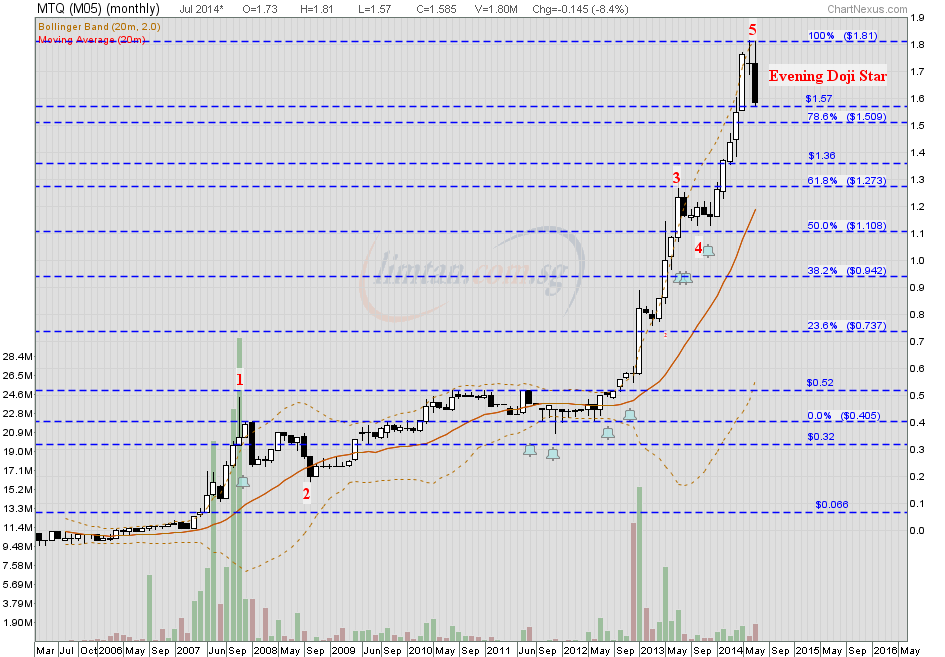  |
|
|
|
Post by zuolun on Jul 31, 2014 12:21:40 GMT 7
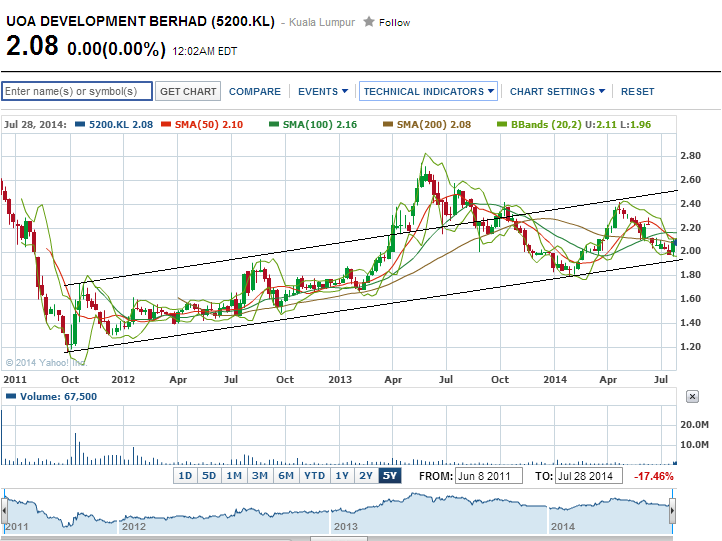
Certain IPOs had corrective waves 1st or below its IPO price, then followed by impulsive waves later - UOA — Hit a record low @ RM1.11, below its IPO price @ RM2.60, listed date on 08 Jun 2011.
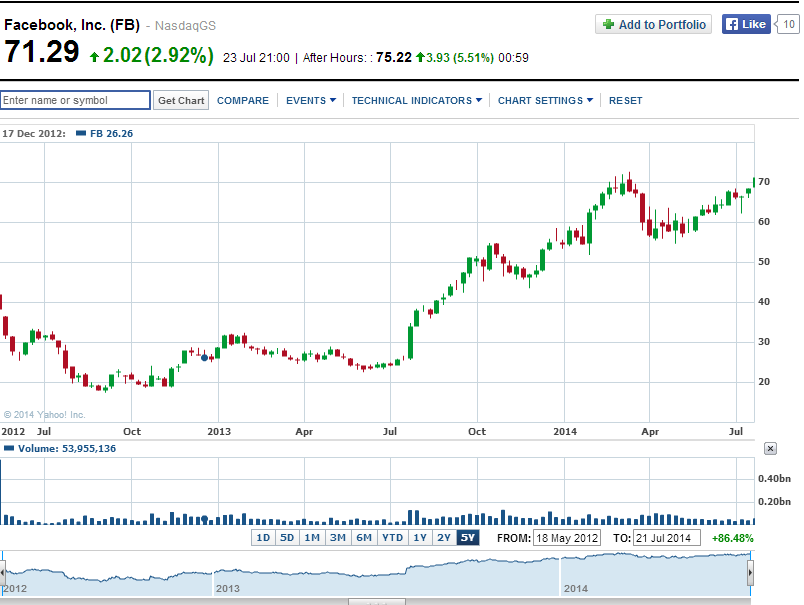
- Facebook — Hit a record low @ US$17.55, below its IPO price @ US$38, listed date on 18 May 2012.
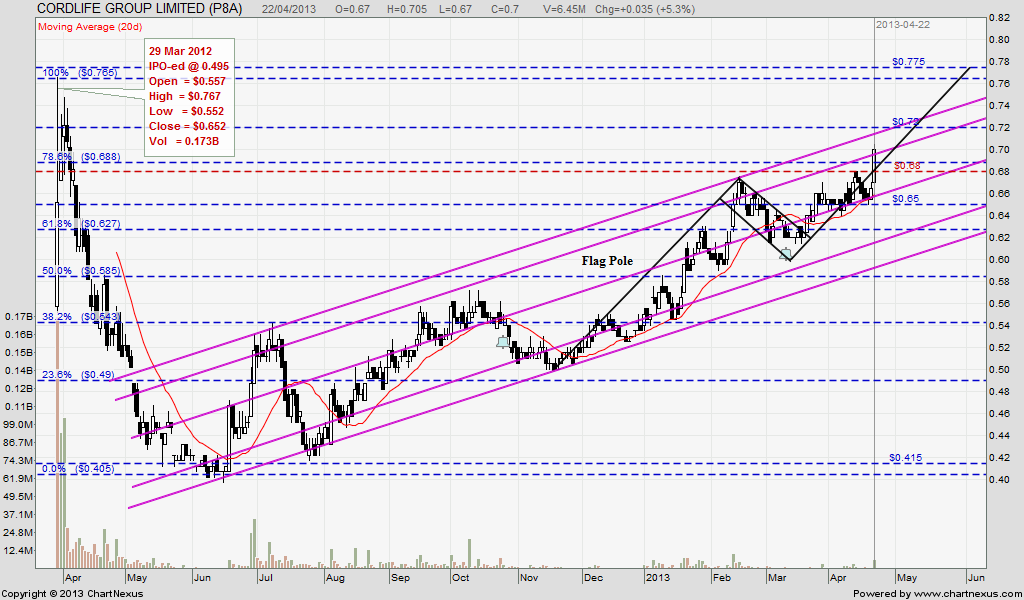
- Cordlife — Hit a record low @ S$0.405, below its IPO price @ S$0.495, listed date on 29 Mar 2012.
|
|
|
|
Post by zuolun on Aug 4, 2014 8:23:23 GMT 7
DJ, STI, UOB and Singtel: Chart Pattern — H&S Formation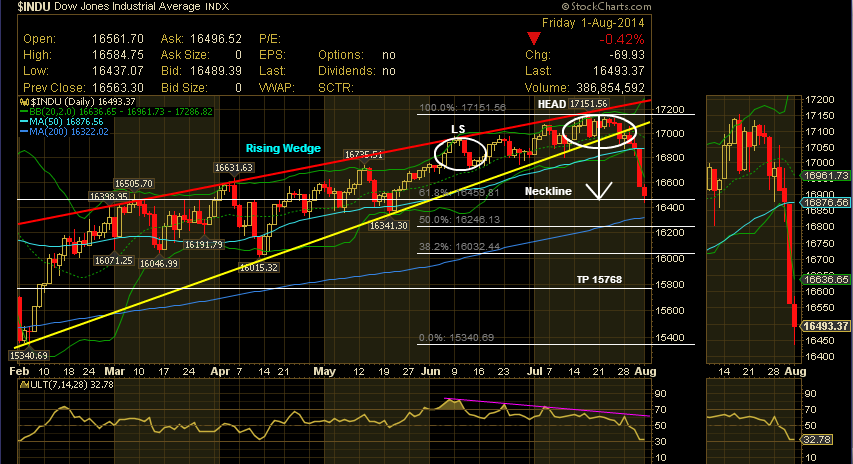 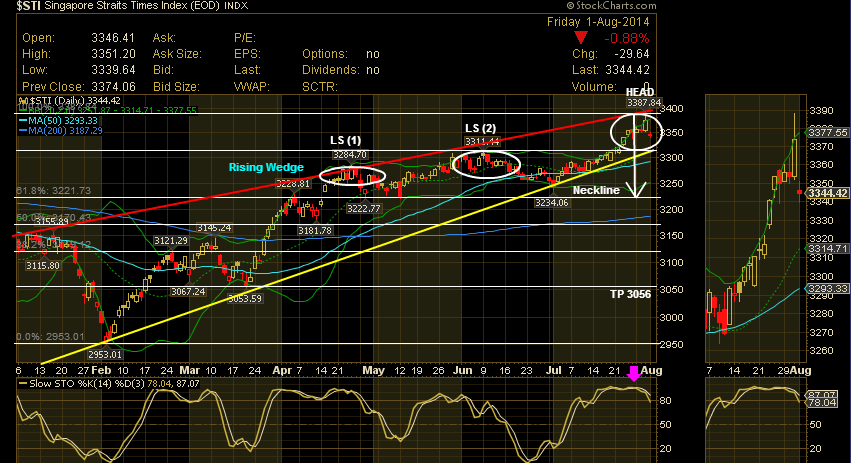 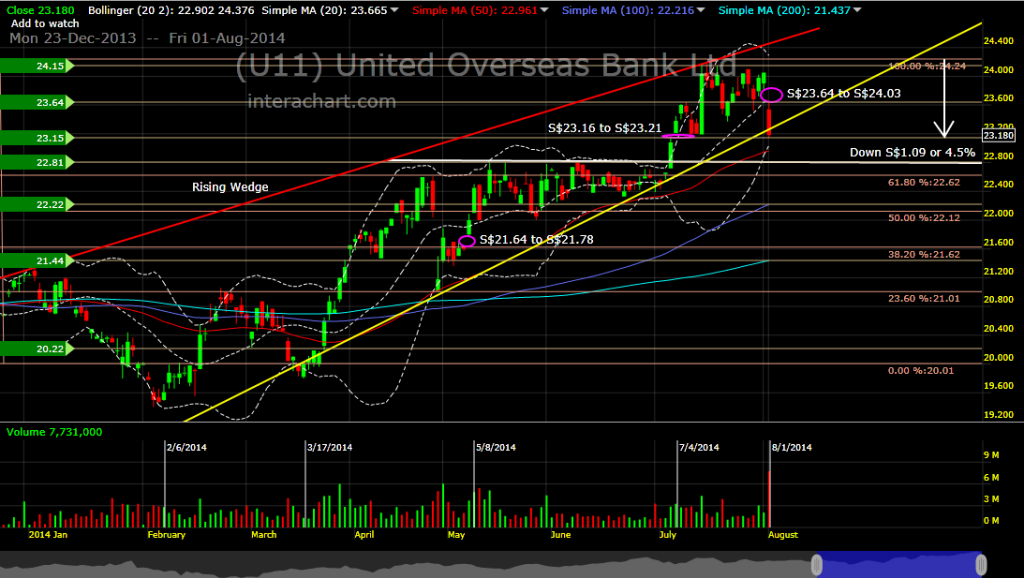 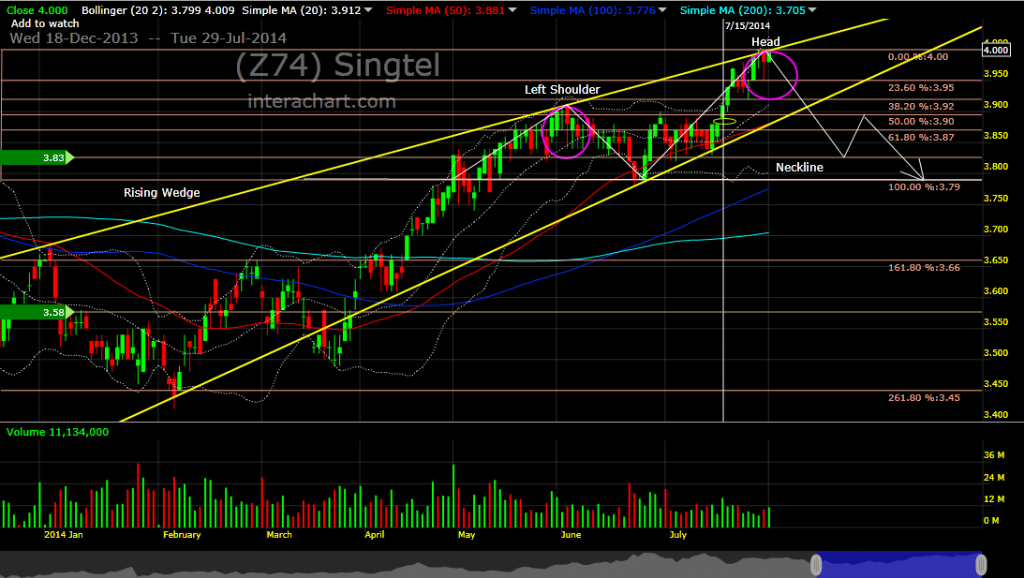
|
|
|
|
Post by zuolun on Aug 5, 2014 17:54:10 GMT 7
DJ, STI, UOB, Singtel and GLP: Chart Pattern — H&S Formation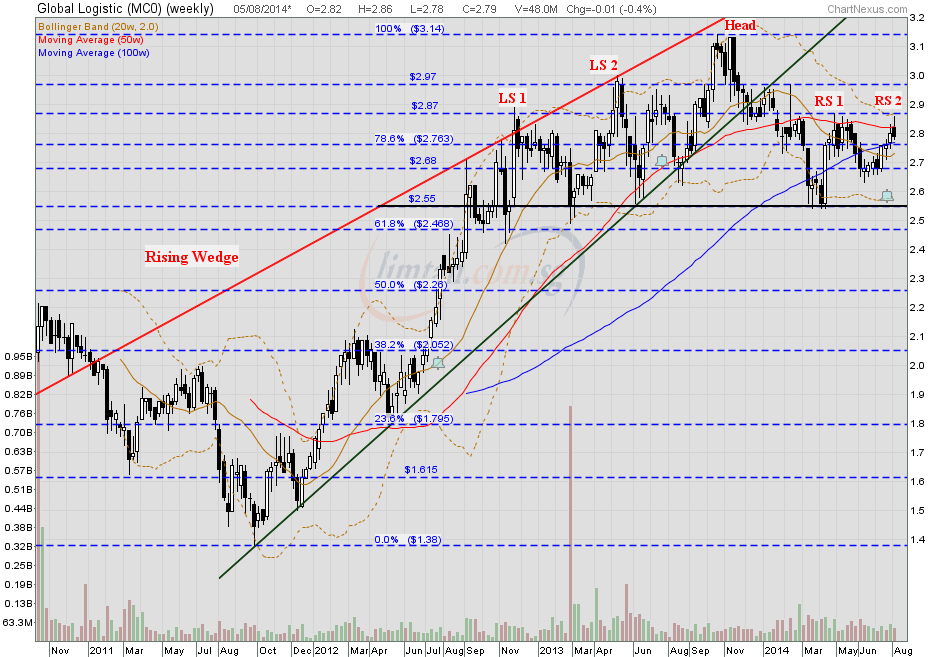
|
|
|
|
Post by zuolun on Aug 7, 2014 8:40:09 GMT 7
SIA Engg (Aug 2014) Vs. KepCorp (Aug 2011)Chart Pattern Observations: 1. Dead cat bounce after a climatic sell-off or extremely high volume sell-off followed by low volume dead cat bounce. 2. Price volume action; share price up a little bit then continues to plunge more. 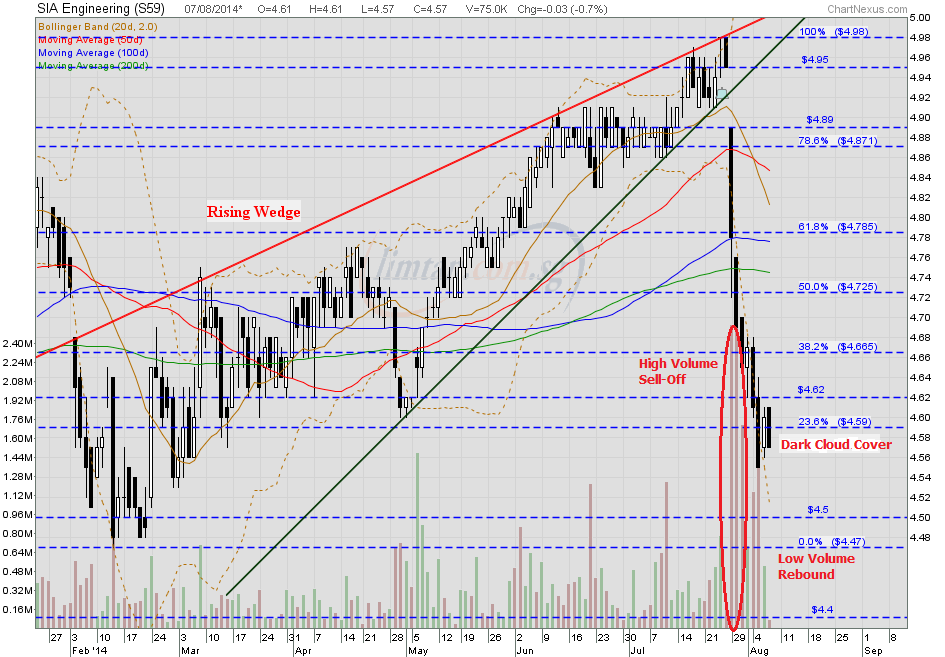 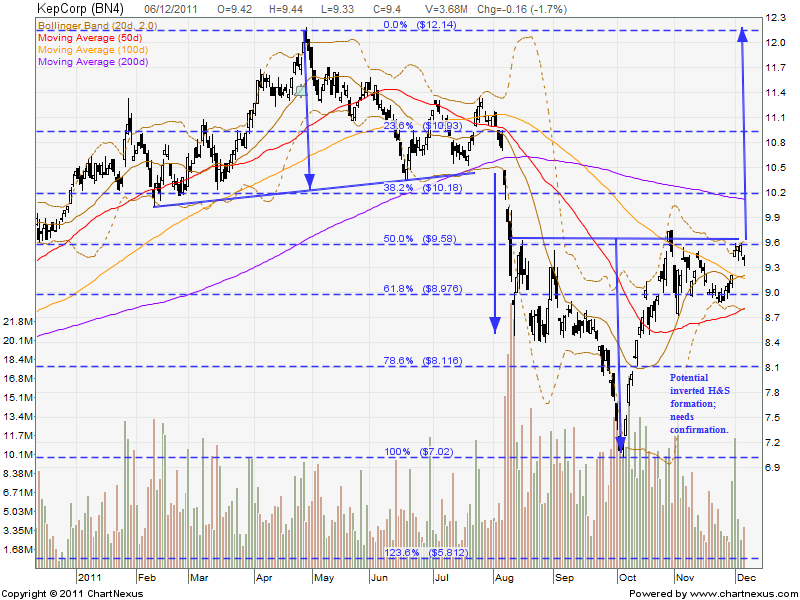
|
|
|
|
Post by zuolun on Aug 7, 2014 18:25:16 GMT 7
Biosensors and Swiber: Chart Pattern — Bearish Symmetrical Triangle Breakout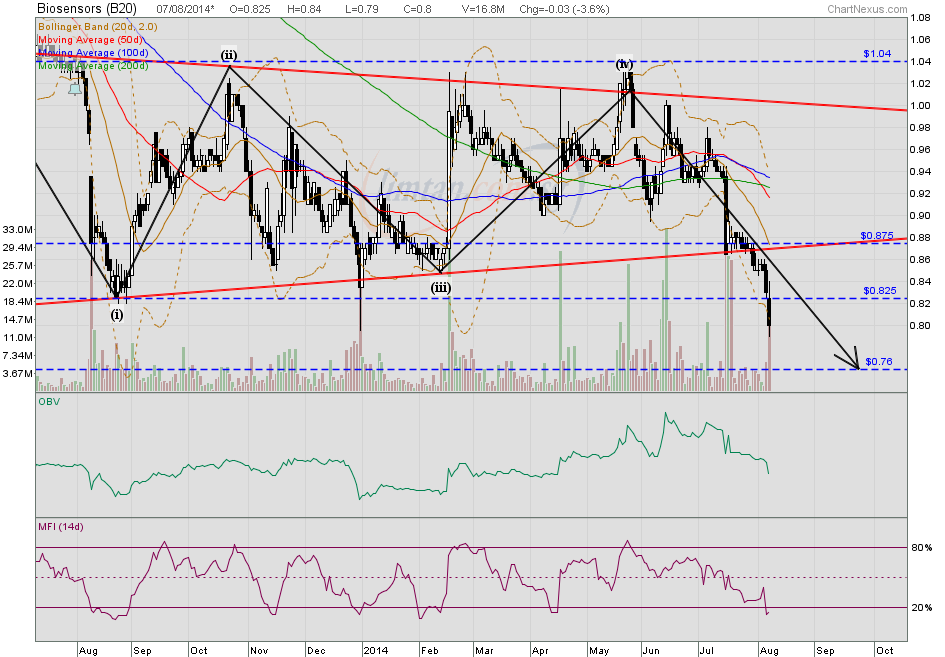 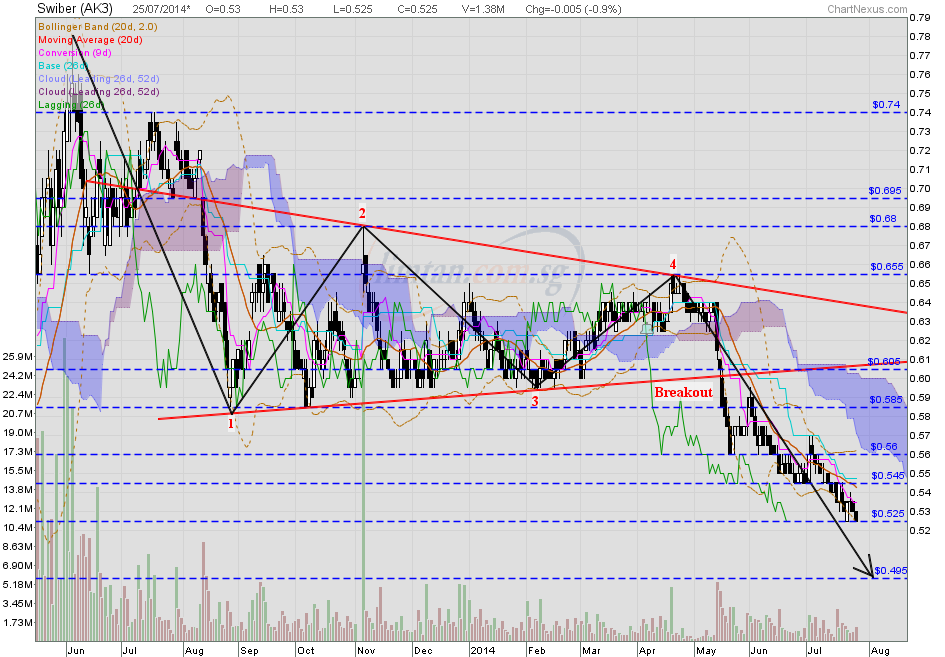
|
|
|
|
Post by zuolun on Aug 12, 2014 14:16:51 GMT 7
Wilmar, Biosensors and Swiber: Chart Pattern — Symmetrical Triangle in a Downtrend (Bearish)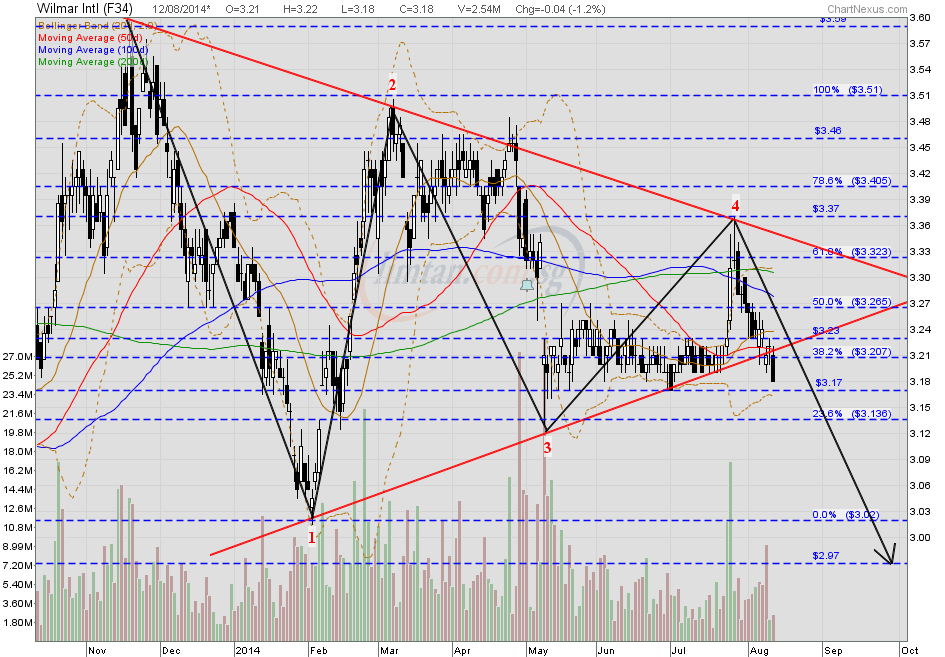
|
|
|
|
Post by zuolun on Aug 18, 2014 7:30:28 GMT 7
Genting SP and Swiber: Chart Pattern — Bearish Symmetrical Triangle Breakout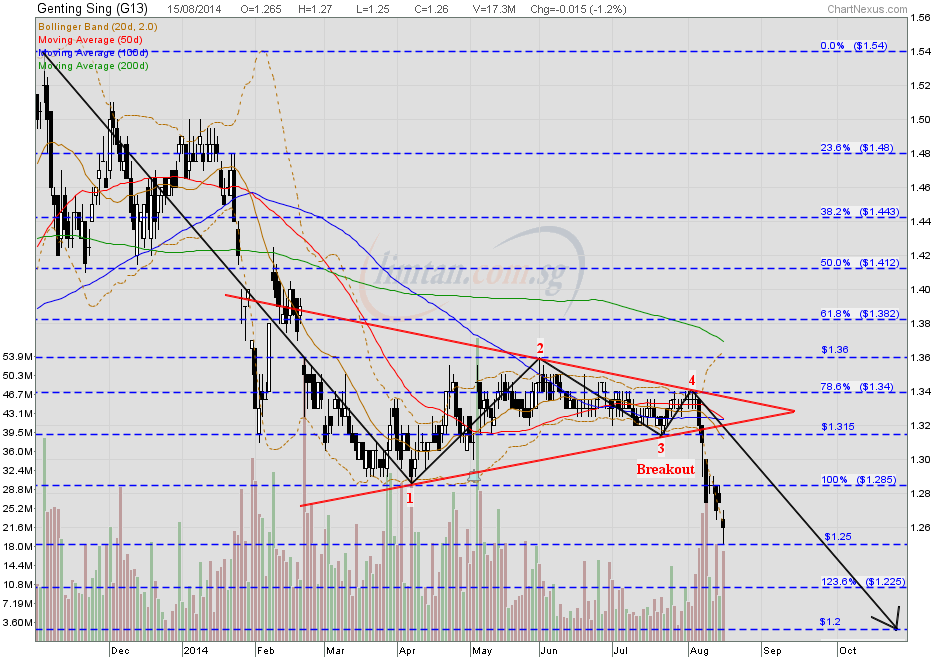 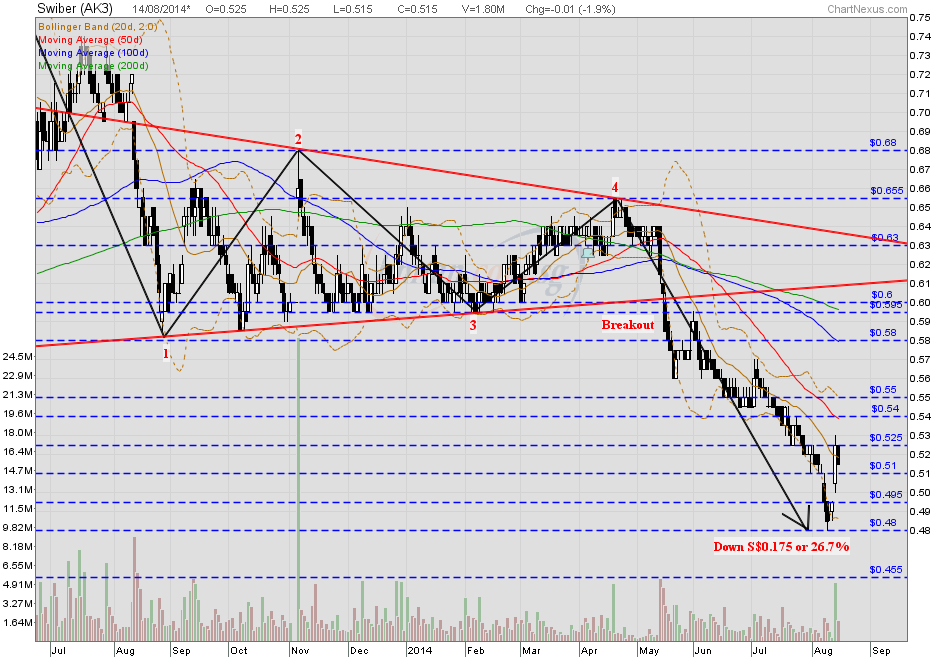
|
|
|
|
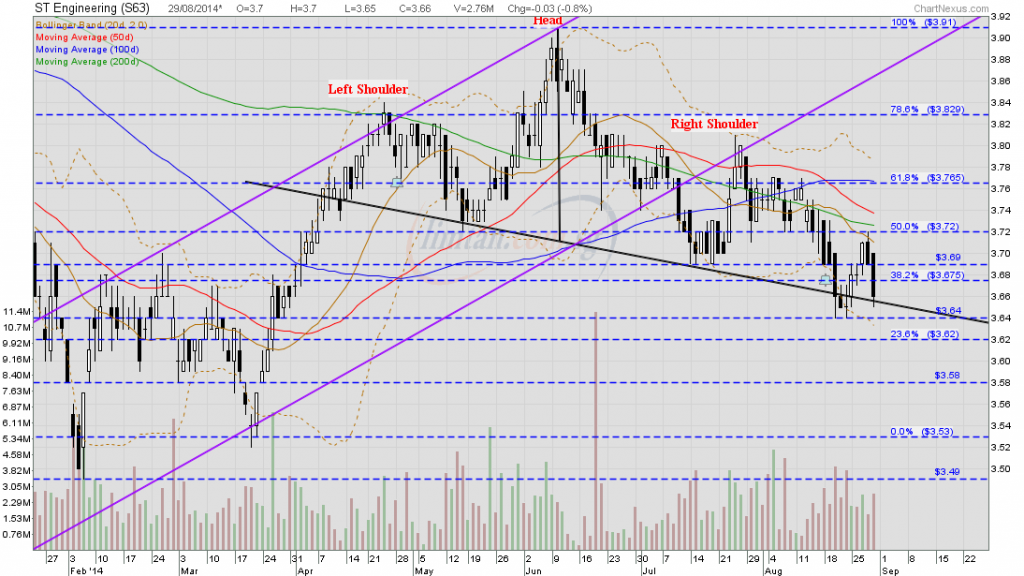
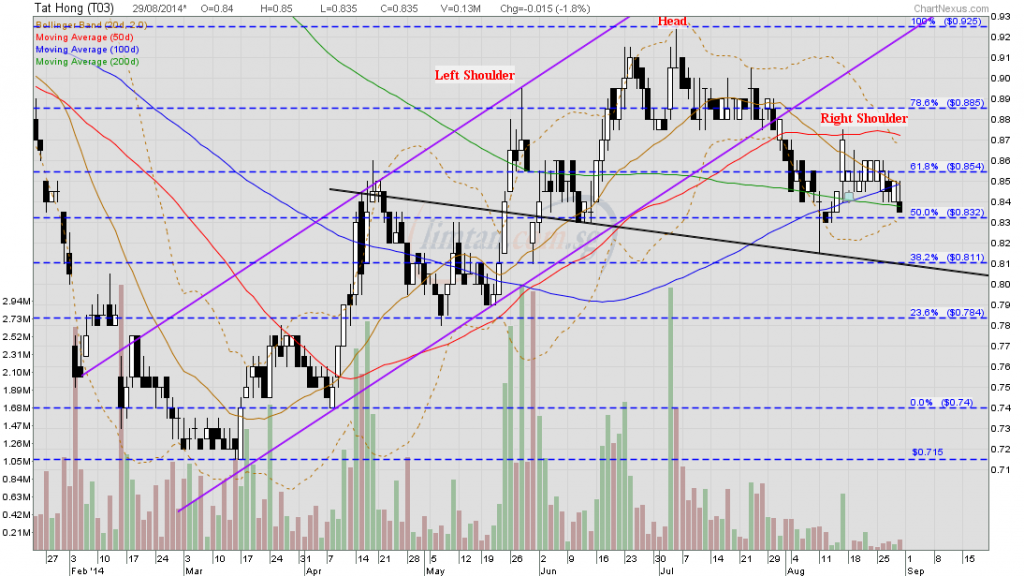
Post by zuolun on Aug 28, 2014 14:43:58 GMT 7
Thong Guan and UOB:
Chart Pattern — Bull Pennant; Thong Guan had 1 big gap, UOB had 1 small gap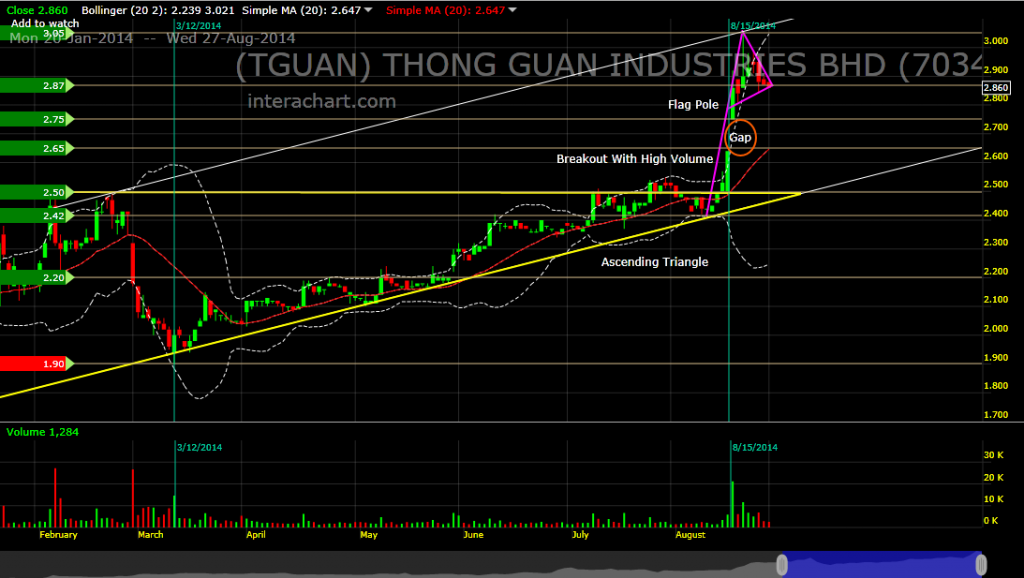 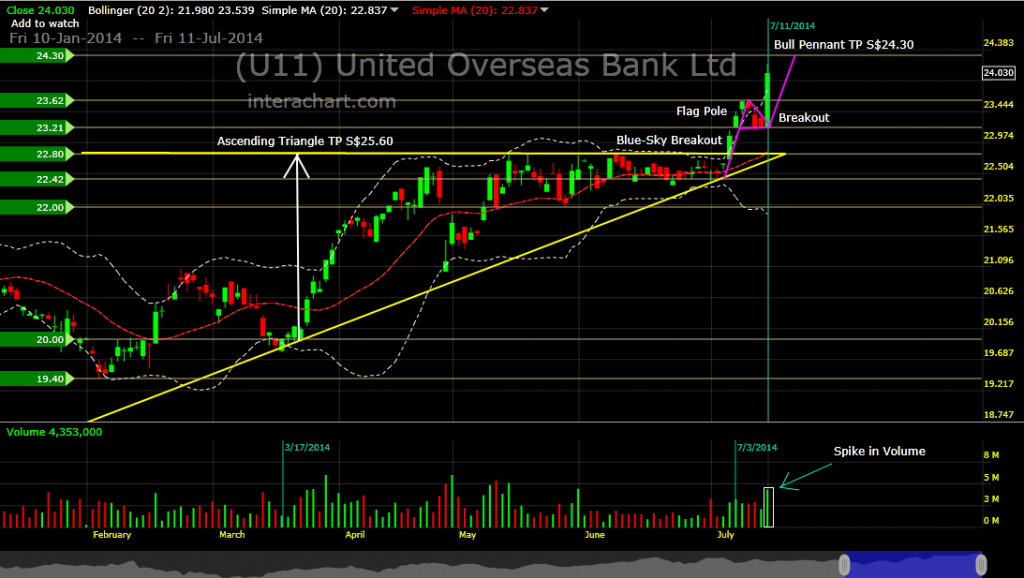
|
|
|
|
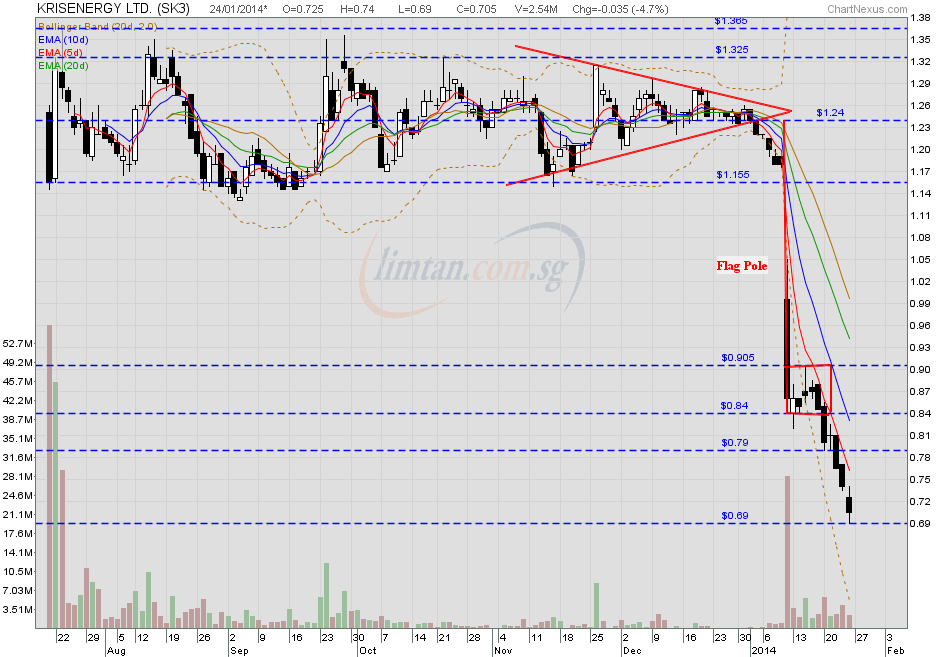
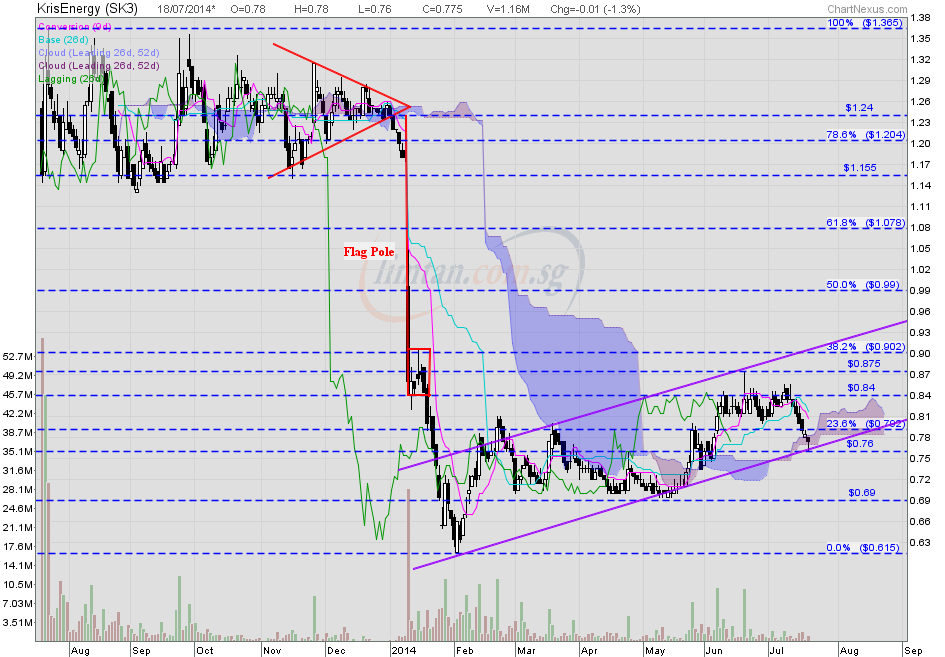
Post by zuolun on Aug 28, 2014 17:42:08 GMT 7
SuperGroup and Cordlife: Bear Flag Vs Bull Flag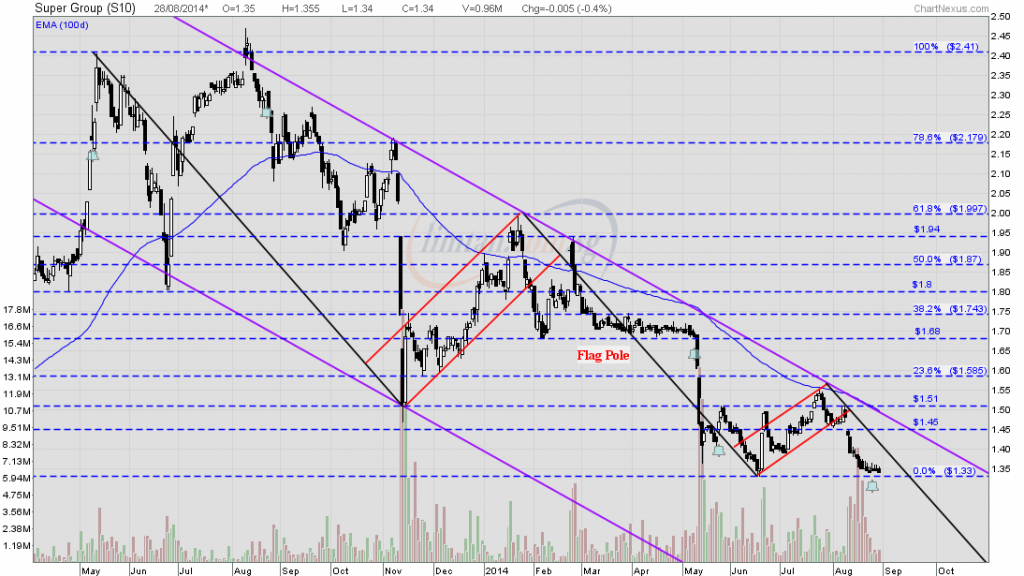
|
|
|
|
Post by zuolun on Aug 30, 2014 9:52:02 GMT 7
|
|
|
|
Post by zuolun on Aug 31, 2014 10:55:20 GMT 7
|
|
|
|
Post by zuolun on Aug 31, 2014 23:36:07 GMT 7
|
|