|
|
Post by zuolun on Apr 17, 2014 20:06:32 GMT 7
|
|
|
|
Post by zuolun on Apr 26, 2014 7:04:57 GMT 7
VARD — Bearish (Gartley, Symmetrical Triangle) Breakout, Interim TP S$0.93, TP S$0.76VARD closed with a spinning top @ S$1.005 (-0.01, -1%) on 25 Apr 2014. Immediate support @ S$0.98, next support @ S$0.95, immediate resistance @ S$1.035. Key resistance @ S$1.20, long term horizontal support @ S$0.79. A break below S$0.79 is a continuation of the major strong downtrend. Based on the Elliott Wave Chart Pattern, crucial support @ S$0.78, record low baseline support @ S$0.56; expect VARD to retest the last low @ S$0.76 scored on 22 July 2013 and hit lower low to close the gap between S$0.70 and S$0.675 created on 7 Oct 2011. 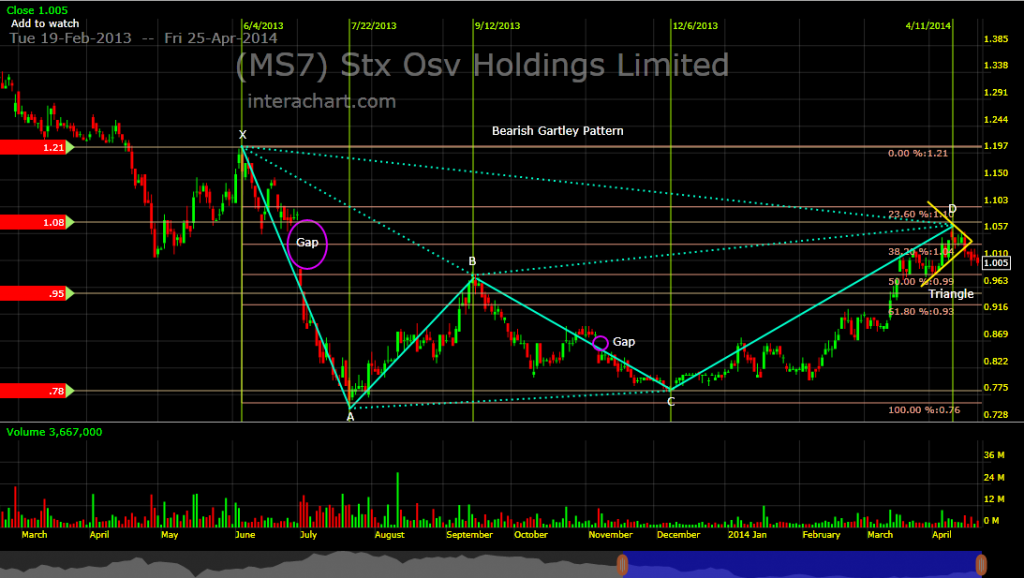 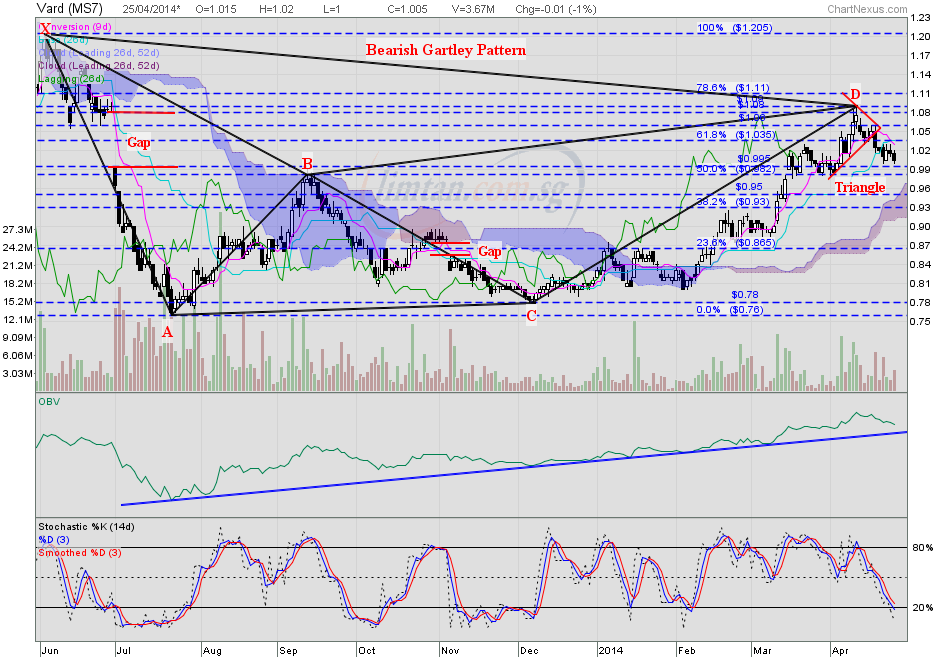
|
|
|
|
Post by oldman on Apr 26, 2014 8:47:19 GMT 7
zuolun, very nice charting program. Lots of indicators as well. Thank you for sharing with us. Just that somehow currently, it only allows one to view only 1 year of historical data.
|
|
|
|
Post by zuolun on Apr 26, 2014 10:43:04 GMT 7
zuolun, very nice charting program. Lots of indicators as well. Thank you for sharing with us. Just that somehow currently, it only allows one to view only 1 year of historical data. oldman, Yes, it's indeed good and nice, I'm still struggling to familiarize myself with this new charting program. Besides SGX stock market, it also has 3 more; Bursa, ASX and HKex. I use the FOC version, which offers 1 year of historical data for daily chart and 5 years of historical data for weekly chart, I believe for paying subscribers, there are better versions.  For the U.S. stock market, I recommend this one, here, just sign up for free usage.  Example: AEON (daily) — 17 Sep 2013 to 25 Apr 2014 Example: AEON (daily) — 17 Sep 2013 to 25 Apr 2014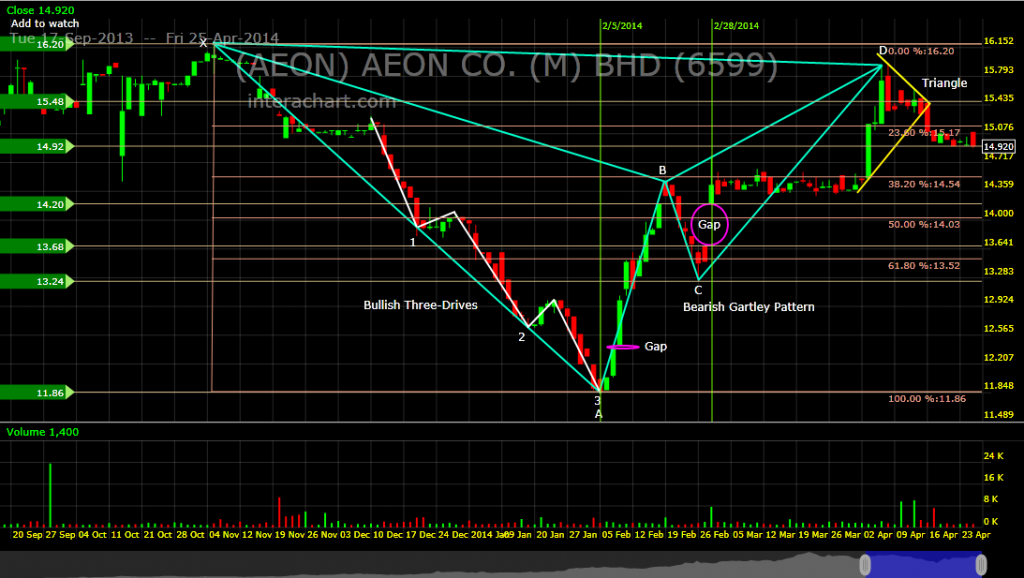 AEON (weekly) — Mar 2009 to Apr 2014 AEON (weekly) — Mar 2009 to Apr 2014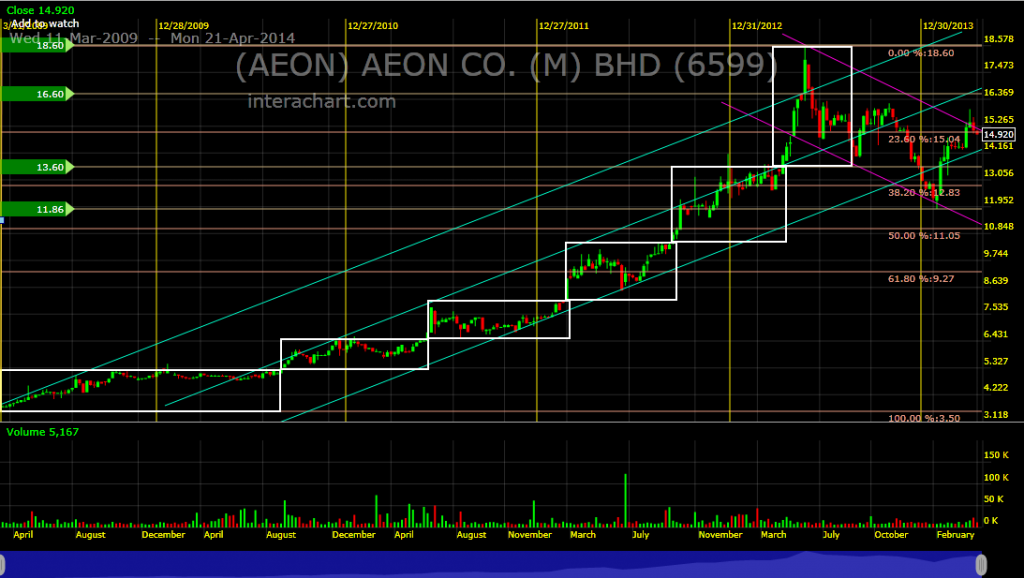 |
|
|
|
Post by odie on May 6, 2014 21:05:11 GMT 7
vard's MACD are having green bars too
RSI and Stoch are pointing up
OBV up too
bro zuolun, any views on this?
thanks
|
|
|
|
Post by zuolun on May 7, 2014 0:06:27 GMT 7
vard's MACD are having green bars too RSI and Stoch are pointing up OBV up too bro zuolun, any views on this? thanks VARD closed with a white marubozu @ S$1.005 (+0.025, +2.6%) with volume done at 4.69m shares on 6 May 2014. Immediate resistance @ S$1.01, the 20d SMA, next resistance @ S$1.03, strong resistance @ S$1.09. Immediate support @ S$0.97, the 50d SMA, next support @ S$0.94, strong support @ S$0.88, the 200d SMA. 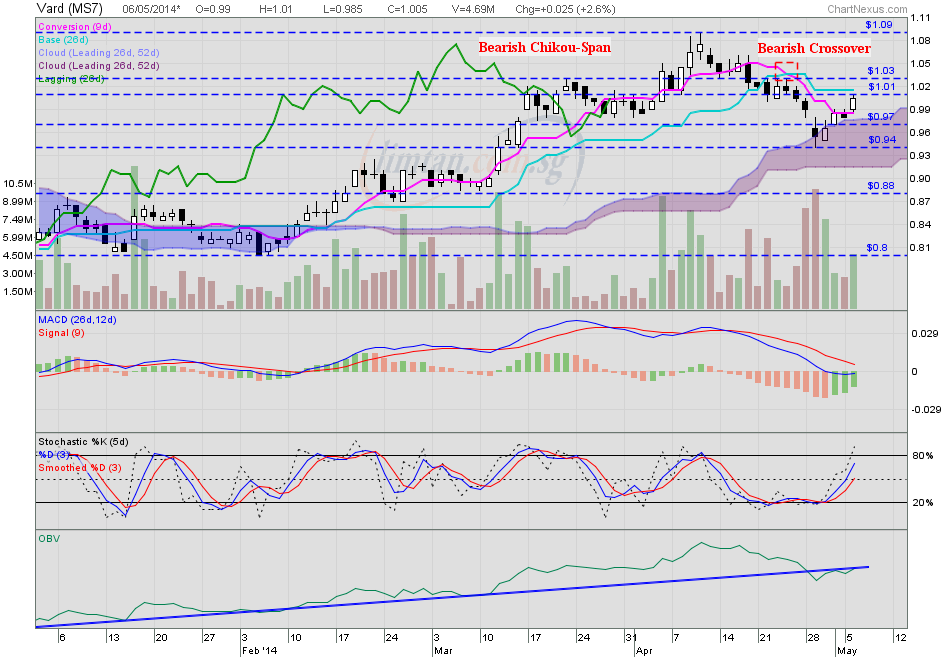 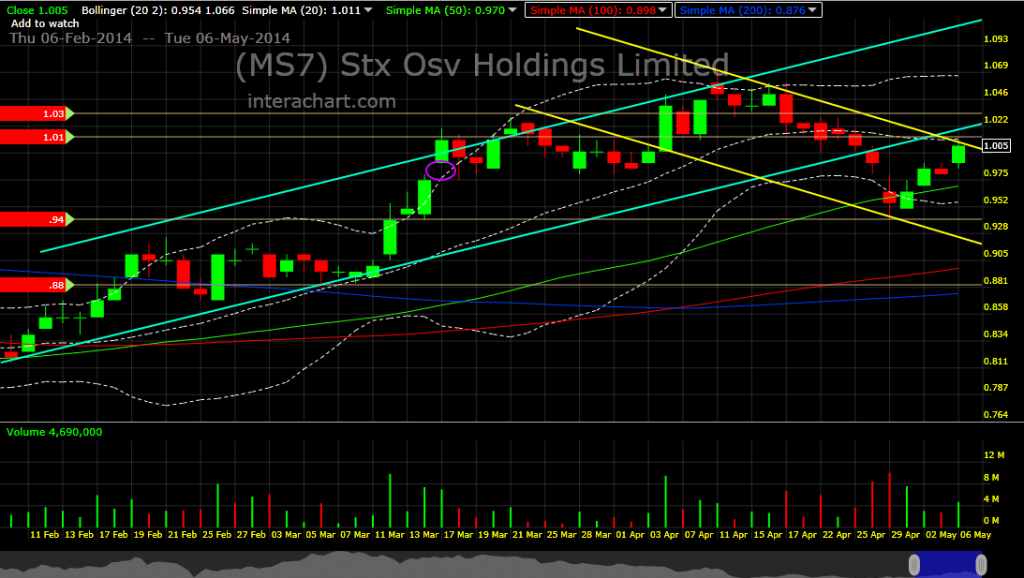 VARD (weekly) — Long-term downtrend; short-term uptrend intact, strong resistance @ S$1.09 VARD (weekly) — Long-term downtrend; short-term uptrend intact, strong resistance @ S$1.09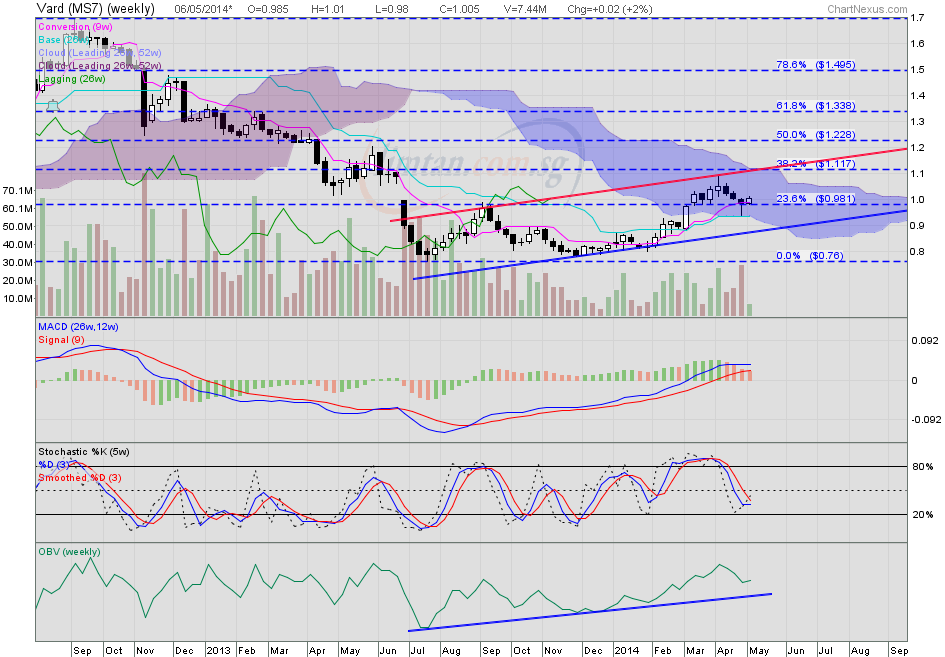 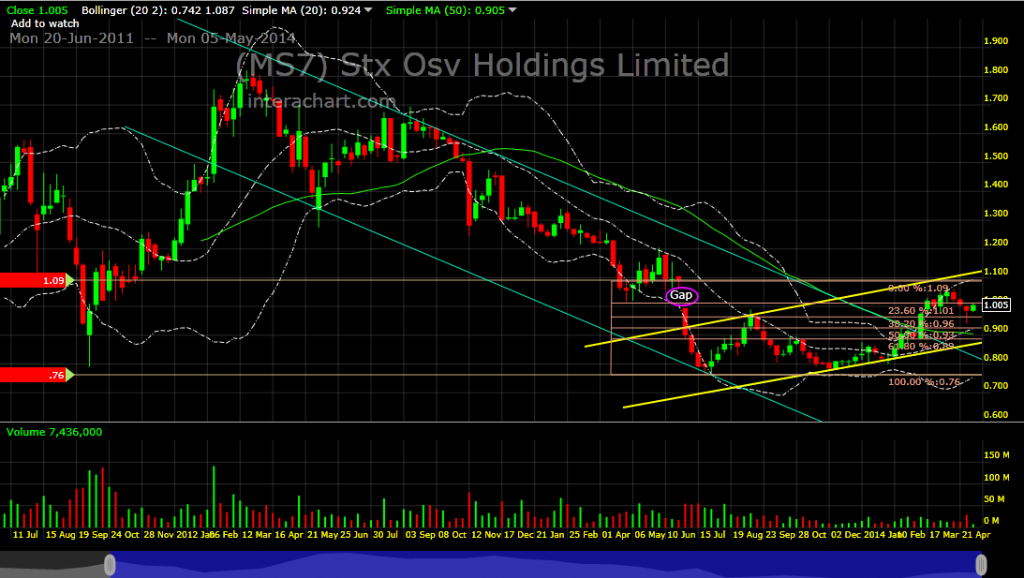 |
|
|
|
Post by zuolun on May 18, 2014 10:04:35 GMT 7
VARD — Plenty of stale bulls were stuck from high of S$1.43 eversince the major "Cheng Kay" run road on Nov 2012.  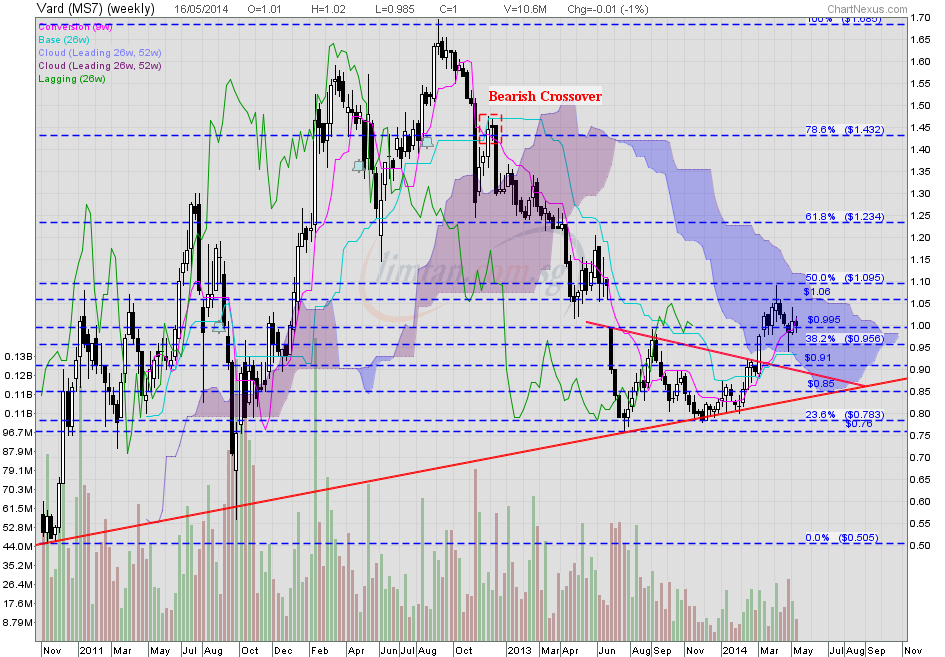
|
|
|
|
Post by zuolun on May 26, 2014 13:47:37 GMT 7
|
|
|
|
Post by odie on May 27, 2014 20:11:02 GMT 7
bro zuolun,
any chart updates for vard and tigerair?
many thanks for your insights and guidance
for vard
chikou span is pointing down
rsi is pointing down and stoch is at 80% but looks not good cos candlestick is black
there is a gap from 1.005 to 1.035
for tigerair, chikou span is pointing up
rsi and stoch are pointing up
it has covered gap from 0.43 to 0.435
macd seems to have a bullish crossover
|
|
|
|
Post by odie on Jun 23, 2014 18:55:49 GMT 7
|
|
|
|
Post by zuolun on Jun 24, 2014 8:09:58 GMT 7
odie, Uptrend intact (short-term and long-term), critical support @ S$1.02, strong resistance @ S$1.20. VARD — Trading in an upward sloping channelVARD had a white marubozu @ S$1.11 (+0.015, +1.4%) on 24 Jun 2014 at 9.20am. 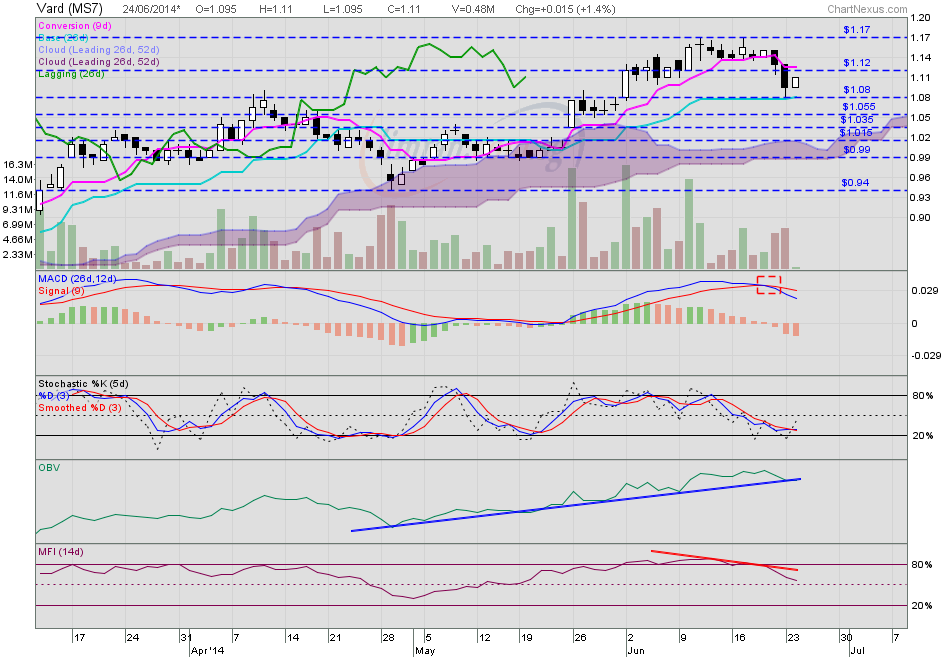 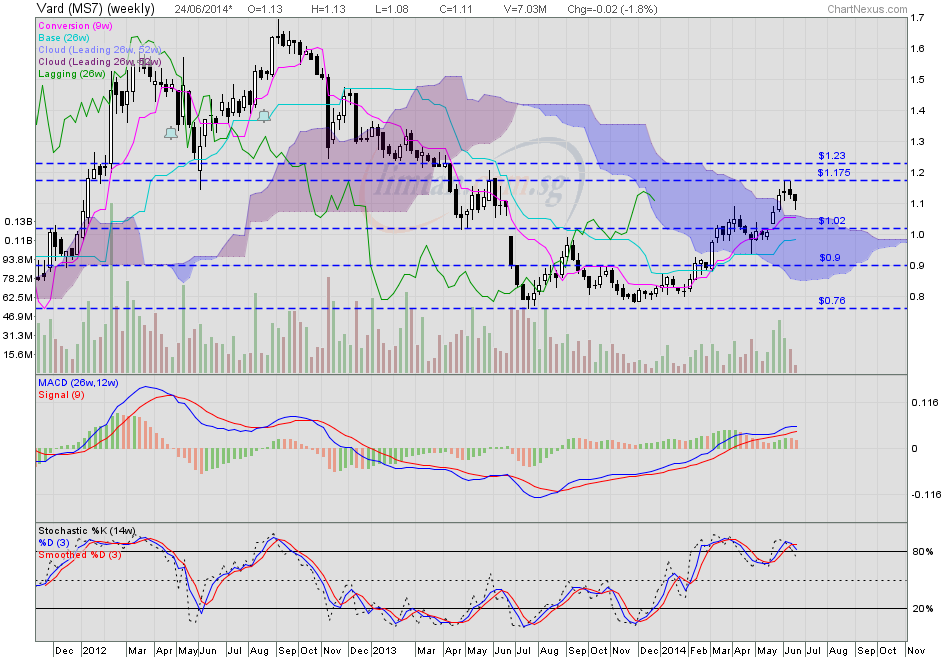 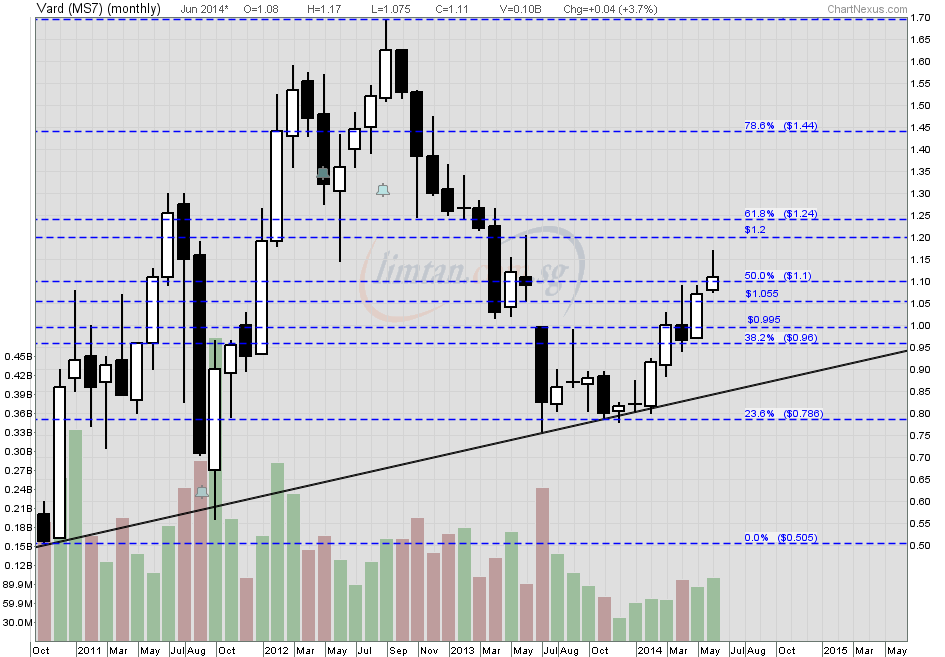 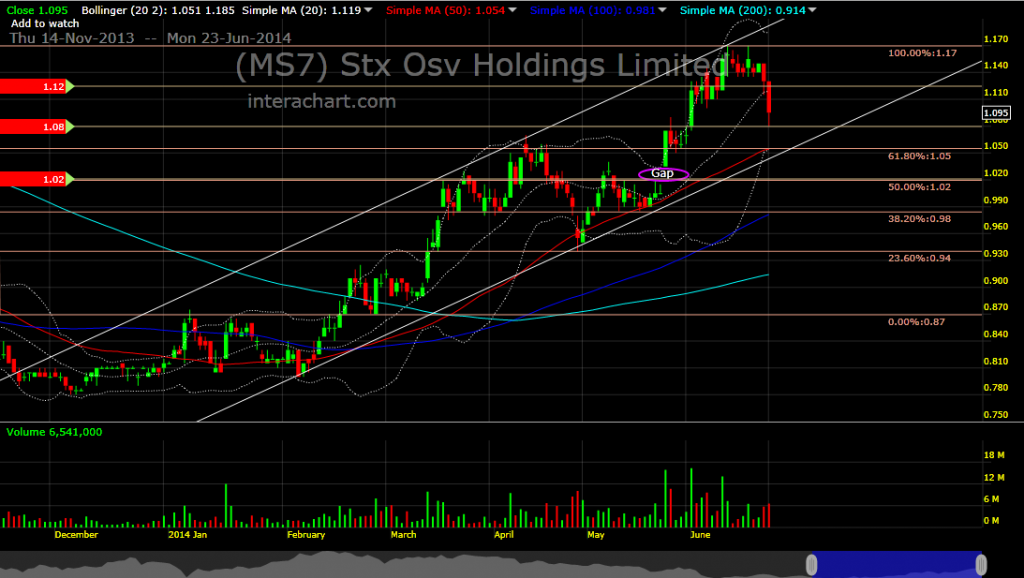 |
|
|
|
Post by odie on Jun 24, 2014 8:23:53 GMT 7
Thanks zuolun bro for advice
Will monitor
|
|
|
|
Post by zuolun on Jun 27, 2014 8:53:59 GMT 7
Thanks zuolun bro for advice Will monitor VARD had a doji unchanged @ S$1.09 on 27 Jun 2014 at 9.40am. Immediate support @ S$1.06, crucial support @ S$1.01, immediate resistance @ S$1.125, strong resistance @ S$1.17. 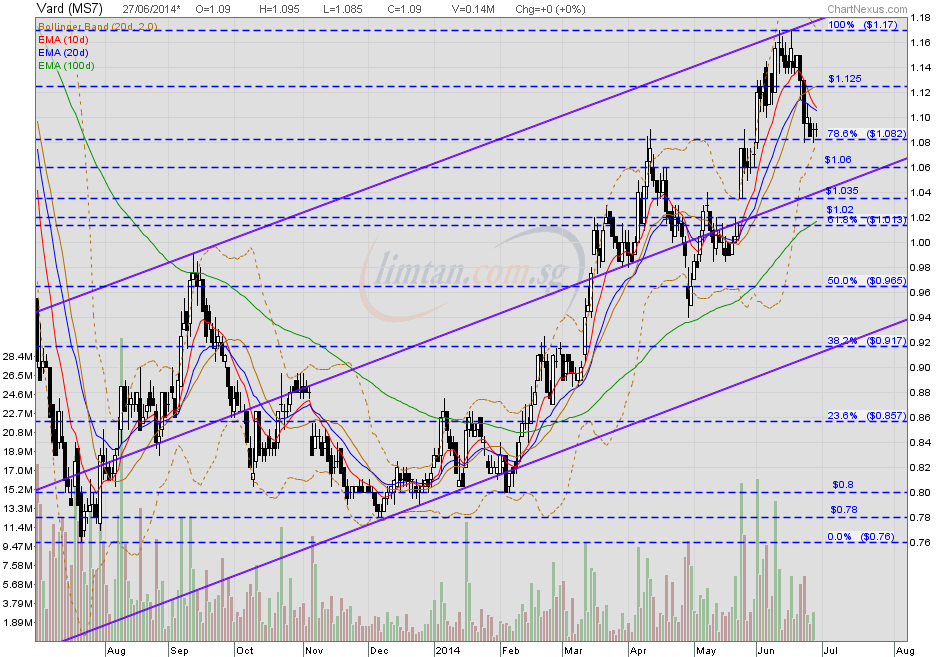 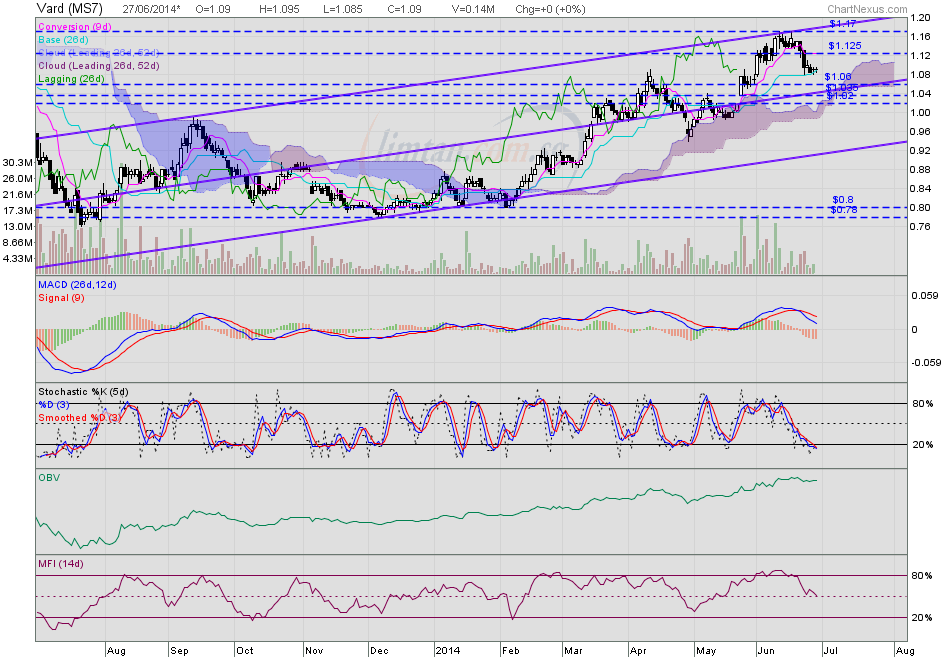 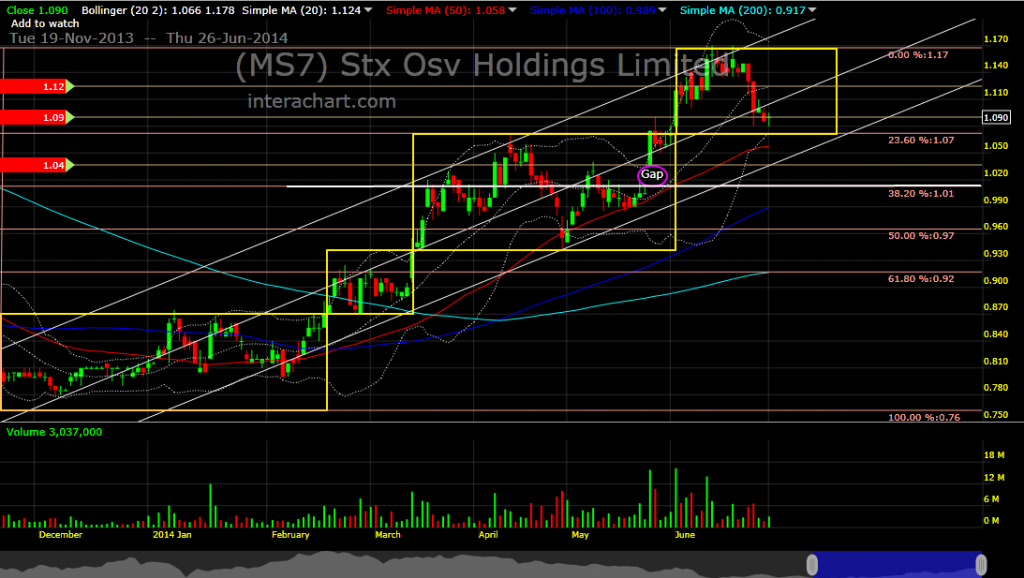 |
|
|
|
Post by odie on Jun 27, 2014 19:17:30 GMT 7
bro zuolun,
thanks for update
i buy small small on wed at 1.105
cut loss yesterday at 1.09 cos the daily high is getting lower:)
|
|
|
|
Post by zuolun on Jun 28, 2014 9:27:30 GMT 7
bro zuolun, thanks for update i buy small small on wed at 1.105 cut loss yesterday at 1.09 cos the daily high is getting lower:) odie, Bottom-fishing is the toughest game in the industry/stock market. STX Dalian's affiliates file for bankruptcy reorganization: "The current ship prices for all 3 major ship types - container vessels, oil tankers and bulkers - are at least 30% cheaper than the market prices before 2008." — 28 Jun 2014 Chinese premier's pet project goes down the drain — 27 Jun 2014 Contracts for 2 platform supply vessels for Nordic American Offshore made effective — 23 Jun 2014 OCBC Research on VARD: More orders secured; HOLD TP S$0.84 — 13 Mar 2014 Alternative view:VARD — The W-shaped reversal chart pattern on VARD is eerily similar to Dukang. 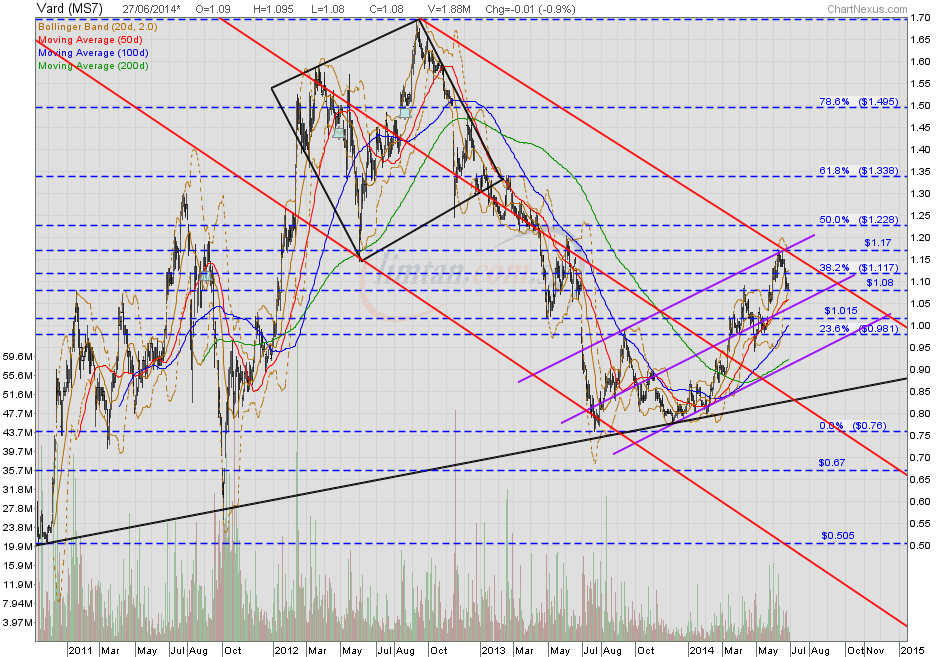 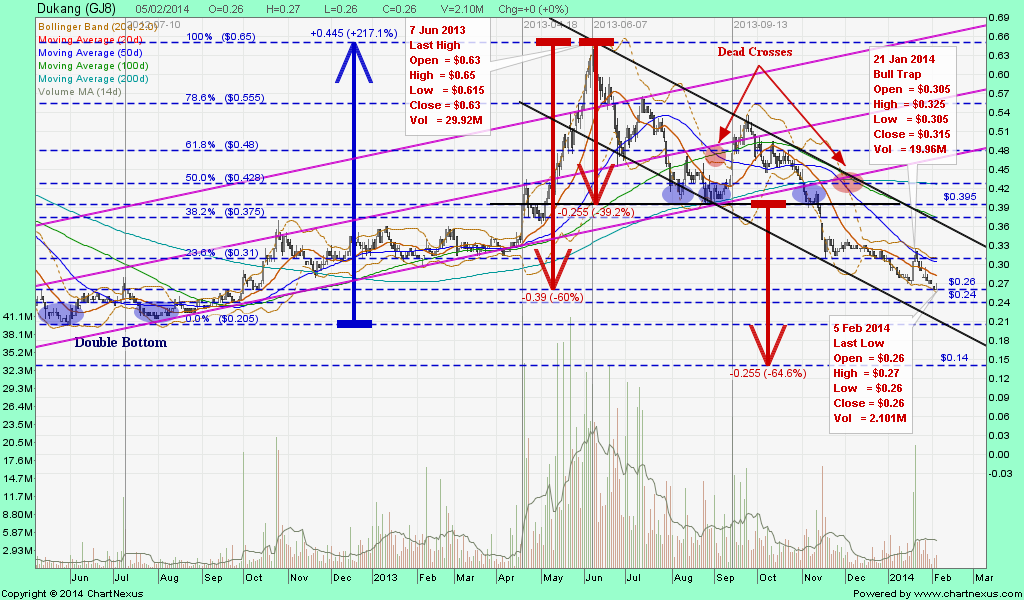 CIMB Daybreak - 27 June 2014 CIMB Daybreak - 27 June 2014
Vard Holdings Ltd (HD, TP:S$1.19) - Havyard IPO pricing does not inspire
Target S$1.19 (Stock Rating: HOLD)Vard’s Norwegian peer, Havyard, has completed its Oslo IPO, following a cut in its IPO price (from NOK36/share to NOK33.50/share). The pricing implies a market cap of NOK755m, and values the stock at 5.4x CY13 P/E and 1.1x CY13 P/BV. In comparison, Vard trades at 14.8x CY13 P/E and 1.7x CY13 P/BV. While we think that a premium is warranted, the wide valuation gap does not inspire much confidence. We maintain our Hold rating as we think that an earnings recovery is priced in, while risk-reward looks to be balanced. No changes to our target price (still at 9x CY15 P/E, the mean since its IPO) and FY14-16 EPS. We will re-visit the stock on stronger margins and orders. What Happened Havyard IPO pricing does not inspire. Havyard’s IPO consists of 4.2m existing shares sold by the current majority shareholder, Havila Holding AS. The IPO pricing values Havyard at 5.4x CY13 P/E and 1.1x CY13 P/BV. In comparison, Vard trades at 14.8x CY13 P/E and 1.7x CY13 P/BV. What We Think Though we think that Vard deserves to trade at a higher premium (due to its scale and market leadership position), the wide valuation gap hardly inspires. Havyard vs. Vard. Havyard is a high-end shipbuilder and designer. The big-4 OSV yards in Norway are Vard, Ulstein, Kleven and Havyard. Over the last three years, Havyard generated an average turnover of NOK1.7bn (15% of Vard's turnover) and achieved an average EBITDA margin of 13.7% (vs. Vard's 12.8%). At 1Q14, its shipbuilding order book stands at NOK2.9bn (13% of Vard's order book). Its net gearing stands at 0.5x vs. Vard's 1.2x. Havyard’s declining margin caps optimism. Perhaps what is more unpropitious is Havyard's declining shipbuilding margins over the last three years, due to construction of riskier, prototype vessels. Typically, these vessels are subsea construction vessels. This point coincides with our argument that the impact of the product mix on Vard's margins is a tricky one to decipher (see overleaf for details). Vard’s order book is skewed towards subsea vessels. What You Should Do With an earnings recovery priced in and risk-reward looking balanced, we advise investors to either trim or hold their positions. |
|