|
|
Post by odie on Jun 28, 2014 14:02:42 GMT 7
thanks bro zuolun for update
Always good to keep stops tight
i will get some dukang if it goes to your target price
|
|
|
|
Post by zuolun on Jul 9, 2014 16:08:45 GMT 7
|
|
|
|
Post by zuolun on Sept 7, 2014 8:17:10 GMT 7
|
|
|
|
Post by zuolun on Sept 19, 2014 15:35:40 GMT 7
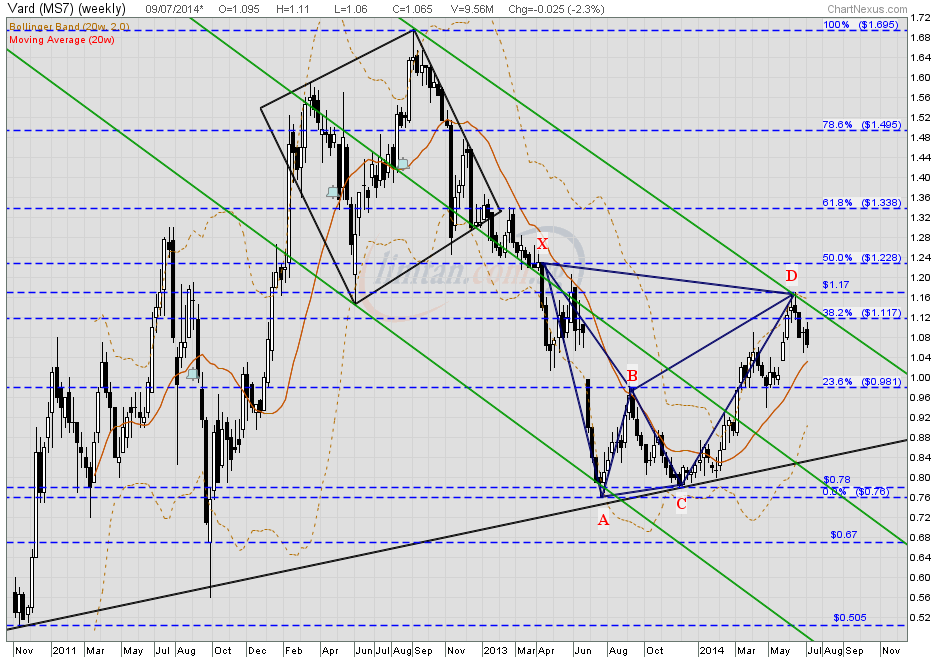
 VARD — H&S Breakout TP S$0.775 VARD — H&S Breakout TP S$0.775VARD had a spinning top @ S$0.89 (-0.01, -1.1%) with 3.88m shares done on 19 Sep 2014 at 4.30 pm. Immediate support @ S$0.855, immediate resistance @ S$0.92. 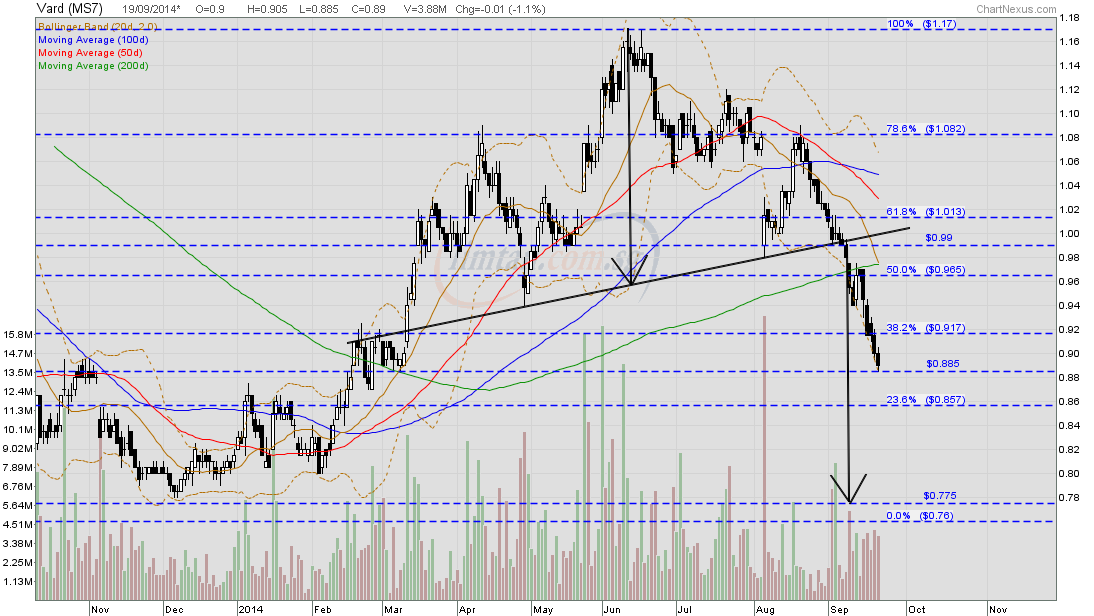 VARD — H&S FormationVARD closed with a black marubozu @ S$0.99 (-0.005, -0.5%) with 1.3m shares done on 5 Sep 2014. Immediate support @ S$0.965, immediate resistance @ S$1.013. 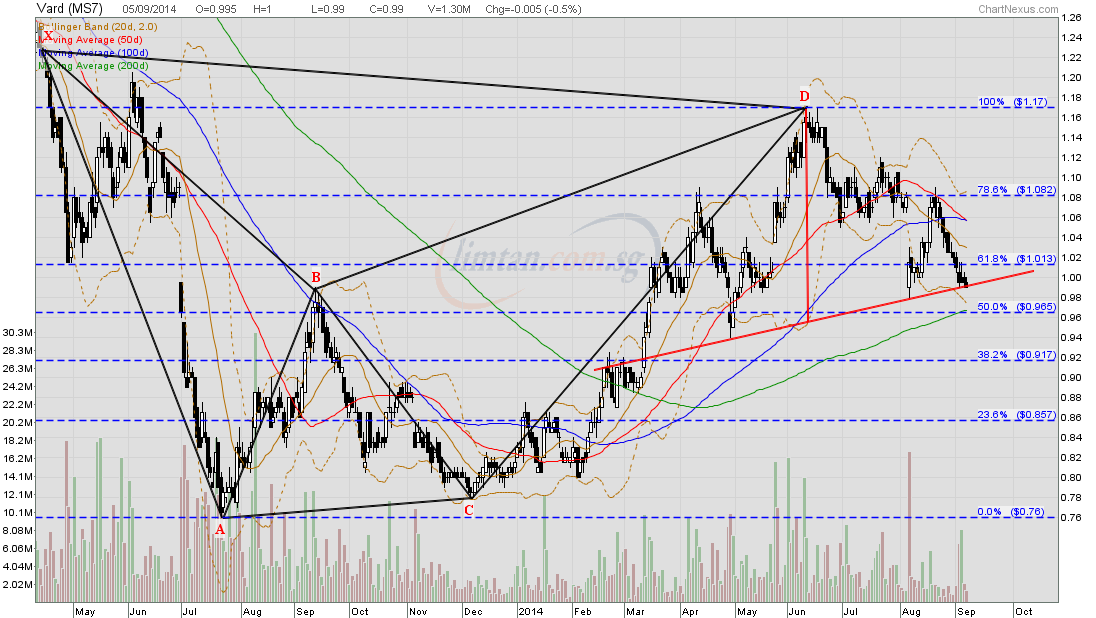 |
|
|
|
Post by zuolun on Sept 23, 2014 16:26:23 GMT 7
VARD — Head and Shoulders Breakout, TP S$0.775VARD closed with a spinning top @ S$0.87 (-0.05, -0.6%) with 1.92m shares done on 23 Sep 2014. Immediate support @ S$0.855, immediate resistance @ S$0.885. 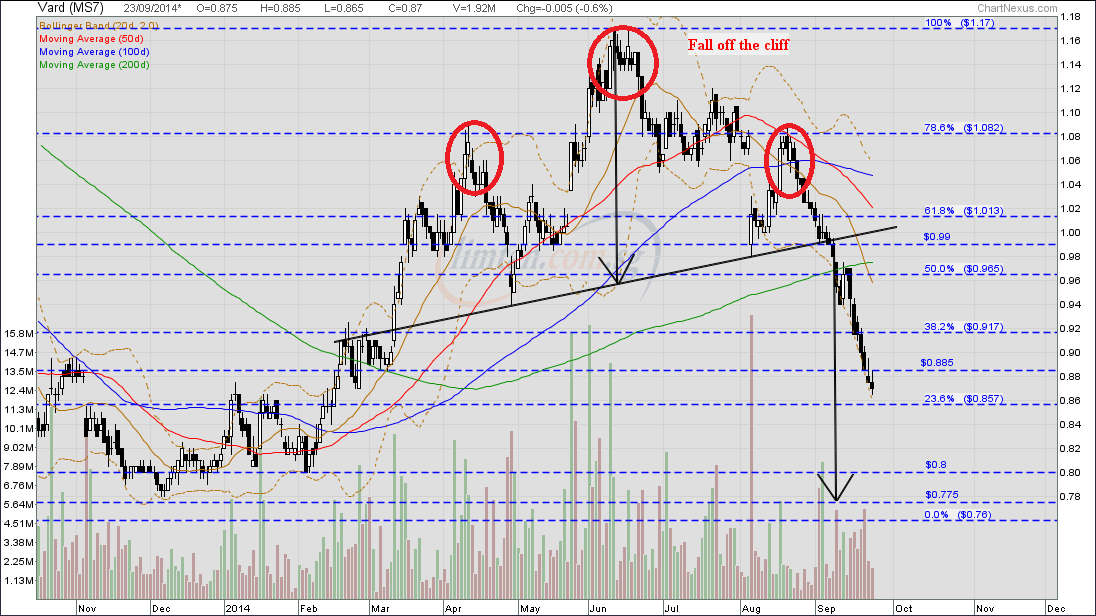
|
|
|
|
Post by zuolun on Sept 24, 2014 10:00:06 GMT 7
 Whack a kitty Whack a kitty with One Good Trade  VARD — Head and Shoulders Breakout, TP S$0.775 VARD — Head and Shoulders Breakout, TP S$0.775VARD had a black marubozu @ S$0.845 (-0.02, -2.3%) with 1.07m shares done on 24 Sep 2014 at 10.55 am Immediate support @ S$0.815, immediate resistance @ S$0.885. 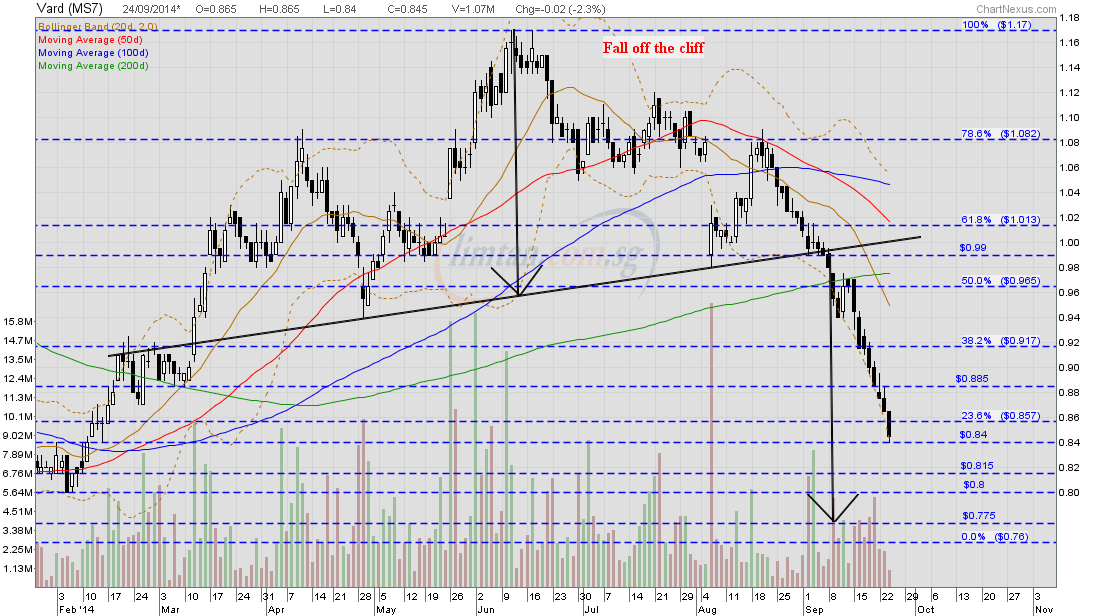 |
|
|
|
Post by zuolun on Oct 5, 2014 14:46:26 GMT 7
VARD — Semi-round arch / "Mushroom Of Death" chart pattern, Interim TP S$0.80, Next TP S$0.76VARD closed unchanged with a gravestone doji @ S$0.865 with 2.3m shares done on 3 Oct 2014. Immediate support @ S$0.85, immediate resistance @ S$0.88. 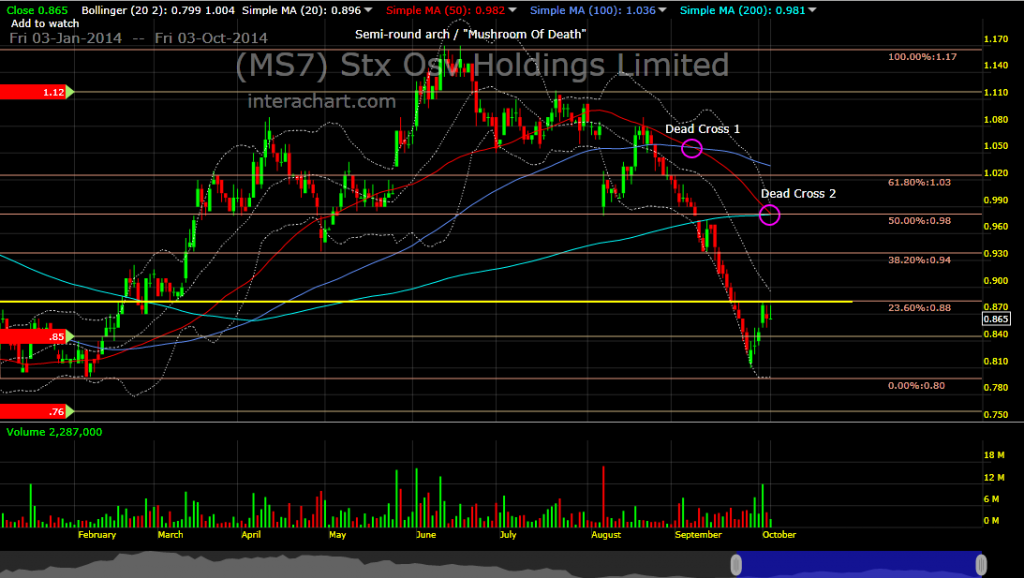
|
|
|
|
Post by simplemind on Oct 15, 2014 10:36:00 GMT 7
Thank you ZL bro for Vard.
|
|
|
|
Post by zuolun on Oct 15, 2014 10:57:13 GMT 7
Thank you ZL bro for Vard. simplemind, Since the last low @ S$0.76 is broken convincingly with extremely high volume today, based on the Gap Theory; VARD's interim TP S$0.595, next TP S$0.505. BTW, in 2011, I learned the Semi-round arch / "Mushroom Of Death" chart pattern from a Malaysian guy who used to read naked charts without trading volume and technical indicators. Thus the MOD chart pattern is originated from him, not me.  Promar problems hit Vard profit Promar problems hit Vard profit — 14 Oct 2014 VARD — Classic MOD chart patternVARD gapped down and had a long black marubozu @ S$0.64 (-0.18, -22%) with extremely high volume done at 33.3m shares on 15 Oct 2014 at 11.44am. Immediate support @ S$0.60, immediate resistance @ S$0.78. 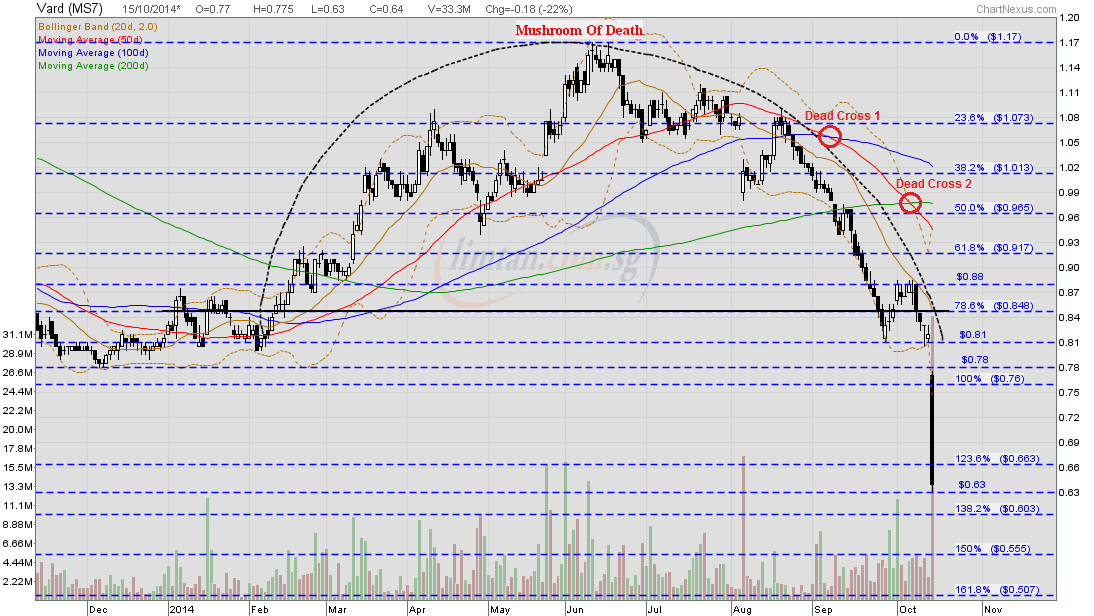 VARD VARD — The Elliott Wave Pattern VARD — Semi-round arch / "Mushroom Of Death" chart pattern, Interim TP S$0.80, Next TP S$0.76VARD closed unchanged with a gravestone doji @ S$0.865 with 2.3m shares done on 3 Oct 2014. Immediate support @ S$0.85, immediate resistance @ S$0.88. |
|
|
|
Post by kenjifm on Oct 15, 2014 15:17:10 GMT 7
The sell of today is due to fear and bad report. example valuetronic had the same problem. The major selling could possibly be done by or with 1. ssh selling 2. a group of ppl who take note of all bad news and do intra day nake short. example valuetronic too 3. retailers gave up holding and cut. Now to answer Qs on the balance sheet or the cash flow statement. There is no prediction from bs or cfs to predict the sell off rather, it show some reasons not to buy into vard. 2013 vs 2012 1. Revenue drop 2. Cost of Revenue increase + Finance Costs 3. NTA less then Net Debt 4. Reduce in operating cash flow and negative Free Cash Flow For TA, at the point of the 2nd Red arrow, one must be on the ball. whether price action will gap down or give retailer a chance to get out will not be within our control.  |
|
|
|
Post by kenjifm on Oct 15, 2014 15:24:15 GMT 7
|
|
|
|
Post by zuolun on Oct 15, 2014 15:39:50 GMT 7
Buying stocks with the highest leverage via CFD at max. financing at 90% may trigger a margin call when price falls below the stop-loss level but the auto-force-selling mechanism prevents further huge losses if there is continual sudden and sharp corrections. Buying properties with the highest leverage via bank financing at 80% (after TOP) with no intermittent margin call lulls the house owner into a false sense of security (as long as the monthly installment is paid promptly). In a sudden and sharp downturn, if the house valuation falls drastically, a margin call served to house owner with no top-up money paid could trigger an immediate evacuation from the house by the bank. The sell of today is due to fear and bad report. example valuetronic had the same problem. The major selling could possibly be done by or with 1. ssh selling 2. a group of ppl who take note of all bad news and do intra day nake short. example valuetronic too 3. retailers gave up holding and cut. Now to answer Qs on the balance sheet or the cash flow statement. There is no prediction from bs or cfs to predict the sell off rather, it show some reasons not to buy into vard. 2013 vs 2012 1. Revenue drop 2. Cost of Revenue increase + Finance Costs 3. NTA less then Net Debt 4. Reduce in operating cash flow and negative Free Cash Flow For TA, at the point of the 2nd Red arrow, one must be on the ball. whether price action will gap down or give retailer a chance to get out will not be within our control. |
|
|
|
Post by zuolun on Oct 28, 2014 14:14:36 GMT 7
Never catch a falling knife — oldman A falling knife in the stock market refers to a stock that experiences a sharp decline and it may collapse > 50% from its breakout/pivotal point, b4 bottoming out. VARD — A "Waterfall Decline" with 5-Wave down, Interim TP S$0.505VARD had a hanging man pattern @ S$0.69 (-0.01, -1.4%) with 2.05m shares done on 28 Oct 2014 at 3pm. Critical support @ S$0.63, Immediate resistance @ S$0.75. 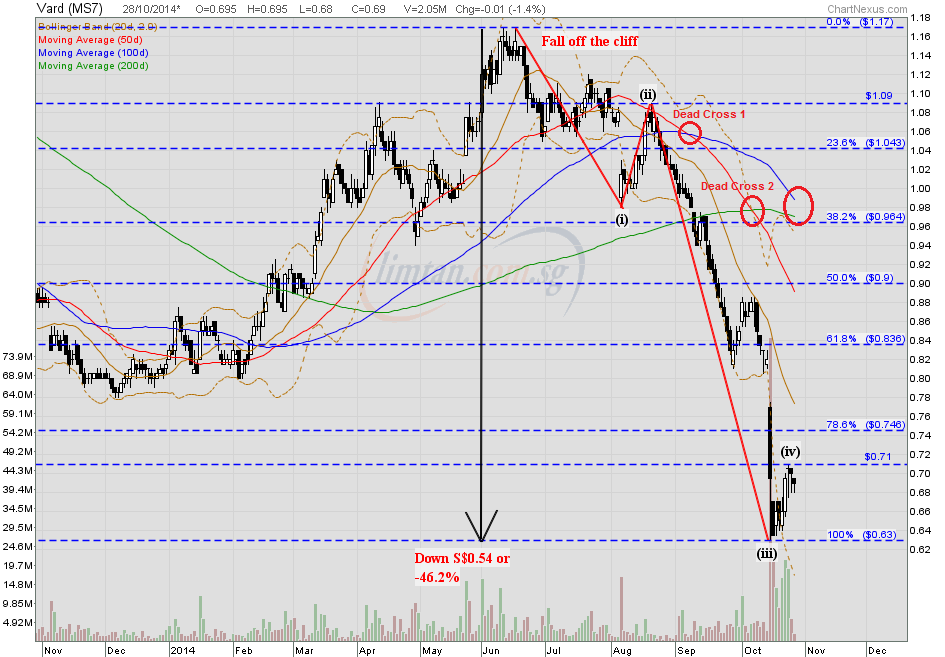
|
|
|
|
Post by zuolun on Nov 6, 2014 9:37:32 GMT 7
VARD — A "Waterfall Decline" with 5-Wave down, Interim TP S$0.505VARD had an inverted hammer unchanged @ S$0.675 with extremely thin volume done at 263 lots on 6 Nov 2014 at 10.30am Immediate support @ S$0.63, immediate resistance @ S$0.71. 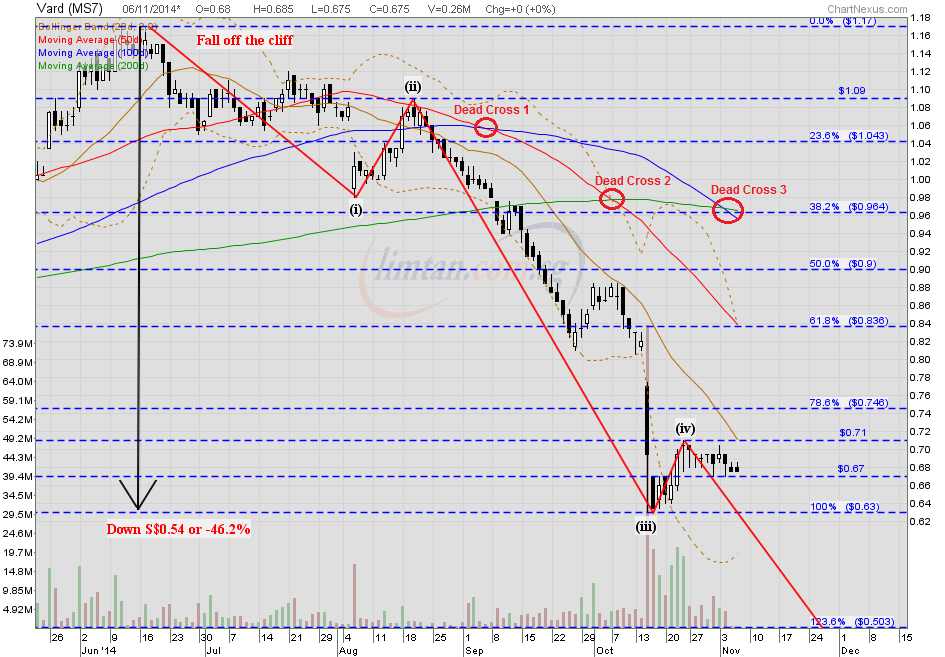 VARD — The Elliott Wave Chart PatternBased on the Elliott Wave chart pattern, crucial support @ S$0.78, record low baseline support @ S$0.56; expect VARD to retest the last low @ S$0.76 scored on 22 July 2013 and hit lower low to close the gap between S$0.70 and S$0.675 created on 7 Oct 2011. 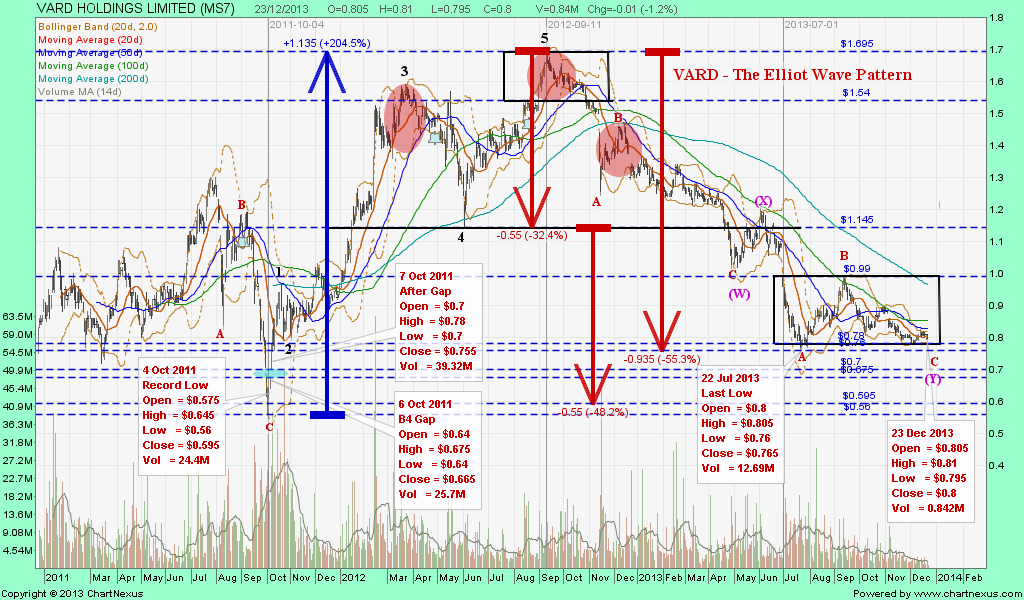
|
|
|
|
Post by zuolun on Nov 12, 2014 11:55:57 GMT 7
A stock is never too high to buy and never too low to short. — Jesse LivermoreVard slips into the red in Q3 — 11 Nov 2014 VARD — A "Waterfall Decline" with 5-Wave down, Interim TP S$0.505VARD had a black marubozu @ S$0.655 (-0.02, -3%) with 2.32m shares done on 12 ov 2014 at 12.50pm. Immediate support @ S$0.63, immediate resistance @ S$0.67. 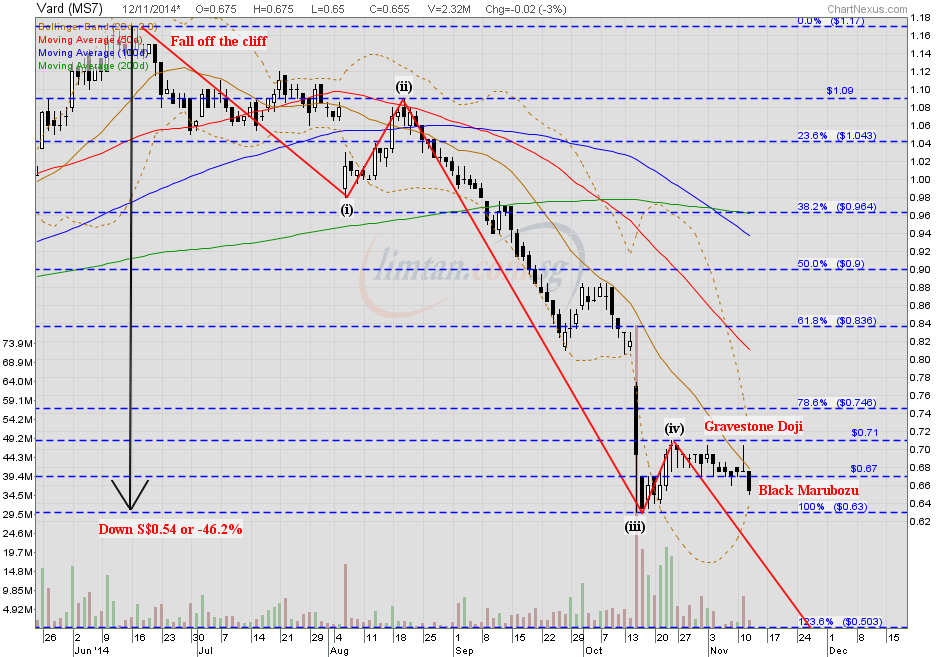
|
|