|
|
Post by zuolun on May 7, 2015 14:57:54 GMT 7
Bro Zuolun, Your perdition really no-horse-run; 我对大哥佩服到五体投地.  As of go or no-go if Linc Energy hits S$ 0.012, 此一时,彼一时, I will consult with you again by then.  , I didn't teach you this... 借力打力,太极拳技击技法的重要原则。   |
|
|
|
Post by sptl123 on May 7, 2015 15:30:18 GMT 7
sptl123, I didn't teach you this... 借力打力,太极拳技击技法的重要原则。  |
|
|
|
Post by zuolun on May 8, 2015 6:25:58 GMT 7
oldman, Linc Energy's share price is likely to hit lower low, forming a new low, below S$0.20, after short-covering. This is similar to the downward movement of the Catalist Index. BTW, the price projection on Linc Energy @ S$0.20 is based on a textbook example of a classic "MOD" chart pattern, on a longer timeframe from 10 May 2006 to 6 Apr 2015. At that price, it will certainly tickle my interests though I will need to study it thoroughly first. Yes, when big money exits, I will certainly not fight it as big money like to act together and I would not be surprised that there will be more announcements of big sellers in the days and weeks ahead. Well done on your prediction, Zuolun. The share price is now at 20cts. ~ 7 May 2015 Linc Energy in talks with US subsidiary's note holders ~ 7 May 2015 Linc Energy: 2013 Selected Balance Sheet Figures ~ 18 Jul 2014 Linc Energy ~ Bearish bollinger bands breakout, biased to the downsideLinc Energy closed with a long black marubozu @ S$0.215 (-0.006, -21.8%) with high volume done at 18.5m shares done on 7 May 2015. Immediate support @ S$0.195, immediate resistance @ S$0.26 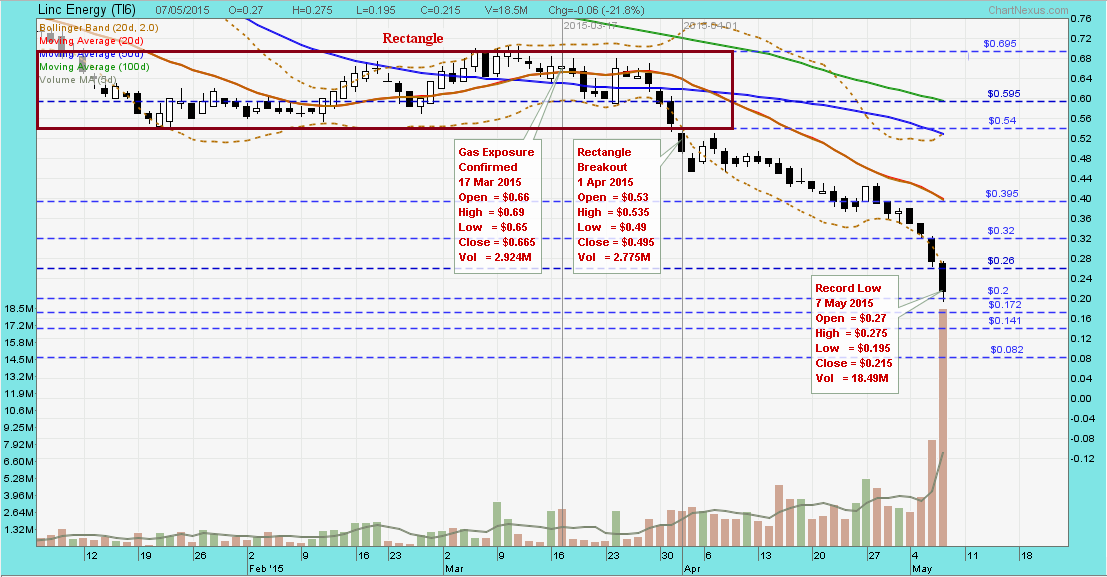 |
|
|
|
Post by zuolun on May 8, 2015 19:01:50 GMT 7
Linc Energy ~ Bearish bollinger bands breakout, biased to the downsideLinc Energy closed with a bullish harami @ S$0.245 (+0.03, +14%) with 10.2m shares done on 8 May 2015. Immediate support @ S$0.195, immediate resistance @ S$0.26 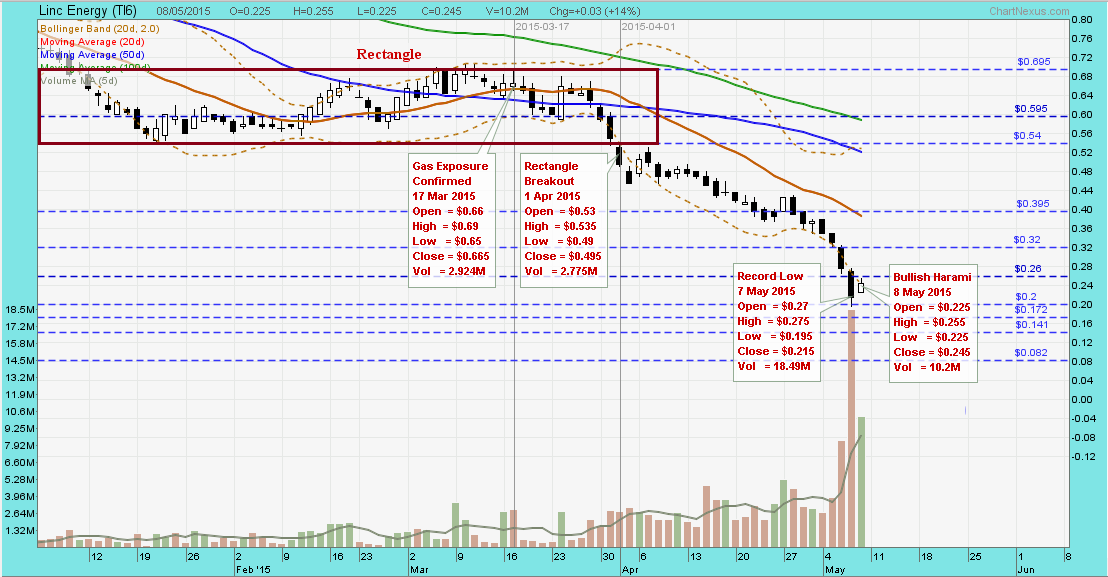 Harami Harami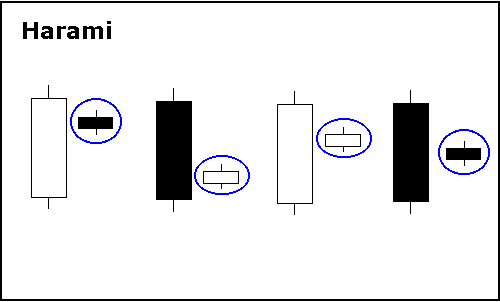
|
|
|
|
Post by zuolun on May 12, 2015 13:14:49 GMT 7
Linc Energy ~ Bearish Bollinger bands breakout, biased to the downsideLinc Energy had a spinning top and traded @ S$0.22 (-0.02, -8.3%) with 3.21m shares done on 12 May 2015 at 2pm. Immediate support @ S$0.195, immediate resistance @ S$0.26. 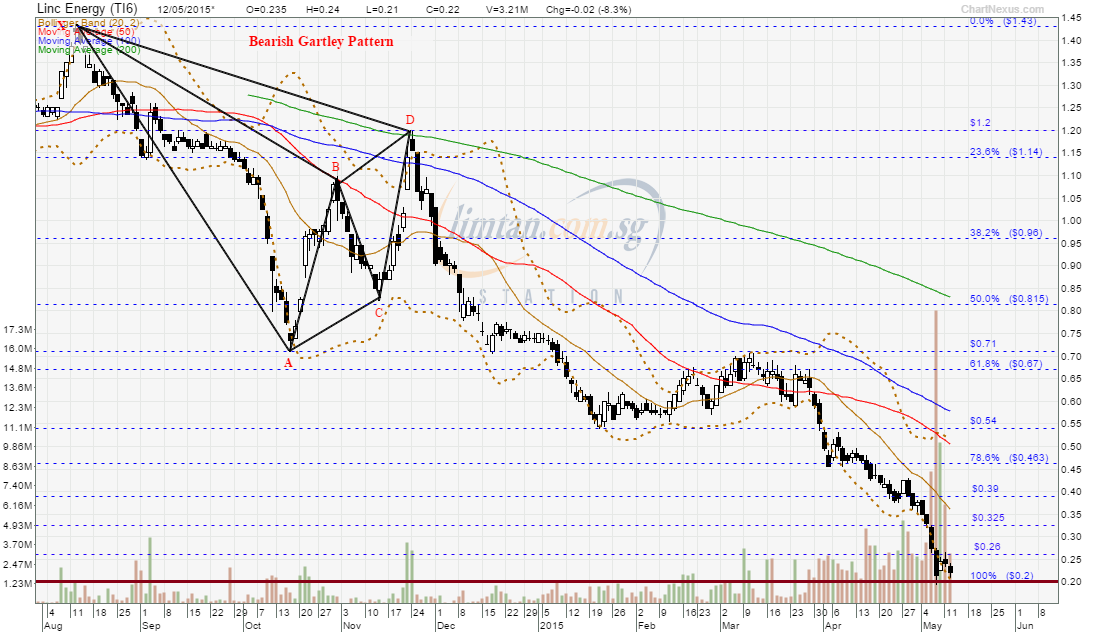
|
|
|
|
Post by westerndidi on May 22, 2015 10:08:21 GMT 7
Dear shifus, I tried to learn charting by duplicating zuolun's chart. Can I know how do I derive the immediate resistance? Thank you di 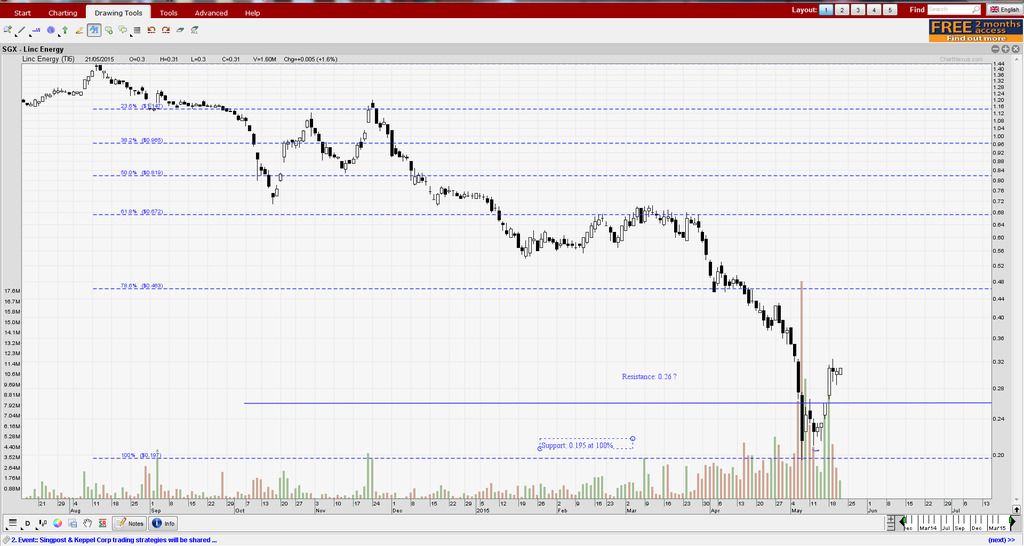 Linc Energy ~ Bearish Bollinger bands breakout, biased to the downsideLinc Energy had a spinning top and traded @ S$0.22 (-0.02, -8.3%) with 3.21m shares done on 12 May 2015 at 2pm. Immediate support @ S$0.195, immediate resistance @ S$0.26. |
|
|
|
Post by zuolun on May 22, 2015 10:27:08 GMT 7
Dear shifus, I tried to learn charting by duplicating zuolun's chart. Can I know how do I derive the immediate resistance? Thank you di , TA is an art and science. Do you see what I saw in your Linc Energy chart? Based on your imagination, try drawing a bearish gartley pattern formation. (Nothing is impossible if you've an extremely bearish view on the probability of Linc Energy collapsing to S$0.012 per share.) 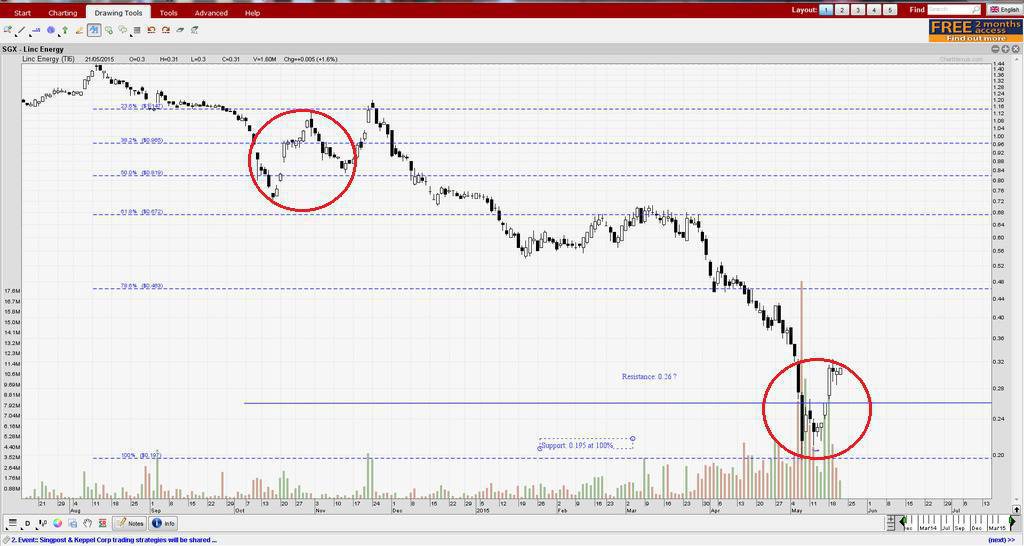 |
|
|
|
Post by huathuatleo on May 22, 2015 15:37:07 GMT 7
Hi Sifu zuolunI see that you you a lot of Harmonics. I am not sure about their hit rate and precision..as I have friends who told me that they dont really work out sometimes in the FX world. It has I would say 60-65% probability. What is your opinion on stocks? cheers. Dear shifus, I tried to learn charting by duplicating zuolun's chart. Can I know how do I derive the immediate resistance? Thank you di , TA is an art and science. Do you see what I saw in your Linc Energy chart? Based on your imagination, try drawing a bearish gartley pattern formation. (Nothing is impossible if you've an extremely bearish view on the probability of Linc Energy collapsing to S$0.012 per share.) |
|
|
|
Post by zuolun on May 23, 2015 9:12:52 GMT 7
|
|
|
|
Post by westerndidi on May 23, 2015 10:12:17 GMT 7
Dear Zuolun, Below is my humble interpretation: First circle shows a failed W reversal signal. Downtrend remains intact. Bearish Gartley Pattern show's the continuation of a bearish trend. The second Gartley patterns confirms the continuation of downtrend and apparently a sharp drop is usually accompanied by the end of the Bearish Gartley pattern. Second circle shows a Bullish hammer signal on the 14th May with rebound less than 50% of the recent sharp fall from H to I. It has a resistance line around $0.31, with a hanging man (12th) and a shooting star(14th) shows that rebound may end anytime soon. Thank you di. 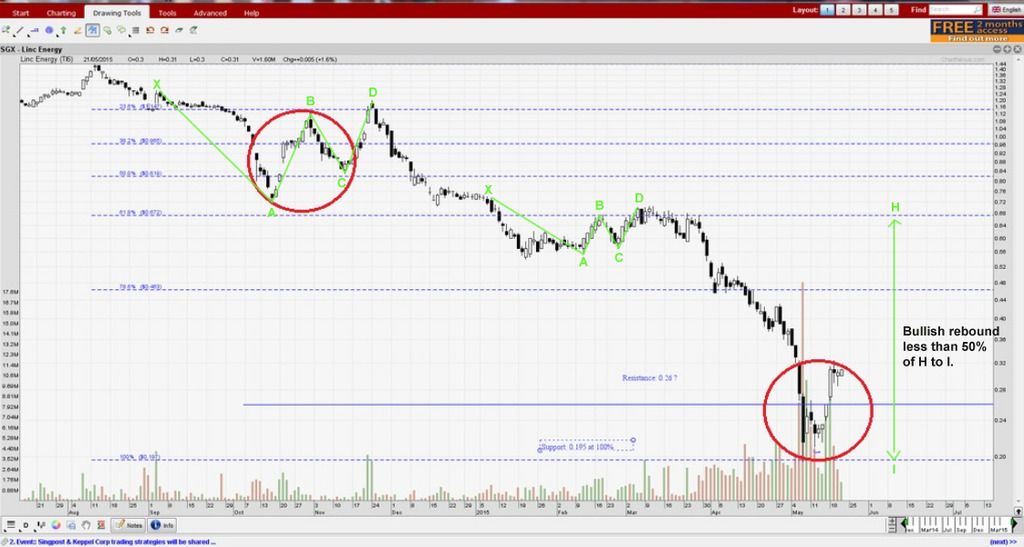 Attachments:
|
|
|
|
Post by roberto on May 24, 2015 21:00:24 GMT 7
Dear Zuolun, Below is my humble interpretation: First circle shows a failed W reversal signal. Downtrend remains intact. Bearish Gartley Pattern show's the continuation of a bearish trend. The second Gartley patterns confirms the continuation of downtrend and apparently a sharp drop is usually accompanied by the end of the Bearish Gartley pattern. Second circle shows a Bullish hammer signal on the 14th May with rebound less than 50% of the recent sharp fall from H to I. It has a resistance line around $0.31, with a hanging man (12th) and a shooting star(14th) shows that rebound may end anytime soon. Thank you di. Just from your interpretation, one can see the issue with harmonic patterns. Simply choosing the "correct" XA is subjective. I believe the "better" X should be the highest point; both X's you selected aren't. Also, for your second pattern, I believe the "correct" A should be the nearby low towards the left of the point you selected. Like what huathuatleo's friends told him, harmonics don't really work out sometimes (be it the FX or stock markets, IMO). |
|
|
|
Post by zuolun on May 25, 2015 5:26:50 GMT 7
Question: Why do people in the stock market still continue to lose money after learning so much technical analysis? What's the cause?Answer: Everyone can draw charts but not everyone can read charts, correctly."If you understand the benefits and limitations of technical analysis, it can give you a new set of tools or skills that will enable you to be a better trader or investor." — Koon Yew Yin You can use technical analysis to:- Identify profitable stock patterns
- Minimize your risk
- Maximize your return in up and down markets
Dear Zuolun, Below is my humble interpretation: First circle shows a failed W reversal signal. Downtrend remains intact. Bearish Gartley Pattern show's the continuation of a bearish trend. The second Gartley patterns confirms the continuation of downtrend and apparently a sharp drop is usually accompanied by the end of the Bearish Gartley pattern. Second circle shows a Bullish hammer signal on the 14th May with rebound less than 50% of the recent sharp fall from H to I. It has a resistance line around $0.31, with a hanging man (12th) and a shooting star(14th) shows that rebound may end anytime soon. Thank you di. Just from your interpretation, one can see the issue with harmonic patterns. Simply choosing the "correct" XA is subjective. I believe the "better" X should be the highest point; both X's you selected aren't. Also, for your second pattern, I believe the "correct" A should be the nearby low towards the left of the point you selected. Like what huathuatleo's friends told him, harmonics don't really work out sometimes (be it the FX or stock markets, IMO).
|
|
|
|
Post by roberto on May 25, 2015 9:08:02 GMT 7
I believe the real difficulty and wisdom lies in the red portion of the quote. A craft that requires loads of experience. Two can look at the same chart and have largely different interpretations. Digressing somewhat, but some "perspective" pictures for amusement:    |
|
|
|
Post by zuolun on May 25, 2015 9:34:43 GMT 7
haha...your reply implies that you actually don't understand the benefits and limitations of technical analysis. I believe the real difficulty and wisdom lies in the red portion of the quote. A craft that requires loads of experience. Two can look at the same chart and have largely different interpretations. Digressing somewhat, but some "perspective" pictures for amusement: |
|
|
|
Post by westerndidi on May 25, 2015 11:21:28 GMT 7
Oh mine, I charting skills really so jialat lol. Looks like got lots to learn:)
|
|


