|
|
Post by zuolun on May 2, 2015 11:31:15 GMT 7
sptl123, Make hay while the sun shines. The latest gloomy shipping news will only have -ve impact on NOL after the major cheng kay has finished his goreng business on the stock. Chartwise, NOL is extremely overbought with stochastic > 80. However, based on price action, trading volume and the share price trading above the 4 SMA, buy for 2nd round should the price back down; especially near the 20d SMA. Thank you Bro Zuolun, NOL is sold down hard today. Look at the volume and price summary last 3 days remind me of life ( up and down and unpredictable): General Zuolun, Applying your strategy of : The power of the 20d SMA and the mighty 200d SMAMy troops is now waiting patiently near The Hill 20D SMA and will strike at your command, Sir !  , The 20d and 200d SMA strategies are best applicable to stocks with the primary trend up. Use the 2 strategies cautiously on all stocks which are on major downtrend (struggling to find the real bottom) because it may turn out to be a big bull trap trapping the bottom-picking gullible bulls at high prices — at the end of the intermediate / short-term uptrend. (See how cheng kay did the pump and dump job on China Env; up 157.5% down 48.3%...yo-yo up and yo-yo down. fast.)  Observations on NOL: Observations on NOL: On 29 Apr 2015, NOL closed with a bearish evening doji star candlestick pattern or uptrend reversal pattern which requires one or two more candles to confirm the reliability and validity of this pattern. (An unconfirmed chart pattern has no further meaning.) The continual sell down of NOL on 30 Apr 2015 closing with a bullish hammer candlestick pattern @ S$1.135 wasn't a decisive bearish confirmation, instead, it's an indication of strong support-buy pressure from the bulls fighting against the bears. BUY for a 2nd round, if you're an aggressive risk-taker.A long black marubozu at EOD closing (with extremely high volume of 42m shares X2) on 30 Apr 2015 would have convincingly signaled that the current intermediate / short-term uptrend on NOL had ended @ S$1.20, point D of the bearish Gartley AB = CD Pattern, which means the 'buy on dip' at or near the 20d SMA has to be reviewed / on HOLD. ( Caution: When BBs run road / final flushing = big dumping of stocks continuously with black marubozu dropping like bird shits all in-a-row, retail players should piggyback to short together with them, not long). If you want to do swing trades (both long and short) on NOL, watch the 50d SMA currently @ S$1.025, once the price hits lower @ S$0.93 the 200d SMA or below the thin purple cloud on the ichimoku chart, it's game over for the bulls. NOL's current prices trading at higher low and higher high may not be the early stage of the impulsive wave-1 up of the Elliott Wave pattern, it could be a bearish Gartley pattern. NOL's bearish Gartley AB = CD Pattern is the same as TigerAir. NOL ~ Bearish Gartley AB = CD Pattern formation NOL closed with a bullish hammer @ S$1.135 (-0.025, 2.2%) with 13m shares done on 30 Apr 2015. Immediate support @ S$1.085, immediate resistance @ S$1.20.  Memorize the basic candlestick patterns Memorize the basic candlestick patterns. 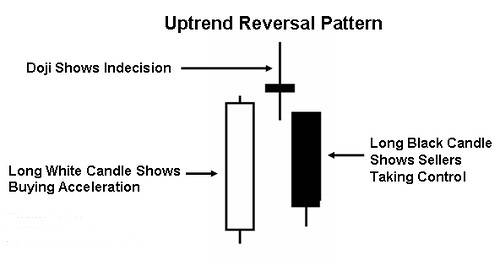 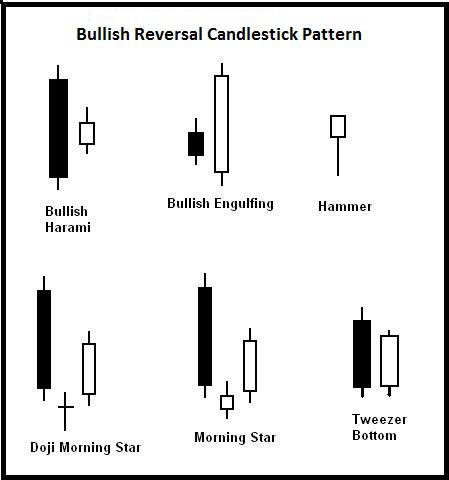 |
|
|
|
NOL
May 5, 2015 8:49:02 GMT 7
odie likes this
Post by sptl123 on May 5, 2015 8:49:02 GMT 7
Bull's News in big print and Bear's News in fine print.Warrant ALKW dropping 11% last two days suggested bearish sentiment of NOL. 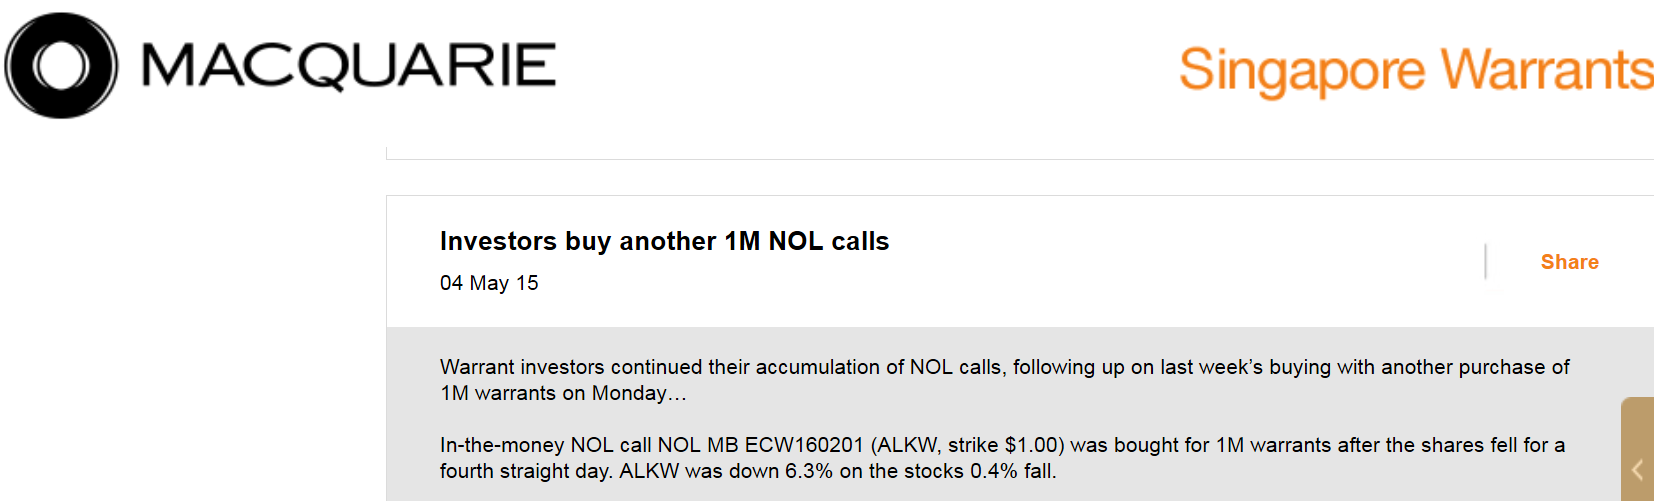 |
|
|
|
NOL
May 16, 2015 10:26:20 GMT 7
oldman likes this
Post by zuolun on May 16, 2015 10:26:20 GMT 7
|
|
|
|
Post by zuolun on May 18, 2015 9:02:00 GMT 7
NOL ~ Bearish Gartley Breakout, interim TP S$0.93, next TP S$0.735NOL had a black marubozu and traded @ S$1.05 (-0.035, -3.2%) with 3.53m shares done on 18 May 2015 at 9.50am. Immediate support @ S$1.02, the 61.8% Fibonacci retracement level, immediate resistance @ S$1.085. 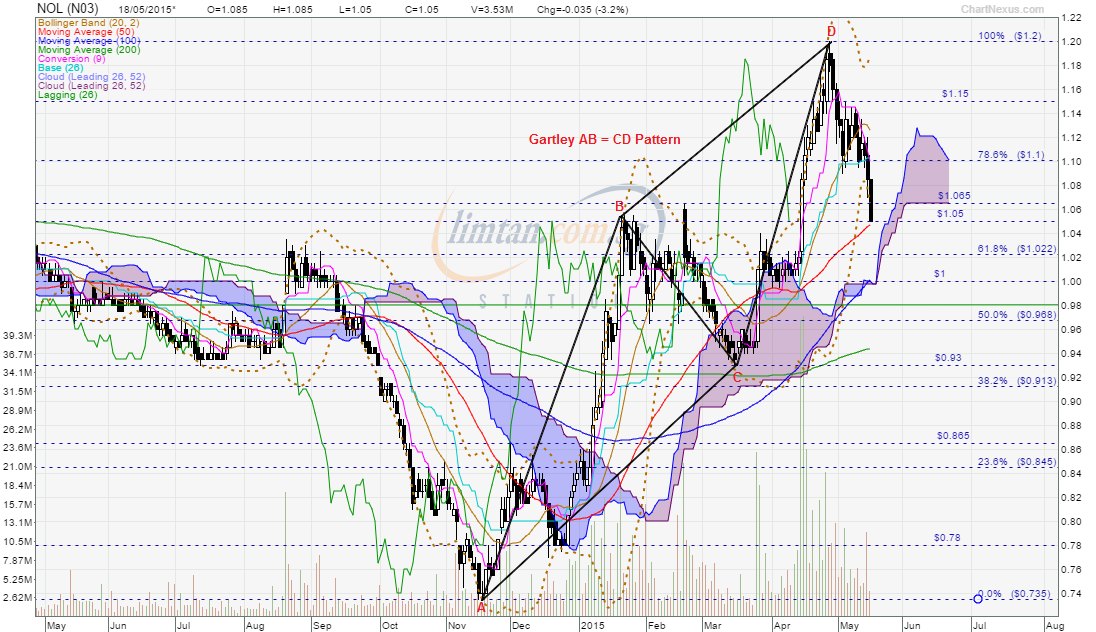 Thank you Bro Zuolun. Monday I run for my life liao. Thank you for the detailed TA. Your passion for TA and selflessness to share is much appreciated and respected by many. I have been wondering : Zuolun= A person ? OR Zuolun= A team of Zuoluns.  Amazing, you are super fast ! Just today for the many posts you written, I probably take longer time to read them than the time you use to construct those posts . With my full respect. sptl123, NOL's share price didn't hit the est. TP at point D @ S$1.255 (see NOL's Gartley AB = CD chart dated 30 Apr 2015) but had peaked @ S$1.20 and had backed down 9.6% trading below the 20d SMA due to NOL's earnings reported as loss instead of profit. The 'buy on dip' should be put on HOLD because NOL is a longterm downtrend stock. Using the The 20d and 200d SMA strategies to'buy on dip' are best applicable to stocks with the primary trend up. Using Fibonacci retracements, compare Civmec and NOL's chart pattern to see where the probable price movement of the latter. Civmec and NOL ~ Bearish Gartley Breakout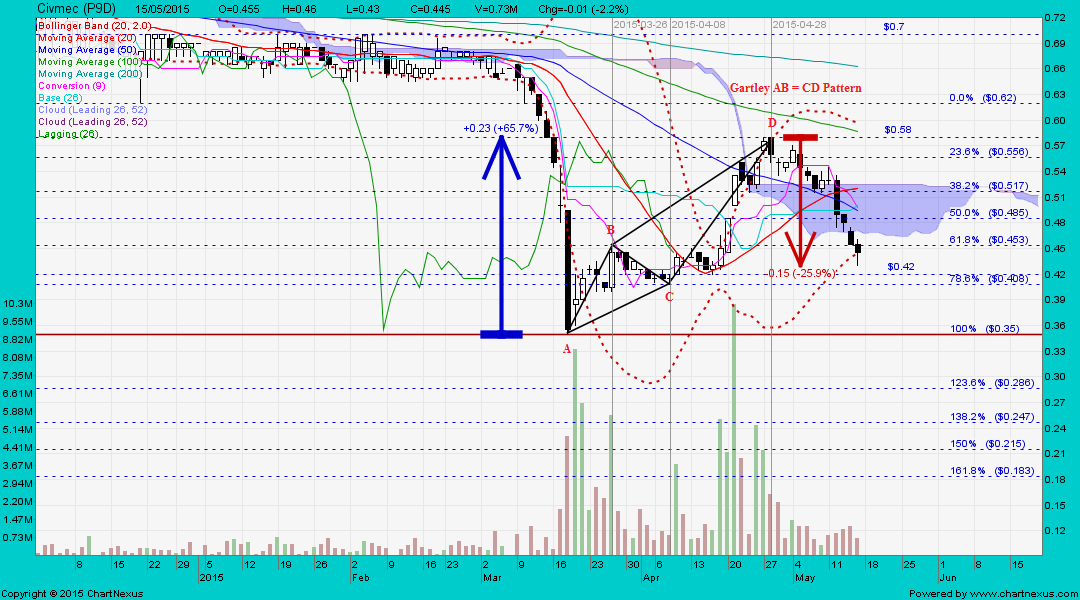 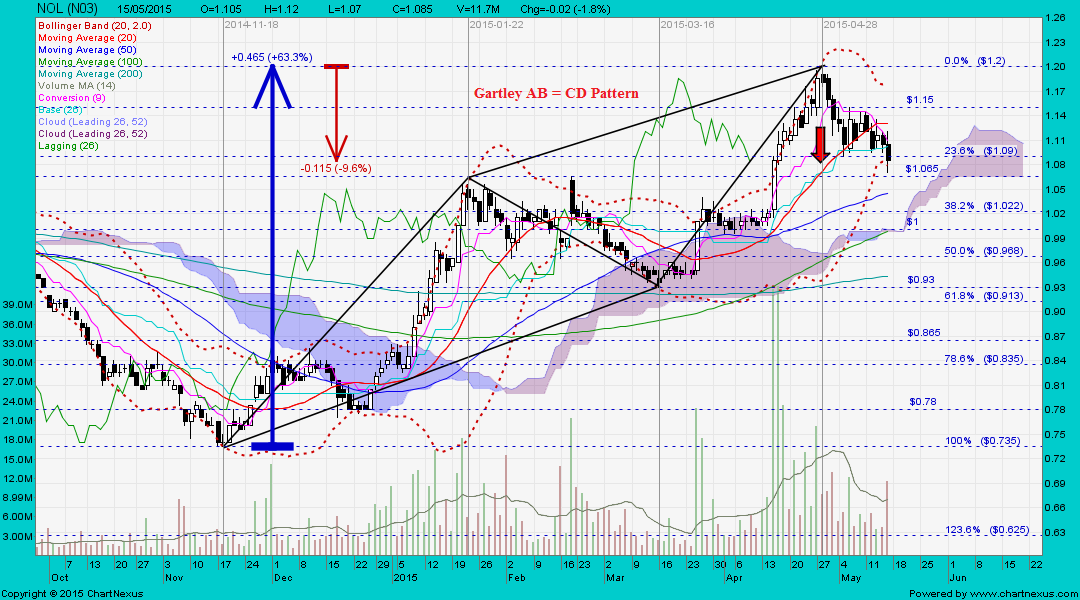
|
|
|
|
Post by zuolun on May 19, 2015 15:55:15 GMT 7
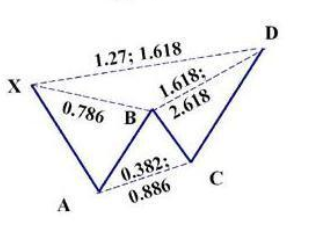
sptl123, See NOL's weeky chart, it's a Bearish Gartley Crab Breakout. Watch the critical support @ S$1.02, once it's taken out, NOL "hari hari jatuh" to become a penny stock, again. NOL ~ Bearish Gartley Breakout, interim TP S$0.93, next TP S$0.735NOL had a spinning top and traded @ S$1.04 (+0.01, +1%) with 6.78m shares done on 19 May 2015 at 4.15pm. Critical support @ S$1.02, the 61.8% Fibonacci retracement level, immediate resistance @ S$1.055.  Gartley Crab pattern Gartley Crab pattern
 NOL (weekly) ~ Bearish Gartley Crab Breakout, interim TP S$0.93, next TP S$0.735 NOL (weekly) ~ Bearish Gartley Crab Breakout, interim TP S$0.93, next TP S$0.735
|
|
|
|
NOL
May 19, 2015 16:50:34 GMT 7
zuolun likes this
Post by sptl123 on May 19, 2015 16:50:34 GMT 7
sptl123, See NOL's weeky chart, it's a Bearish Gartley Crab Breakout. Watch the critical support @ S$1.02, once it's taken out, NOL "hari hari jatuh" to become a penny stock, again. NOL ~ Bearish Gartley Breakout, interim TP S$0.93, next TP S$0.735NOL had a spinning top and traded @ S$1.04 (+0.01, +1%) with 6.78m shares done on 19 May 2015 at 4.15pm. Critical support @ S$1.02, the 61.8% Fibonacci retracement level, immediate resistance @ S$1.055. Thank you very much Bro Zuolun. I ran for my life yesterday morning liao. Very heng for me to have been alerted by you to run road last Sunday. Crab ! my favorite ; I will go and construct the pattern to get myself familiarized with Gartley Crab Pattern. |
|
|
|
Post by zuolun on May 23, 2015 23:24:15 GMT 7
Thank you very much Bro Zuolun. I ran for my life yesterday morning liao. Very heng for me to have been alerted by you to run road last Sunday. Crab ! my favorite ; I will go and construct the pattern to get myself familiarized with Gartley Crab Pattern. Look at NOL's ichimoku daily chart. On Friday 15 May 2015 and Monday 18 May 2015, the share price had EOD closing with bullish hammers; 2 days in a row. It was exactly on Monday 18 May 2015 that the tenkan sen had a bearish crossover below the Kijun sen. The next day on Tuesday 19 May 2015, NOL closed with a long black marubozu @ S$1.02, the 61.8% Fibonacci retracement level. It showed that since the stock peaked at S$1.20 on 28 Apr 2015, many bullish hammers appeared but none of them had any +ve impact on the share price. The moral of the story is that, next time, if you see a bullish hammer, it's not always a buy signal.  NOL ~ Trading in an upward sloping channel NOL ~ Trading in an upward sloping channelNOL closed with a spinning top @ S$1.055 (-0.01, -0.9%) with 6.1m shares done on 22 May 2015. Critical support @ S$1.02, the 61.8% Fibonacci retracement level, immediate resistance @ S$1.065.  NOL (weekly) ~ Bearish Gartley Crab Breakout, interim TP S$0.93, next TP S$0.735 NOL (weekly) ~ Bearish Gartley Crab Breakout, interim TP S$0.93, next TP S$0.735 |
|
|
|
NOL
May 24, 2015 4:27:34 GMT 7
zuolun likes this
Post by sptl123 on May 24, 2015 4:27:34 GMT 7
Thank you Bro Zuolun. With reference to the following daily chart( non-divident-adjusted): At point C, NOL retraced to 61.8% Fibonacci level and making reversal in the last 4 sessions. Do you think it could extends up to 88.6%/100%/128% Fibonacci level? I think that is quite challenging, because from your last divident-adjusted Inchimoku chart: ** Bearish as Chikou span would be below price as long as price do not break above $1.20. This indicate that the price momentum will be still weak. ** Current price still below both Tenkan-Sen and Kijun-Sen shown that the latest down trend has not ended. ** Curent price marginally above a thin Kumo indicate that the next two level of supports provided by Senkou-span A & B are not strong. Bro Zuolun, go or no-go to play the extension?  sptl123Look at NOL's ichimoku daily chart. On Friday 15 May 2015 and Monday 18 May 2015, the share price had EOD closing with bullish hammers; 2 days in a row. It was exactly on Monday 18 May 2015 that the tenkan sen had a bearish crossover below the Kijun sen. The next day on Tuesday 19 May 2015, NOL closed with a long black marubozu @ S$1.02, the 61.8% Fibonacci retracement level. It showed that since the stock peaked at S$1.20 on 28 Apr 2015, many bullish hammers appeared but none of them had any +ve impact on the share price. The moral of the story is that, next time, if you see a bullish hammer, it's not always a buy signal. NOL ~ Trading in an upward sloping channelNOL closed with a spinning top @ S$1.055 (-0.01, -0.9%) with 6.1m shares done on 22 May 2015. Critical support @ S$1.02, the 61.8% Fibonacci retracement level, immediate resistance @ S$1.065. |
|
|
|
Post by zuolun on May 24, 2015 9:24:54 GMT 7
Yes, the latest news (+ve or -ve) and especially a major fundamental change in the stock will negate the entire chart pattern. Two good examples are: SMRT and OLAM.Thank you Bro Zuolun. With reference to the following daily chart( non-divident-adjusted): At point C, NOL retraced to 61.8% Fibonacci level and making reversal in the last 4 sessions. Do you think it could extends up to 88.6%/100%/128% Fibonacci level? I think that is quite challenging, because from your last divident-adjusted Inchimoku chart: ** Bearish as Chikou span would be below price as long as price do not break above $1.20. This indicate that the price momentum will be still weak. ** Current price still below both Tenkan-Sen and Kijun-Sen shown that the latest down trend has not ended. ** Curent price marginally above a thin Kumo indicate that the next two level of supports provided by Senkou-span A & B are not strong. Bro Zuolun, go or no-go to play the extension? , Read the latest shipping news updates (Situational Analysis or SA), b4 you go play the extension; the only wild card left for NOL is privatisation.  |
|
|
|
NOL
May 24, 2015 9:26:58 GMT 7
Post by huathuatleo on May 24, 2015 9:26:58 GMT 7
Bro zuolun, sptl123Kindly find my view on NOL. My humble 2cts. Your comments/advice appreciated.  - There are two trendlines of support, the red and the black (major support). The red trendline broke last Monday with a long bearish Marubozu candle and retraced back to hit the upper blue bearish channel.
- From the top of the channel, price might go into a bearish 3 drive pattern that may turn bullish only around 94-95cts where there is a confluence of support (blue box on chart)- the 200MA and black trendline.
- RSI below 50 and does not exhibit strength on the daily chart.
- Weekly, RSI is seen dropping further with MACD signal line poised to make a bearish cross.
- Trade strategies : Buy at gray line ONLY IF price breaks up/out from the blue channel with TP at $1.2 to play the fib extension , or wait to sell at the purple line once price breaks down from the red trendline (3 drive pattern) with TP at the blue box, confluence area of support. And lastly a buy at the confluence area at 95cts with TP @$1.1 once a reversal candle is seen. Stop loss, 2 pips above or below swing points.
- According to Bro Zuolun's weekly analysis of NOL, initial tp is at 93cts following a Bearish Gartley Crab Breakout.
|
|
|
|
NOL
May 30, 2015 16:21:53 GMT 7
Post by huathuatleo on May 30, 2015 16:21:53 GMT 7
Bro zuolun, sptl123My humble TA update for NOL - 30th May 2015 for your review.   >> There are two trendlines of support on chart, the red and the black (major support). The red trendline broke and price now trending down to test the black trendline. >> From the top of the blue channel, price has gone into a bearish 3 drive pattern that MAY turn bullish only around 94-95cts where there is a confluence of support (blue box on chart)- the 200MA, black trendline, lower bolinger. >> RSI on the daily has gone under 30 and may stay a while in this region. >> Weekly, RSI is seen dropping further with MACD potentially going below the signal line and histo below 0 signalling more bearishness ahead. >> Trade strategies : Buy only at the confluence area at 94-95cts with TP @$1.1 ONLY if a reversal candle pattern (morning start, bullish engulfing etc) is seen. Stop loss, 2 pips above or below swing points. Do note weekly is very bearish bias. Bro zuolun, sptl123Kindly find my view on NOL. My humble 2cts. Your comments/advice appreciated. - There are two trendlines of support, the red and the black (major support). The red trendline broke last Monday with a long bearish Marubozu candle and retraced back to hit the upper blue bearish channel.
- From the top of the channel, price might go into a bearish 3 drive pattern that may turn bullish only around 94-95cts where there is a confluence of support (blue box on chart)- the 200MA and black trendline.
- RSI below 50 and does not exhibit strength on the daily chart.
- Weekly, RSI is seen dropping further with MACD signal line poised to make a bearish cross.
- Trade strategies : Buy at gray line ONLY IF price breaks up/out from the blue channel with TP at $1.2 to play the fib extension , or wait to sell at the purple line once price breaks down from the red trendline (3 drive pattern) with TP at the blue box, confluence area of support. And lastly a buy at the confluence area at 95cts with TP @$1.1 once a reversal candle is seen. Stop loss, 2 pips above or below swing points.
- According to Bro Zuolun's weekly analysis of NOL, initial tp is at 93cts following a Bearish Gartley Crab Breakout.
|
|
|
|
NOL
May 31, 2015 15:01:53 GMT 7
Post by huathuatleo on May 31, 2015 15:01:53 GMT 7
Sgx announcement - 29th May 2015 Completion of the Sale of APL Logistics Ltd to Kintetsu World Express, Inc Neptune Orient Lines Limited (?NOL?) is pleased to announce that it has today completed the sale of its logistics business, APL Logistics Ltd (?APLL?), to Kintetsu World Express, Inc. (?KWE?) for an aggregate purchase price of USD1.2 billion, subject to adjustments for the net cash and net working capital of APLL and its subsidiaries as at the completion date. NOL will announce the final purchase price after such adjustments have been determined. infopub.sgx.com/FileOpen/Completion%20of%20Sale%20of%20APLL.ashx?App=Announcement&FileID=353936Bro zuolun, sptl123My humble TA update for NOL - 30th May 2015 for your review. >> There are two trendlines of support on chart, the red and the black (major support). The red trendline broke and price now trending down to test the black trendline. >> From the top of the blue channel, price has gone into a bearish 3 drive pattern that MAY turn bullish only around 94-95cts where there is a confluence of support (blue box on chart)- the 200MA, black trendline, lower bolinger. >> RSI on the daily has gone under 30 and may stay a while in this region. >> Weekly, RSI is seen dropping further with MACD potentially going below the signal line and histo below 0 signalling more bearishness ahead. >> Trade strategies : Buy only at the confluence area at 94-95cts with TP @$1.1 ONLY if a reversal candle pattern (morning start, bullish engulfing etc) is seen. Stop loss, 2 pips above or below swing points. Do note weekly is very bearish bias. Bro zuolun, sptl123Kindly find my view on NOL. My humble 2cts. Your comments/advice appreciated. - There are two trendlines of support, the red and the black (major support). The red trendline broke last Monday with a long bearish Marubozu candle and retraced back to hit the upper blue bearish channel.
- From the top of the channel, price might go into a bearish 3 drive pattern that may turn bullish only around 94-95cts where there is a confluence of support (blue box on chart)- the 200MA and black trendline.
- RSI below 50 and does not exhibit strength on the daily chart.
- Weekly, RSI is seen dropping further with MACD signal line poised to make a bearish cross.
- Trade strategies : Buy at gray line ONLY IF price breaks up/out from the blue channel with TP at $1.2 to play the fib extension , or wait to sell at the purple line once price breaks down from the red trendline (3 drive pattern) with TP at the blue box, confluence area of support. And lastly a buy at the confluence area at 95cts with TP @$1.1 once a reversal candle is seen. Stop loss, 2 pips above or below swing points.
- According to Bro Zuolun's weekly analysis of NOL, initial tp is at 93cts following a Bearish Gartley Crab Breakout.
|
|
|
|
Post by zuolun on Jun 2, 2015 11:47:48 GMT 7
NOL ~ Fall off the cliff, interim TP S$0.93, next TP S$0.735NOL traded with a long black marubozu @ S$0.975 (-0.04, -3.9%) with 5.77m shares done on 2 Jun 2015 at 1245hrs. Immediate support @ S$0.965, immediate resistance @ S$1.02.  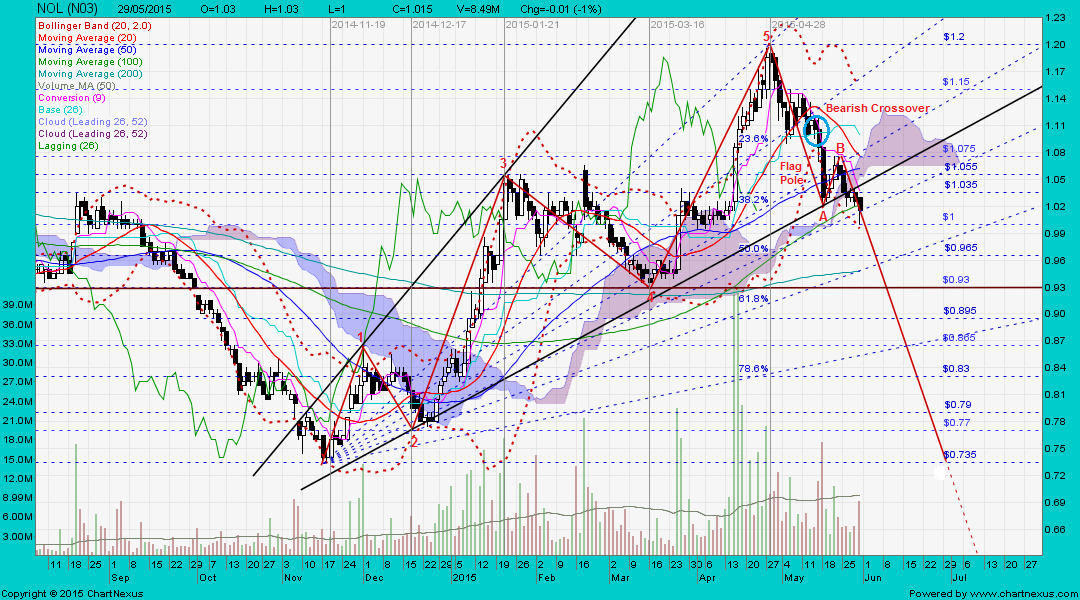 Thank you Bro Zuolun. With reference to the following daily chart( non-divident-adjusted): At point C, NOL retraced to 61.8% Fibonacci level and making reversal in the last 4 sessions. Do you think it could extends up to 88.6%/100%/128% Fibonacci level? I think that is quite challenging, because from your last divident-adjusted Inchimoku chart: ** Bearish as Chikou span would be below price as long as price do not break above $1.20. This indicate that the price momentum will be still weak. ** Current price still below both Tenkan-Sen and Kijun-Sen shown that the latest down trend has not ended. ** Curent price marginally above a thin Kumo indicate that the next two level of supports provided by Senkou-span A & B are not strong. Bro Zuolun, go or no-go to play the extension?
|
|
|
|
NOL
Jun 2, 2015 21:56:09 GMT 7
Post by sptl123 on Jun 2, 2015 21:56:09 GMT 7
Thank you very Bro Zuolun for you have saved me twice from this sinking ship ! 感恩大哥救了我. sptl123, See NOL's weeky chart, it's a Bearish Gartley Crab Breakout. Watch the critical support @ S$1.02, once it's taken out, NOL "hari hari jatuh" to become a penny stock, again. NOL ~ Bearish Gartley Breakout, interim TP S$0.93, next TP S$0.735NOL had a spinning top and traded @ S$1.04 (+0.01, +1%) with 6.78m shares done on 19 May 2015 at 4.15pm. Critical support @ S$1.02, the 61.8% Fibonacci retracement level, immediate resistance @ S$1.055. Thank you very much Bro Zuolun. I ran for my life yesterday morning liao. Very heng for me to have been alerted by you to run road last Sunday. Crab ! my favorite ; I will go and construct the pattern to get myself familiarized with Gartley Crab Pattern. NOL ~ Fall off the cliff, interim TP S$0.93, next TP S$0.735NOL traded with a long black marubozu @ S$0.975 (-0.04, -3.9%) with 5.77m shares done on 2 Jun 2015 at 1245hrs. Immediate support @ S$0.965, immediate resistance @ S$1.02. |
|
|
|
Post by zuolun on Jun 7, 2015 13:18:50 GMT 7
Thank you very Bro Zuolun for you have saved me twice from this sinking ship ! 感恩大哥救了我. , 上楼爬楼梯,下楼坐电梯。(Going up slowing by climbing the stairs, coming down quickly by taking the elevator.) For NOL, you only did the long-trades and made some profits. Have you ever thought of playing the intermediate bearish trend reversal or the short-trades immediately after you had successfully run road on all your long positions? The profit on the short-trades in NOL as of now; anywhere at or near the peak on 28 Apr 2015 to the last closing price on 5 Jun 2015 should be much faster (S$1.20 - S$0.95 = S$0.25 or 20.8%). Based on NOL's chart pattern, price action and trading volume; the major cheng kay appeared to have 'goreng' the +ve APL logistics sales news by pumping up NOL since mid-Nov 2014 and then dumped the stock in end-Apr 2015, prior to the -ve 1Q 2015 qtrly earnings results released on 14 May 2015. NOL ~ Bear Flag Breakout, interim TP S$0.93, next TP S$0.735NOL closed with a black marubozu @ S$0.95 (-0.02, -2.1%) with 5.81m shares done on 5 Jun 2015. Immediate support @ S$0.93, immediate resistance @ S$0.965.  NOL 1Q15 results below expectation, OCBC issued SELL TP S$0.92 NOL 1Q15 results below expectation, OCBC issued SELL TP S$0.92 ~ 15 May 2015 NOL registers net loss of US$11 million in 1Q 2015 ~ 14 May 2015 Macquarie: Bull's News in big print and Bear's News in fine print ~ 4 May 2015 Goldman Sachs upgraded NOL to buy TP S$1.30 ~ 25 Mar 2015 Macquarie upgrades NOL to outperform TP S$1.40 (potential 44% upside) ~ 12 Mar 2015 CIMB upgraded NOL from hold to add TP S$1.53, expect 10.55 Ct special dividend." ~ 21 Feb 2015 NOL confirms sale of APL Logistics to Kintetsu World Express for $1.2bn ~ 17 Feb 2015 OCBC says sell NOL... but DBS Vickers says buy ~ 16 Feb 2015 NOL - Realistic chances of turnaround, DBSV rated ‘buy’ TP S$1.10 ~ 16 Jan 2015 NOL faces tough decisions on box line future after any sale of APL Logistics ~ 19 Dec 2014 UOBKH issued ‘buy’ on NOL TP S$1.01 ~ 19 Nov 2014 Would selling APL Logistics be good for NOL? ~ 22 Aug 2014 NOL exploring possible sale or IPO of APL Logistics ~ 20 Aug 2014 NOL (weekly) ~ Bearish Gartley Crab Breakout, interim TP S$0.93, next TP S$0.735 |
|


 Amazing, you are super fast !


